807 Jones Ave · Rockmart, GA
Flood risk 1/10 · Minimal
- FEMA flood zone
- X (unshaded)
- Chance of flooding over 30 yrs
- 0.0%
- Est. flood insurance / yr
- $507 – $1,088
Fire risk 4/10 · Minor
- Est. fire insurance / yr
- $963 – $1,789
Heat risk 6/10 · Moderate
- Hot days now (above 104°F)
- 7 days/yr
- Hot days in 30 yrs
- 18 days/yr
Wind risk 4/10 · Minor
- Chance of severe wind over 30 yrs
- 23.0%
Air-quality risk 3/10 · Minor
- Unhealthy air days now
- 4 days/yr
- Unhealthy air days in 30 yrs
- 4 days/yr
Risk factors via First Street. Map © Google.
Why this score? — see what drove the C+ grade
The composite is a weighted blend of 9 inputs, each scored 0–100. Each bar is that input's sub-score; the figure is the points it added to the 100-point composite (weight × sub-score).
- Cash flow +25.3/30.0
- ARV discount +13.7/15.0
- DSCR +8.3/10.0
- 1% rule +5.5/10.0
- Livability +3.5/5.0
- Rent growth +2.5/5.0
- Condition / age +2.5/5.0
- Schools +2.1/10.0
- Appreciation +0.0/10.0
$159,900
🖨 Deal sheet 📄 Offer letter ✓ Due diligence
Listing remarks
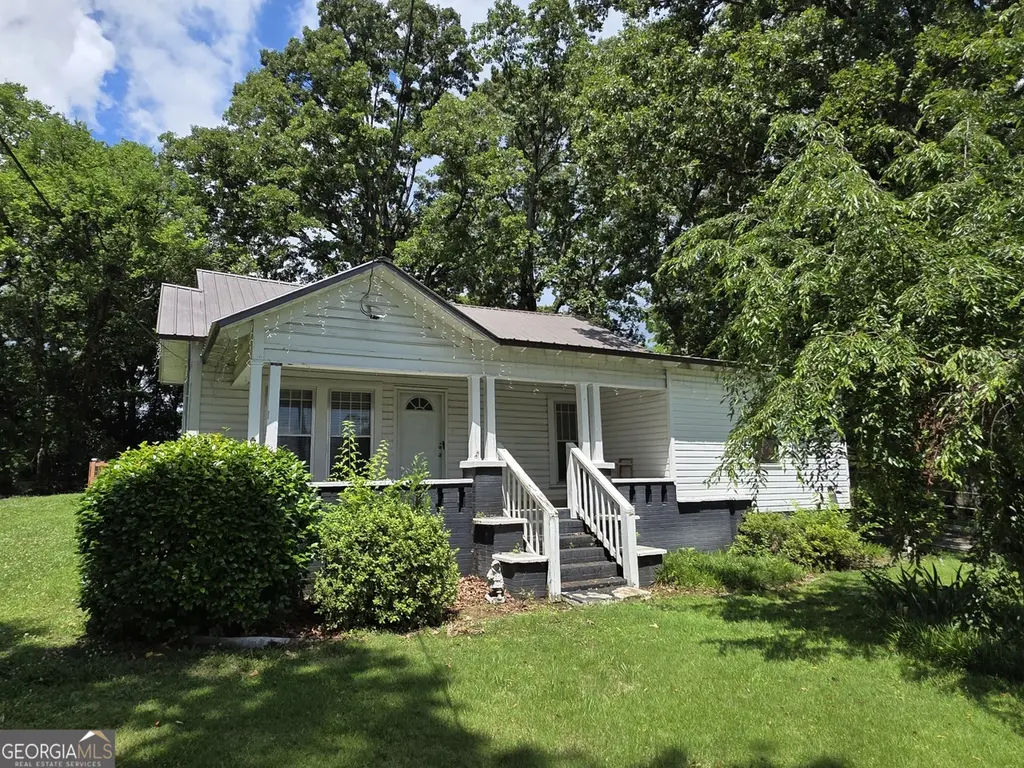
High atop a hill overlooking the city sits this charming little bungalow nestled beneath tall, towering oak trees that provide plenty of shade for the home and front porch. Situated on a large fenced city lot, the property also features a carport and an additional outbuilding for storage or workshop. This home features 3 bedrooms, 2 baths. It is sold "AS IS"! Cash or Conventional Buyers only.
Key facts
- Carport
- 0.57 acre lot
- 2 parking spots
Tags
Property features AI
Finance
- Other: Lot is approximately 0.57 acres; level to sloped
- HOA & community: No HOA
Exterior
- Parking: Carport
- Utilities: Public water; Public sewer; Electricity available; High speed internet available
- Home design: Single family residence; House; Fixer condition; Built in 1900
- Construction: Wood siding; Metal roof; Block foundation
- Exterior features: Front porch
Interior
- Bedrooms: 3 bedrooms on the main level
- Flooring: Hardwood flooring; Laminate flooring
- Bathrooms: 2 full bathrooms on the main level
- Heating & cooling: Central heating; Central air conditioning
- Interior features: One-level home; Crawl space basement; Family room with fireplace
- Laundry & utility: Laundry area (other)
Neighborhood map
What this means for you Summary
Snapshot
- This is a 3-bed/1.0-bath single-family listed at $160k.
Deal economics
- At list price, monthly cash flow is $363 ($4k/yr) — positive.
- The deal already cash-flows at list — no discount required.
- Meets the 1% rule at list price ($2k rent vs $160k).
- Cap rate 9.0% vs local median 4.2% in Rockmart — top-decile yield for the area; either an underpriced asset or a hidden risk that comps aren't pricing in. Stress-test before assuming the spread holds.
Location & tenants
- Location reads 70/100 on livability (#99 in GA) — a middle-class / working-renter tenant base. Strengths: cost of living A+, housing A+, health & safety A+; Watch: crime C-, amenities F, commute F.
- Polk County (town): math 21% / reading 28% proficiency, ranked #128 of 174 in GA (top 74%) — low school quality limits family demand, transient renter base, plan for 1-2y turnover; 62% free/reduced lunch — lower-income household profile, screen leases tightly.
- Zoned schools: Rockmart Middle School (math 22% / reading 31%, grade F, #282 of 470 statewide, top 61%, 706 students, 78% FRL); Rockmart High School (math 8% / reading 22%, grade F, #294 of 424 statewide, top 70%, 950 students, 78% FRL) — zoned schools average 78% FRL vs 62% district-wide (16 pts higher); higher-poverty schools than district average — tighter screening recommended.
- Market conditions: 198 active listings in the ZIP; 2 comparable units currently listed for rent nearby; 128 units permitted in Polk County in 2024 (0 in 5+ unit buildings).
- This rent runs 35% of the median local income ($57k/yr) — at the standard rent-burdened threshold; future hikes will face affordability resistance.
Forward outlook
- Local home prices are declining (-3.0%/yr); year-one equity from $1k of loan paydown is wiped out by about $5k of value loss. Plan a longer hold.
- Polk County population projected to shrink 10% by 2050 — rents likely to lag national; underwrite the cash flow, not the appreciation.
Negotiation context
- Only 7 days on market — expect competitive offers; lowballing is unlikely to land.
Risks & watch-outs
- Watch-outs: built in 1900 — expect roof / HVAC / electrical / plumbing capex.
- Climate carrying-cost: extreme-heat days projected 7→18/yr by 2055 (HVAC capex compounding) — expect insurance premiums to compound above CPI over the hold.
Questions for the listing agent
- Built in 1900 — when were the roof, HVAC, electrical panel, plumbing, and water heater last replaced?
- Is there a deadline driving the sale (1031 exchange, divorce, estate, relocation)? That informs how much negotiation room exists.
- Schools are F-rated, which usually means shorter tenancies and higher turnover. Who's the typical renter profile here, and what's been the actual vacancy rate?
- What's the average days-on-market for RENTAL listings here right now (not sales)? A rising rental-DOM trend means longer vacancies and softer asking-rent achievability than the comps imply.
- What's the recent tenant-quality profile in this submarket — average credit score on applications, eviction rate, late-payment / NSF rate, and stable-employment percentage? A property-management company in the area should have these aggregated.
- How much new for-sale + rental construction is in the pipeline within 1–3 miles? Heavy new supply typically softens prices + rents 12–24 months out; constrained supply supports both.
Investment metrics
- 1% rule
- 1.05% ✓
- Cap rate
- 9.02%
- Cash-on-cash
- 9.73%
- DSCR
- 1.43
- GRM
- 7.9
CMA / ARV
- ARV (on-the-fly)
- $185,280
- Comps found
- 12
Show comp detail 12 sales within ~0.75 mi
| Address | Dist | Beds/Ba | Sqft | Sold | Price | $/sf | Match |
|---|---|---|---|---|---|---|---|
| 821 Wilson St | 0.11mi | 2/2.0 (-1) | 1,054 (+10%) | 0mo | $230,000 | $218 | 69 |
| 209 Hunter St | 0.23mi | 3/1.0 | 1,050 (+9%) | 10mo | $199,000 | $190 | 65 |
| 218 Litchfield St | 0.33mi | 2/1.0 (-1) | 896 (-7%) | 13mo | $170,000 | $190 | 58 |
| 534 Lane St | 0.38mi | 2/2.0 (-1) | 1,014 (+6%) | 13mo | $240,000 | $237 | 53 |
| 232 Litchfield St | 0.39mi | 2/1.0 (-1) | 1,088 (+13%) | 2mo | $208,000 | $191 | 53 |
| 200 Litchfield St | 0.27mi | 2/1.5 (-1) | 1,088 (+13%) | 7mo | $185,000 | $170 | 52 |
| 611 Jones Ave | 0.29mi | 2/2.0 (-1) | 864 (-10%) | 14mo | $200,000 | $231 | 49 |
| 4019 3rd Ave | 0.62mi | 2/1.0 (-1) | 864 (-10%) | 1mo | $175,000 | $203 | 49 |
| 404 Sciple St | 0.51mi | 3/1.0 | 1,104 (+15%) | 6mo | $65,000 | $59 | 47 |
| 664 Goodyear Ave | 0.46mi | 2/1.0 (-1) | 1,088 (+13%) | 9mo | $210,000 | $193 | 44 |
| 696 Goodyear Ave | 0.70mi | 2/1.0 (-1) | 1,088 (+13%) | 2mo | $195,000 | $179 | 39 |
| 569 Lane St | 0.56mi | 3/2.0 | 1,088 (+13%) | 12mo | $215,000 | $198 | 38 |
Match score weights: distance 35% · size 25% · config 20% · recency 20%. Top-matched comps best support the ARV.
Projected returns pro-forma
-3.0% appreciation · 3.0% rent growth · sell at horizon
- IRR
- -1.7%
- Equity multiple
- 0.94×
- Total profit
- $-2,860
- Equity at exit
- $23,842
- IRR
- 8.0%
- Equity multiple
- 1.60×
- Total profit
- $27,020
- Equity at exit
- $13,825
Cash invested: $44,772 (down + closing). Projections, not guarantees.
Landlord ↔ Tenant lean methodology
- Overall (STATE)
- 90 Strongly Landlord-Friendly
- State Georgia
- 90 Strongly Landlord-Friendly · R+3
- County
- — inherits STATE
- City
- — inherits STATE
ZIP-level market 30153
- Home prices YoY
- -4.6%
- Active inventory
- 198
- Price-to-rent
- 7.9×
Monthly cashflow live
- Estimated rent
- $1,679 medium interval (Pro) →
- Mortgage (P&I)
- −$839
- Tax from tax record
- −$58 /mo · $700/yr
- Insurance
- −$67
- HOA
- −$0
- Vacancy / Maint / Mgmt
- −$353
- Net cashflow
- $363
Break-even live
UW: 25.0% down · 7.5% · 30yr · 1.5% tax · 5.0% vac · 8.0% maint · 8.0% mgmt
Financing live
Cash to close
- Down payment
- $39,975
- Closing costs
- $4,797
- Reserves months
- —
- Total cash needed
- —
Loan-product check · same deal, 3 products live
Conventional
25% down · 7.5% · 30yr
- Down + closing
- —
- Monthly P&I
- —
- Monthly cashflow
- —
- DSCR
- —
- Eligible?
- —
Personal DTI + credit; lowest rate.
DSCR
20% down · 8.5% · 30yr
- Down + closing
- —
- Monthly P&I
- —
- Monthly cashflow
- —
- DSCR
- —
- Eligible?
- —
No personal income docs; deal must DSCR.
Hard money
10% down · 12.0% · 12mo
- Down + closing
- —
- Monthly P&I
- —
- Monthly cashflow
- —
- DSCR
- —
- Eligible?
- —
Short-term bridge; refi at stabilization.
Rent comps 2 comps
| Address | Beds | Baths | Sqft | Rent | $/sqft | DOM | Units | Dist |
|---|---|---|---|---|---|---|---|---|
| 712 Jackson St Rockmart, GA | 3.0 | 1.5 | 600 | $1,245 | $2.08 | 2d | 1 | 0.72mi |
| 840 Martin Luther King Jr St Rockmart, GA | 3.0 | 1.0 | 959 | $1,200 | $1.25 | 43d | 1 | 1.19mi |
Listing history 7 events
-
2026-06-08statusdays on market $159,900 Pending 7 DOM
-
2026-06-07days on market $159,900 Active 6 DOM
-
2026-06-04days on market $159,900 Active 3 DOM
-
2026-06-03days on market $159,900 Active 2 DOM
-
2026-06-02status $159,900 Active 1 DOM
-
2026-06-01remarks 395-char remark
-
2026-06-01$159,900 New 1 DOM
ⓘ Source: listings_history table (triggers on properties + properties_extension) + one-shot
backfill from property_details.listing_events for pre-trigger history.
Tax reassessment forecast GA · Resets to sale price
- Current annual tax
- $700 · $58/mo
- Projected year-2 tax
- $1,471 · $123/mo
- Expected delta
- +$771/yr (+$64/mo · 110.0%)
ⓘ Screening estimate from a state-policy table — verify with the county assessor before closing.
Climate risk First Street
- Flood 1/10 Low FEMA zone X (unshaded) · 0% chance over 30 yrs
- Wildfire 4/10 Moderate
- Heat 6/10 Major 7 d/yr ≥104°F today · 18 d/yr by 30 yrs out
- Wind 4/10 Moderate 23% chance of damaging wind over 30 yrs
- Air quality 3/10 Moderate 4 unhealthy d/yr today · 4 by 30 yrs out
Nearby sold comps map
Loading sold comps map…
Walkable amenities ~0.75 mi
Loading nearby amenities…
Taxation est. · year 1
- Rental income
- $20,148
- − Mortgage interest
- −$8,957
- − Property taxes
- −$700
- − Insurance
- −$800
- − Repairs & maintenance
- −$1,612
- − Management
- −$1,612
- − Depreciation
- −$4,652
- Taxable income
- $1,816
- Est. tax owed @ 24.0%
- −$436
- After-tax cash flow
- $3,919/yr
For passive investors: Depreciation is non-cash, so a rental often shows a tax loss while cash-flowing — sheltering income. Rental losses are passive: they offset passive income freely, and up to $25,000/yr can offset ordinary (W-2) income if you actively participate and your MAGI is under $100k (phasing out to $0 by $150k); unused losses carry forward. On sale, claimed depreciation is recaptured at up to 25%, and gains may owe capital-gains tax (a 1031 exchange can defer both). Figures are a year-1 estimate at your 24.0% rate — not tax advice; consult a CPA.
Schools (NCES district)
- District
- Polk County
- NCES district ID
- 1304200
- Math proficiency
- 21% ▼ -15.00%
- Reading proficiency
- 28% ▼ -3.00%
- Median HH income
- $39,318
- Composite
- 20.6/100
- National rank
- #8550
- State rank
- #128 of 174 in GA
Livability — Rockmart
- Score
- 70/100
- State rank
- #99
- US rank
- #7891
Category grades
Schools grade is shown separately in the Schools card above.
Census & demographics
- Census place
- Rockmart, GA
- County
- Polk County · 18,467 people
- City population
- 18,467
- Metro
- Cedartown, GA
- Population (ZIP)
- 18,467
- Household income
- $57,377
- Rent vs Own
- Severe rent burden
- 340.0
Population outlook (Polk County) Hauer SSP2
- Today (2025)
- 40,729 people
- By 2030
- 40,103 · -1.5%
- By 2040
- 38,594 · -5.2%
- By 2050
- 36,753 · -9.8%
- By 2075
- 31,687 · -22.2%
- By 2100
- 25,448 · -37.5%
Race, ethnicity, and origin ACS 2023
- Neighborhood character
- Predominantly White (81%)
- Race & ethnicity
- White 81% Black 10% Hispanic / Latino 6% Two or more races 4% Asian 1%
- Hispanic origin (detail)
- Mexican 4% Puerto Rican 2%
- Common ancestry
- Italian 2% Slovak 1% Romanian 1%
- Foreign-born
- 3% · Canada, China
- Languages at home
- 95% English-only · Spanish 2% Other Indo-European 1% German/W. Germanic 1%
Political lean MEDSL · Polk
- 2024 margin
- Solid R (+60.5) · D 19.6% · R 80.1%
- 2008→2024 swing
- -19.4pp toward R · 2008: -41.1pp · 2024: -60.5pp
- All cycles
- 2024: R+60.5 2020: R+57.1 2016: R+57.5 2012: R+45.6 2008: R+41.1
Not yet ingested
- Civics
- —
Market trends
- HPI YoY
- ▼ -18.01%
- Current HPI
- 370.1814
- Rent YoY
- —
- Metro
- Cedartown, GA
- State GDP YoY
- ▲ 2.66%
- F500 in state
- 28
Industry mix (Fortune 500 HQ in GA)
| Industry | F500 HQs | Revenue |
|---|---|---|
| Paper / Packaging | 2 | $29B |
|
||
| Retail | 1 | $160B |
|
||
| Transportation / Logistics | 1 | $91B |
|
||
| Airlines | 1 | $62B |
|
||
| Consumer Goods | 1 | $47B |
|
||
| Utilities | 1 | $25B |
|
||
Price history
1 event — show timeline
- 2026-05-30 Listed $159,900 GAMLS
Property tax history
+2.5%/yrLatest (2025): $700 · +7.8% YoY. Source: county tax records.
Cash-flow waterfall
monthlySold comps — $/sqft
last 12 mo · ≤1 miLoading sold comps…