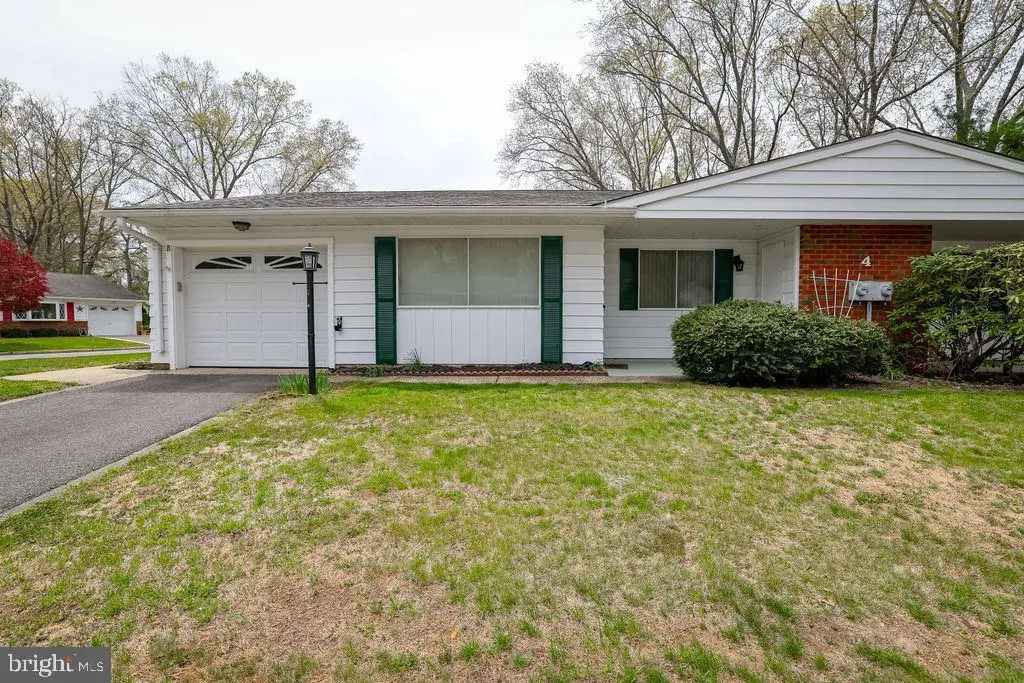
4 Maryland Ave Unit B · Cedar Glen Lakes, NJ
Flood risk 1/10 · Minimal
- FEMA flood zone
- X (unshaded)
- Chance of flooding over 30 yrs
- 0.0%
- Est. flood insurance / yr
- $507 – $1,088
Fire risk 6/10 · Moderate
- Est. fire insurance / yr
- $526 – $976
Heat risk 6/10 · Moderate
- Hot days now (above 103°F)
- 7 days/yr
- Hot days in 30 yrs
- 14 days/yr
Wind risk 6/10 · Moderate
- Chance of severe wind over 30 yrs
- 67.0%
Air-quality risk 4/10 · Minor
- Unhealthy air days now
- 4 days/yr
- Unhealthy air days in 30 yrs
- 5 days/yr
Risk factors via First Street. Map © Google.
Why this score? — see what drove the B+ grade
The composite is a weighted blend of 9 inputs, each scored 0–100. Each bar is that input's sub-score; the figure is the points it added to the 100-point composite (weight × sub-score).
- Cash flow +28.9/30.0
- ARV discount +15.0/15.0
- 1% rule +10.0/10.0
- DSCR +10.0/10.0
- Condition / age +4.0/5.0
- Livability +3.2/5.0
- Schools +2.9/10.0
- Rent growth +2.5/5.0
- Appreciation +0.0/10.0
$112,500
🖨 Deal sheet (PDF) 📄 Offer letter ✓ Due diligence
Listing remarks
A beautifully maintained co-op home located in a welcoming, picturesque community. Originally a two-bedroom layout, this residence has been thoughtfully transformed into a spacious one-bedroom with an open-concept living area. The redesign creates an airy, modern flow perfect for comfortable living and effortless entertaining. Can easily be converted back to a two bedroom.
Key facts
- $503 HOA
- Garage
- Built 1978
Property features AI
Finance
- Other: Not in a federal flood zone; Pets allowed (dogs OK)
- HOA & community: Monthly coop/condo fee of $503; Fee includes common area maintenance; Community amenities include a clubhouse
Exterior
- Parking: Attached front-entry garage (1 space); Driveway parking
- Utilities: Public water; Public sewer; Electric hot water
- Home design: Cooperative ownership; Located in a senior community (55+)
- Construction: Year built: estimated
- Exterior features: Above-grade other structures; Corner unit
Interior
- Bedrooms: One bedroom on the main level
- Bathrooms: One full bathroom on the main level
- Heating & cooling: Electric baseboard heating; Central air conditioning (electric)
- Interior features: Unit is not furnished; No basement
- Laundry & utility: Laundry on the main floor
Neighborhood map
What this means for you Summary
Snapshot
- This is a 1-bed/1.0-bath condo listed at $112k. Condition is rated good.
Deal economics
- At list price, monthly cash flow is $380 ($5k/yr) — positive.
- The deal already cash-flows at list — no discount required.
- Meets the 1% rule at list price ($2k rent vs $112k).
- Recommended offer: $109k (3.0% below list) — sets the bar for market timing.
Location & tenants
- Location reads 64/100 on livability (#406 in NJ) — a middle-class / working-renter tenant base. Strengths: crime A+, cost of living A+, housing A+; Watch: schools F, amenities F, commute F.
- Manchester Township School District (suburban): math 25% / reading 44% proficiency, ranked #320 of 472 in NJ (top 68%) — families likely to look elsewhere, expect single-tenant / working-renter base with shorter leases.
- Market conditions: 648 active listings in the ZIP; 2 comparable units currently listed for rent nearby; 4,434 units permitted in Ocean County in 2024 (868 in 5+ unit buildings).
Forward outlook
- Local home prices are declining (-3.0%/yr); year-one equity from $778 of loan paydown is wiped out by about $3k of value loss. Plan a longer hold.
- Ocean County population projected to shrink 8% by 2050 — rents likely to lag national; underwrite the cash flow, not the appreciation.
- At projected returns (-3.0% appreciation + 3.0% rent growth), your $32k cash investment doubles in ~8 years — after that, you're playing with house money.
Negotiation context
- It's been on market 52 days — a 3% lower offer ($109k) is reasonable based on typical stale-listing flexibility.
Risks & watch-outs
- Watch-outs: HOA is 24% of rent.
- Climate carrying-cost: major wind risk, 67% chance of damaging wind over 30y; major wildfire risk; extreme-heat days projected 7→14/yr by 2055 (HVAC capex compounding) — expect insurance premiums to compound above CPI over the hold.
Questions for the listing agent
- It's been on market 52 days. Have you received any prior offers? Is the seller open to a 3% concession, seller financing, or rate buy-down credit?
- Built in 1978 — when were the roof, HVAC, electrical panel, plumbing, and water heater last replaced?
- What does the HOA fee cover, when was the last increase, and are there any pending special assessments or reserve-fund shortfalls?
- Any open or pending special assessments — roof, HVAC, plumbing, elevator, façade? What's the per-unit balance and payoff schedule, and is the seller paying it off at close or rolling it to the buyer?
- Is there a deadline driving the sale (1031 exchange, divorce, estate, relocation)? That informs how much negotiation room exists.
- Schools are F-rated, which usually means shorter tenancies and higher turnover. Who's the typical renter profile here, and what's been the actual vacancy rate?
- What's the average days-on-market for RENTAL listings here right now (not sales)? A rising rental-DOM trend means longer vacancies and softer asking-rent achievability than the comps imply.
- What's the recent tenant-quality profile in this submarket — average credit score on applications, eviction rate, late-payment / NSF rate, and stable-employment percentage? A property-management company in the area should have these aggregated.
- How much new apartment / multifamily construction is in the pipeline within 1–3 miles? Heavy new supply (>2% of stock underway) typically softens rents 12–24 months out; light construction supports rent growth.
Investment metrics
- 1% rule
- 1.87% ✓
- Cap rate
- 10.35%
- Cash-on-cash
- 14.47%
- DSCR
- 1.64
- GRM
- 4.5
CMA / ARV
- ARV (median comp)
- $156,191
- List price
- $112,500
- Delta
- -27.97%
- Verdict
- UNDERPRICED
- Comps
- 4 within 1.0 mi
Projected returns pro-forma
-3.0% appreciation · 3.0% rent growth · sell at horizon
- IRR
- 5.2%
- Equity multiple
- 1.20×
- Total profit
- $6,310
- Equity at exit
- $16,774
- IRR
- 14.8%
- Equity multiple
- 2.21×
- Total profit
- $38,039
- Equity at exit
- $9,727
Cash invested: $31,500 (down + closing). Projections, not guarantees.
Landlord ↔ Tenant lean methodology
- Overall (STATE)
- 21 Tenant-Leaning
- State New Jersey
- 21 Tenant-Leaning · D+6
- County
- — inherits STATE
- City
- — inherits STATE
ZIP-level market 08759
- Active inventory
- 648
- Price-to-rent
- 4.5×
Monthly cashflow live
- Estimated rent
- $2,102 medium interval (Pro) →
- Mortgage (P&I)
- −$590
- Tax est. 1.5%
- −$141 /mo · $1,688/yr
- Insurance
- −$47
- HOA
- −$503
- Vacancy / Maint / Mgmt
- −$441
- Net cashflow
- $380
Break-even live
Sensitivity live
| Price | -10% $458 | -5% $419 | +0% $380 | +5% $341 | +10% $302 |
|---|---|---|---|---|---|
| Rent | -10% $214 | -5% $297 | +0% $380 | +5% $463 | +10% $546 |
| Rate | -1.0pp $437 | -0.5pp $409 | base $380 | +0.5pp $351 | +1.0pp $321 |
UW: 25.0% down · 7.5% · 30yr · 1.5% tax · 5.0% vac · 8.0% maint · 8.0% mgmt
Financing live
Cash to close
- Down payment
- $28,125
- Closing costs
- $3,375
- Reserves months
- —
- Total cash needed
- —
Loan-product check · same deal, 3 products live
Conventional
25% down · 7.5% · 30yr
- Down + closing
- —
- Monthly P&I
- —
- Monthly cashflow
- —
- DSCR
- —
- Eligible?
- —
Personal DTI + credit; lowest rate.
DSCR
20% down · 8.5% · 30yr
- Down + closing
- —
- Monthly P&I
- —
- Monthly cashflow
- —
- DSCR
- —
- Eligible?
- —
No personal income docs; deal must DSCR.
Hard money
10% down · 12.0% · 12mo
- Down + closing
- —
- Monthly P&I
- —
- Monthly cashflow
- —
- DSCR
- —
- Eligible?
- —
Short-term bridge; refi at stabilization.
Rent comps 2 comps
| Address | Beds | Baths | Sqft | Rent | $/sqft | DOM | Units | Dist |
|---|---|---|---|---|---|---|---|---|
| 50 Westport Dr #71 Whiting, NJ | 2.0 | 1.0 | 1120 | $2,200 | $1.96 | 1d | 1 | 1.16mi |
| 49 Westport Dr #71 Whiting, NJ | 2.0 | 1.5 | 1192 | $1,995 | $1.67 | 44d | 1 | 1.19mi |
HOA detail condo
- Monthly dues
- $503 · $6,036/yr
- Assessments
- None detected in remarks — confirm with the listing agent.
Listing history 14 events
-
2026-06-18days on market $112,500 Active 52 DOM
-
2026-06-17days on market $112,500 Active 51 DOM
-
2026-06-16days on market $112,500 Active 50 DOM
-
2026-06-15days on market $112,500 Active 49 DOM
-
2026-06-13days on market $112,500 Active 47 DOM
-
2026-06-09days on market $112,500 Active 43 DOM
-
2026-06-08days on market $112,500 Active 42 DOM
-
2026-06-07days on market $112,500 Active 41 DOM
-
2026-06-04days on market $112,500 Active 38 DOM
-
2026-06-03days on market $112,500 Active 37 DOM
-
2026-06-02days on market $112,500 Active 36 DOM
-
2026-06-01days on market $112,500 Active 35 DOM
-
2026-05-31days on market $112,500 Active 34 DOM
-
2026-04-27$115,000 Active 375-char remark
ⓘ Source: listings_history table (triggers on properties + properties_extension) + one-shot
backfill from property_details.listing_events for pre-trigger history.
Climate risk First Street
- Flood 1/10 Low FEMA zone X (unshaded) · 0% chance over 30 yrs
- Wildfire 6/10 Major
- Heat 6/10 Major 7 d/yr ≥103°F today · 14 d/yr by 30 yrs out
- Wind 6/10 Major 67% chance of damaging wind over 30 yrs
- Air quality 4/10 Moderate 4 unhealthy d/yr today · 5 by 30 yrs out
Nearby sold comps map
Loading sold comps map…
Walkable amenities ~0.75 mi
Loading nearby amenities…
Taxation est. · year 1
- Rental income
- $25,221
- − Mortgage interest
- −$6,302
- − Property taxes
- −$1,688
- − Insurance
- −$562
- − Repairs & maintenance
- −$2,018
- − Management
- −$2,018
- − HOA
- −$6,036
- − Depreciation
- −$3,273
- Taxable income
- $3,325
- Est. tax owed @ 24.0%
- −$798
- After-tax cash flow
- $3,761/yr
For passive investors: Depreciation is non-cash, so a rental often shows a tax loss while cash-flowing — sheltering income. Rental losses are passive: they offset passive income freely, and up to $25,000/yr can offset ordinary (W-2) income if you actively participate and your MAGI is under $100k (phasing out to $0 by $150k); unused losses carry forward. On sale, claimed depreciation is recaptured at up to 25%, and gains may owe capital-gains tax (a 1031 exchange can defer both). Figures are a year-1 estimate at your 24.0% rate — not tax advice; consult a CPA.
Condition & rehab AI · 12 photos
A well-maintained, one-bedroom co-op home with a good condition score. Minor updates to the kitchen and painting would significantly enhance its resale value.
Repairs flagged
- Moderate Kitchen cabinets — Appears dated and could benefit from updating
- Moderate Bathtub and fixtures — Need updating for a fresh look
Value-add opportunities
- Resale Updating kitchen cabinets and fixtures — Freshens the space and adds value
- Resale Painting interior walls — Fresh paint enhances curb appeal
- Resale Updating countertops — Modernizes the kitchen and adds value
Renovation cost estimate screening
| Repair item | Severity | Est. cost |
|---|---|---|
| Kitchen cabinets · Appears dated and could benefit from updating | Moderate | $3,000–15,000 |
| Bathtub and fixtures · Need updating for a fresh look | Moderate | $3,000–15,000 |
| Total estimated repair cost · 2 items | $6,000–30,000 |
Value-add ROI direction
- Resale Updating kitchen cabinets and fixtures — Freshens the space and adds value ↑
- Resale Painting interior walls — Fresh paint enhances curb appeal ↑
- Resale Updating countertops — Modernizes the kitchen and adds value ↑
ⓘ Cost ranges are severity-bucket heuristics (US national rule-of-thumb). Get contractor quotes + a written scope before underwriting a rehab budget.
Schools (NCES district)
- District
- Manchester Township School District
- NCES district ID
- 3409450
- Math proficiency
- 25% ▼ -17.00%
- Reading proficiency
- 44% ▼ -5.00%
- Median HH income
- $38,905
- Composite
- 28.8/100
- National rank
- #6662
- State rank
- #320 of 472 in NJ
Livability — Cedar Glen Lakes
- Score
- 64/100
- State rank
- #406
- US rank
- #14186
Category grades
Schools grade is shown separately in the Schools card above.
Census & demographics
- Census place
- Cedar Glen Lakes, NJ
- City population
- 34,290
- Population (ZIP)
- 34,290
Population outlook (Ocean County) Hauer SSP2
- Today (2025)
- 586,991 people
- By 2030
- 581,403 · -1.0%
- By 2040
- 564,913 · -3.8%
- By 2050
- 538,149 · -8.3%
- By 2075
- 468,845 · -20.1%
- By 2100
- 350,297 · -40.3%
Race, ethnicity, and origin ACS 2023
- Neighborhood character
- Predominantly White (87%)
- Race & ethnicity
- White 87% Hispanic / Latino 5% Black 4% Two or more races 4% Asian 2%
- Hispanic origin (detail)
- Puerto Rican 2%
- Common ancestry
- Romanian 8% Scotch-Irish 2% Lithuanian 2%
- Foreign-born
- 11% · Canada, China
- Languages at home
- 88% English-only · Spanish 3% Russian/Polish/Slavic 2% Other Indo-European 2%
Political lean MEDSL · Ocean
- 2024 margin
- Solid R (+36.0) · D 31.4% · R 67.4% · Other 1.2%
- 2008→2024 swing
- -17.6pp toward R · 2008: -18.4pp · 2024: -36.0pp
- All cycles
- 2024: R+36.0 2020: R+28.7 2016: R+34.0 2012: R+17.7 2008: R+18.4
Not yet ingested
- Civics
- —
Market trends
- HPI YoY
- ▼ -347.85%
- Current HPI
- 274.4679
- Rent YoY
- —
- Metro
- —
- State GDP YoY
- ▲ 2.05%
- F500 in state
- 34
Industry mix (Fortune 500 HQ in NJ)
| Industry | F500 HQs | Revenue |
|---|---|---|
| Consumer Goods | 3 | $31B |
|
||
| Pharmaceuticals | 2 | $153B |
|
||
| Technology | 2 | $21B |
|
||
| Insurance | 2 | $20B |
|
||
| Healthcare | 2 | $19B |
|
||
| Financial Services | 1 | $70B |
|
||
Price history
-2.2% since first listed2 events — show timeline
- 2026-05-20 Price Changed $112,500 BRIGHT MLS
- 2026-04-27 Listed $115,000 BRIGHT MLS
Cash-flow waterfall
monthlySold comps — $/sqft
last 12 mo · ≤1 miLoading sold comps…