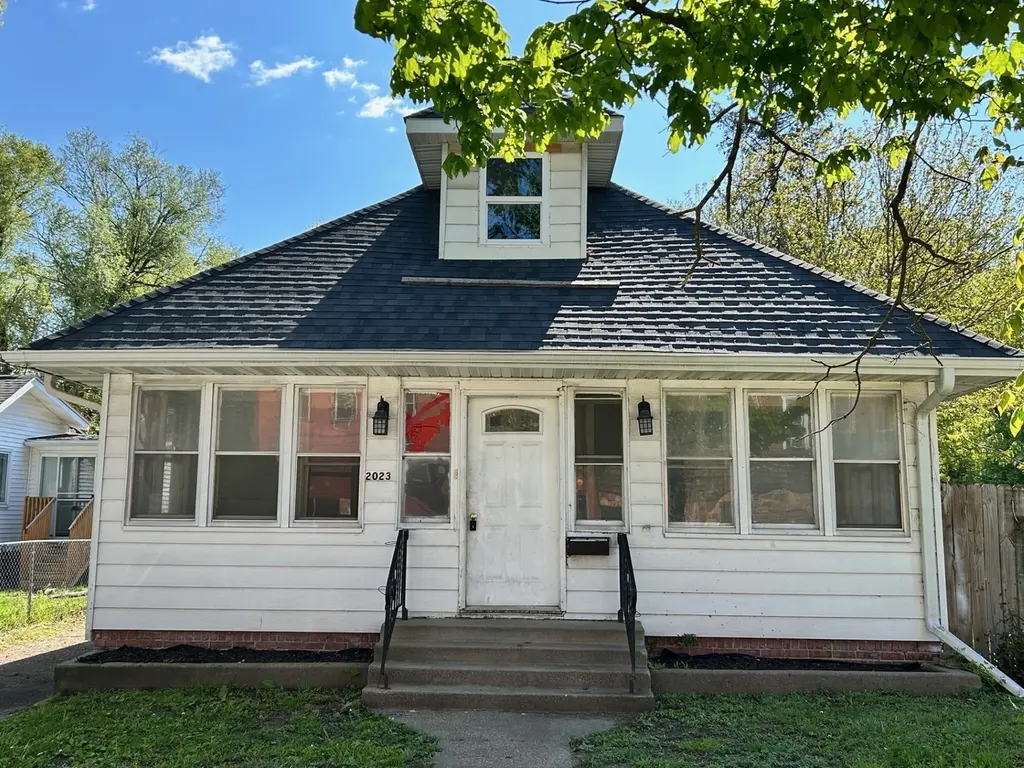
2023 SE 6th St · Des Moines, IA
Flood risk 4/10 · Minor
- FEMA flood zone
- X (unshaded)
- Chance of flooding over 30 yrs
- 0.24%
- Est. flood insurance / yr
- $473 – $860
Fire risk 2/10 · Minimal
- Est. fire insurance / yr
- $902 – $1,676
Heat risk 3/10 · Minor
- Hot days now (above 103°F)
- 7 days/yr
- Hot days in 30 yrs
- 15 days/yr
Wind risk 2/10 · Minimal
- Chance of severe wind over 30 yrs
- —
Air-quality risk 2/10 · Minimal
- Unhealthy air days now
- 1 days/yr
- Unhealthy air days in 30 yrs
- 2 days/yr
Risk factors via First Street. Map © Google.
Why this score? — see what drove the B- grade
The composite is a weighted blend of 9 inputs, each scored 0–100. Each bar is that input's sub-score; the figure is the points it added to the 100-point composite (weight × sub-score).
- Cash flow +29.3/30.0
- DSCR +10.0/10.0
- 1% rule +9.4/10.0
- ARV discount +7.5/15.0
- Livability +4.0/5.0
- Schools +3.8/10.0
- Rent growth +3.4/5.0
- Condition / age +2.5/5.0
- Appreciation +0.0/10.0
$105,500
🖨 Deal sheet 📄 Offer letter ✓ Due diligence
Listing remarks MLS
Welcome to this centrally located Bungalow just a hop skip and jump away from Downtown Des Moines attractions and shopping. This the perfect size home for any stage of life with 2 bedrooms and 3/4 Bath on the main level, perfect for your guest. The finished attic has a 1 large bedroom, Full bathroom and large walk in closet with built in storage. The kitchen was recently updated and the fridge is like brand new! Separate dining area with a bar top pass through from the kitchen. Keep the dirt outside when entering through the mudroom/Laundry off the back of the house or the nice enclosed front porch. Large partially fenced back yard could be used for anything your heart desires! I love all the original woodwork come see for yourself! This is located in a “Green” NFC Lending area and qualifies for a $10,000 forgivable grant think of all the possibilities here! Ask agent for more info!
Key facts
- Oak kitchen
- Large lot
- Fenced backyard
Tags
Property features AI
Exterior
- Utilities: Public sewer
- Home design: Single-family residence zoning (R)
- Construction: Metal siding; Brick/mortar foundation; Asphalt shingle roof
- Exterior features: Wood fencing; Asphalt road access; Lot dimensions approximately 44 x 265
Interior
- Bedrooms: 2 main-level bedrooms
- Flooring: Hardwood; Tile
- Bathrooms: One three-quarter bathroom
- Heating & cooling: Forced air heating (natural gas); Central air conditioning
- Interior features: Dining area; Hardwood flooring; Tile flooring; Unfinished basement
Neighborhood map
What this means for you Summary
Snapshot
- This is a 3-bed/2.0-bath single-family listed at $106k.
Deal economics
- At list price, monthly cash flow is $371 ($4k/yr) — positive.
- The deal already cash-flows at list — no discount required.
- Meets the 1% rule at list price ($2k rent vs $106k).
- Recommended offer: $104k (1.5% below list) — sets the bar for market timing.
- Cap rate 10.5% vs local median 3.1% in Des Moines — top-decile yield for the area; either an underpriced asset or a hidden risk that comps aren't pricing in. Stress-test before assuming the spread holds.
Location & tenants
- Location reads 81/100 on livability (#63 in IA, #1,432 nationally) — a professional / high-income tenant draw. Strengths: commute A+, cost of living A+, housing A+; Watch: employment C-, schools D+, crime F.
- Des Moines Independent Community School District (urban): math 43% / reading 46% proficiency, ranked #289 of 289 in IA (top 100%) — families likely to look elsewhere, expect single-tenant / working-renter base with shorter leases; 63% free/reduced lunch — lower-income household profile, screen leases tightly.
- Market conditions: Rents rising (+3.5%/yr); 227 active listings in the ZIP; 20 comparable units currently listed for rent nearby; rentals at typical pace (median 14d on market — plan ~3-4 weeks tenant-placement turnaround); 2,953 units permitted in Polk County in 2024 (540 in 5+ unit buildings).
- This rent runs 30% of the median local income ($61k/yr) — at the standard rent-burdened threshold; future hikes will face affordability resistance.
Forward outlook
- Local home prices are declining (-3.0%/yr); year-one equity from $729 of loan paydown is wiped out by about $3k of value loss. Plan a longer hold.
- Polk County population projected at +37% by 2050 — long-run rental-demand tailwind backs the buy-and-hold thesis.
- At projected returns (-3.0% appreciation + 3.5% rent growth), your $30k cash investment doubles in ~8 years — after that, you're playing with house money.
Negotiation context
- It's been on market 17 days — a 2% lower offer ($104k) is reasonable based on typical stale-listing flexibility.
- 7 sale attempts since 20y ago with the ask held roughly flat each time — persistent listings suggest the price (not the market) is what's stuck; bring a comps-based counter.
- Current owner paid $91k; 15% above their basis — modest negotiation headroom, anchor on the comps not their cost.
Risks & watch-outs
- Watch-outs: property tax is 2.6% of price; built in 1912 — expect roof / HVAC / electrical / plumbing capex.
Questions for the listing agent
- Built in 1912 — when were the roof, HVAC, electrical panel, plumbing, and water heater last replaced?
- Property tax is high relative to price — has the assessment been appealed recently, and will the sale trigger a re-assessment?
- Is there a deadline driving the sale (1031 exchange, divorce, estate, relocation)? That informs how much negotiation room exists.
- Schools are D-rated, which usually means shorter tenancies and higher turnover. Who's the typical renter profile here, and what's been the actual vacancy rate?
- Crime grade is F in this area — have there been break-ins, vandalism, or insurance claims at this property in the last 3 years? What carrier currently insures it and at what premium?
- What's the average days-on-market for RENTAL listings here right now (not sales)? A rising rental-DOM trend means longer vacancies and softer asking-rent achievability than the comps imply.
- What's the recent tenant-quality profile in this submarket — average credit score on applications, eviction rate, late-payment / NSF rate, and stable-employment percentage? A property-management company in the area should have these aggregated.
- How much new for-sale + rental construction is in the pipeline within 1–3 miles? Heavy new supply typically softens prices + rents 12–24 months out; constrained supply supports both.
Investment metrics
- 1% rule
- 1.44% ✓
- Cap rate
- 10.51%
- Cash-on-cash
- 15.07%
- DSCR
- 1.67
- GRM
- 5.8
CMA / ARV
- ARV (on-the-fly)
- $220,880
- Comps found
- 12
Show comp detail 12 sales within ~0.75 mi
| Address | Dist | Beds/Ba | Sqft | Sold | Price | $/sf | Match |
|---|---|---|---|---|---|---|---|
| 202 E Olinda Ave | 0.41mi | 2/1.5 (-1) | 1,257 (+0%) | 1mo | $166,000 | $132 | 73 |
| 441 E Dunham Ave | 0.24mi | 3/2.0 | 1,158 (-8%) | 4mo | $250,000 | $216 | 73 |
| 843 Hartford Ave | 0.22mi | 4/1.0 (+1) | 1,279 (+2%) | 7mo | $155,000 | $121 | 72 |
| 816 E Dunham Ave | 0.29mi | 3/2.0 | 1,142 (-9%) | 7mo | $227,500 | $199 | 66 |
| 2000 SW 1st St | 0.64mi | 2/2.0 (-1) | 1,240 (-1%) | 2mo | $218,000 | $176 | 61 |
| 1812 SE 2nd St | 0.53mi | 3/2.0 | 1,361 (+8%) | 1mo | $97,500 | $72 | 61 |
| 336 E Broad St | 0.71mi | 2/1.0 (-1) | 1,255 (0%) | 0mo | $135,000 | $108 | 58 |
| 2325 SE 6th St | 0.27mi | 4/2.5 (+1) | 1,096 (-13%) | 4mo | $260,000 | $237 | 56 |
| 1944 SW 1st St | 0.68mi | 4/1.0 (+1) | 1,244 (-1%) | 3mo | $165,500 | $133 | 56 |
| 226 E Bell Ave | 0.53mi | 3/2.0 | 1,094 (-13%) | 4mo | $175,200 | $160 | 51 |
| 323 E Broad St | 0.75mi | 3/3.5 | 1,372 (+9%) | 2mo | $270,000 | $197 | 42 |
| 80 Lacona Ave | 0.74mi | 2/1.0 (-1) | 1,428 (+14%) | 0mo | $262,500 | $184 | 33 |
Match score weights: distance 35% · size 25% · config 20% · recency 20%. Top-matched comps best support the ARV.
Projected returns pro-forma
-3.0% appreciation · 3.48% rent growth · sell at horizon
- IRR
- 6.4%
- Equity multiple
- 1.25×
- Total profit
- $7,358
- Equity at exit
- $15,730
- IRR
- 16.2%
- Equity multiple
- 2.36×
- Total profit
- $40,228
- Equity at exit
- $9,122
Cash invested: $29,540 (down + closing). Projections, not guarantees.
Landlord ↔ Tenant lean methodology
- Overall (STATE)
- 83 Strongly Landlord-Friendly
- State Iowa
- 83 Strongly Landlord-Friendly · R+6
- County
- — inherits STATE
- City
- — inherits STATE
ZIP-level market 50315
- Rents YoY
- 3.5%
- Active inventory
- 227
- Price-to-rent
- 5.8×
Monthly cashflow live
- Estimated rent
- $1,517 high interval (Pro) →
- Mortgage (P&I)
- −$553
- Tax from tax record
- −$230 /mo · $2,764/yr
- Insurance
- −$44
- HOA
- −$0
- Vacancy / Maint / Mgmt
- −$319
- Net cashflow
- $371
Break-even live
UW: 25.0% down · 7.5% · 30yr · 1.5% tax · 5.0% vac · 8.0% maint · 8.0% mgmt
Financing live
Cash to close
- Down payment
- $26,375
- Closing costs
- $3,165
- Reserves months
- —
- Total cash needed
- —
Loan-product check · same deal, 3 products live
Conventional
25% down · 7.5% · 30yr
- Down + closing
- —
- Monthly P&I
- —
- Monthly cashflow
- —
- DSCR
- —
- Eligible?
- —
Personal DTI + credit; lowest rate.
DSCR
20% down · 8.5% · 30yr
- Down + closing
- —
- Monthly P&I
- —
- Monthly cashflow
- —
- DSCR
- —
- Eligible?
- —
No personal income docs; deal must DSCR.
Hard money
10% down · 12.0% · 12mo
- Down + closing
- —
- Monthly P&I
- —
- Monthly cashflow
- —
- DSCR
- —
- Eligible?
- —
Short-term bridge; refi at stabilization.
Rent comps 20 comps
| Address | Beds | Baths | Sqft | Rent | $/sqft | DOM | Units | Dist |
|---|---|---|---|---|---|---|---|---|
| 240 E Dunham Ave Des Moines, IA | 4.0 | 1.0 | 1462 | $1,795 | $1.23 | 14d | 1 | 0.46mi |
| 1201 E Bell Ave Des Moines, IA | 3.0 | 2.0 | 1107 | $1,100 | $0.99 | 14d | 1 | 0.57mi |
| 1405 SE 1st St Des Moines, IA | 1.0–2.0 | 1.0–2.0 | 802 | $1,435 | $1.79 | 14d | 8 | 0.62mi |
| 100 Jackson Ave Des Moines, IA | 3.0 | 1.0–2.0 | 885 | $1,718 | $1.94 | 14d | 21 | 0.76mi |
| 404 E Pleasant View Dr Des Moines, IA | 3.0 | 2.0 | 936 | $1,125 | $1.20 | 43d | 1 | 0.82mi |
| 700 Monona Ave Des Moines, IA | 1.0–2.0 | 1.0 | 875 | $1,100 | $1.26 | 23d | 3 | 0.87mi |
| 3130 Indianola Ave Des Moines, IA | 1.0–2.0 | 1.0 | 900 | $1,495 | $1.66 | 43d | 1 | 0.94mi |
| 1627 E Glenwood Dr Des Moines, IA | 3.0 | 1.0 | 1040 | $1,295 | $1.25 | 43d | 1 | 1.03mi |
| 201 SE 6th St Des Moines, IA | 2.0 | 1.0–2.0 | 835 | $1,660 | $1.99 | 14d | 11 | 1.10mi |
| 601 E Vine St Des Moines, IA | 2.0 | 1.0–2.0 | 730 | $1,595 | $2.18 | 18d | 19 | 1.17mi |
| 103 SW 3rd St Des Moines, IA | 2.0 | 1.0–2.0 | 725 | $2,043 | $2.82 | 14d | 17 | 1.24mi |
| 425 SW 11th St Des Moines, IA | 2.0 | 1.0–2.0 | 879 | $2,384 | $2.71 | 14d | 38 | 1.28mi |
| 320 SW 7th St Des Moines, IA | 1.0–2.0 | 1.0–2.0 | 920 | $1,459 | $1.59 | 14d | 10 | 1.29mi |
| 101 2nd Ave Des Moines, IA | 1.0–2.0 | 1.0–2.0 | 948 | $1,224 | $1.29 | 14d | 21 | 1.29mi |
| 100 2nd Ave Des Moines, IA | 1.0–2.0 | 1.0–2.0 | 836 | $1,150 | $1.37 | 21d | 23 | 1.30mi |
| 119 4th St #110 Des Moines, IA | 2.0 | 2.0 | 1158 | $1,900 | $1.64 | 43d | 1 | 1.34mi |
| 315 Miller Ave Des Moines, IA | 3.0 | 1.0 | 1018 | $1,595 | $1.57 | 43d | 1 | 1.35mi |
| 308 Court Ave Des Moines, IA | 1.0–2.0 | 1.0–2.0 | 844 | $1,350 | $1.60 | 14d | 11 | 1.37mi |
| 312 Court Ave Des Moines, IA | 1.0–2.0 | 1.0–2.0 | 771 | $1,347 | $1.75 | 14d | 6 | 1.40mi |
| 210 SW 11th St Des Moines, IA | 3.0 | 1.0–2.5 | 947 | $2,827 | $2.98 | 14d | 90 | 1.49mi |
Listing history 14 events
-
2026-06-18days on market $105,500 Active 17 DOM
-
2026-06-17days on market $105,500 Active 16 DOM
-
2026-06-16days on market $105,500 Active 15 DOM
-
2026-06-15days on market $105,500 Active 14 DOM
-
2026-06-14days on market $105,500 Active 12 DOM
-
2026-06-13days on market $105,500 Active 11 DOM
-
2026-06-10days on market $105,500 Active 9 DOM
-
2026-06-09days on market $105,500 Active 8 DOM
-
2026-06-08days on market $105,500 Active 7 DOM
-
2026-06-07days on market $105,500 Active 6 DOM
-
2026-06-05days on market $105,500 Active 3 DOM
-
2026-06-03days on market $105,500 Active 2 DOM
-
2026-06-01remarks 699-char remark
-
2026-06-01$105,500 Active 1 DOM
ⓘ Source: listings_history table (triggers on properties + properties_extension) + one-shot
backfill from property_details.listing_events for pre-trigger history.
Tax reassessment forecast IA · Partial reset (capped growth)
- Current annual tax
- $2,764 · $230/mo
- Projected year-2 tax
- $2,764 · $230/mo
- Expected delta
- $0/yr ($0/mo · 0.0%)
ⓘ Screening estimate from a state-policy table — verify with the county assessor before closing.
Climate risk First Street
- Flood 4/10 Moderate FEMA zone X (unshaded) · 24% chance over 30 yrs
- Wildfire 2/10 Low
- Heat 3/10 Moderate 7 d/yr ≥103°F today · 15 d/yr by 30 yrs out
- Wind 2/10 Low
- Air quality 2/10 Low 1 unhealthy d/yr today · 2 by 30 yrs out
Nearby sold comps map
Loading sold comps map…
Walkable amenities ~0.75 mi
Loading nearby amenities…
Taxation est. · year 1
- Rental income
- $18,207
- − Mortgage interest
- −$5,910
- − Property taxes
- −$2,764
- − Insurance
- −$528
- − Repairs & maintenance
- −$1,457
- − Management
- −$1,457
- − Depreciation
- −$3,069
- Taxable income
- $3,023
- Est. tax owed @ 24.0%
- −$726
- After-tax cash flow
- $3,727/yr
For passive investors: Depreciation is non-cash, so a rental often shows a tax loss while cash-flowing — sheltering income. Rental losses are passive: they offset passive income freely, and up to $25,000/yr can offset ordinary (W-2) income if you actively participate and your MAGI is under $100k (phasing out to $0 by $150k); unused losses carry forward. On sale, claimed depreciation is recaptured at up to 25%, and gains may owe capital-gains tax (a 1031 exchange can defer both). Figures are a year-1 estimate at your 24.0% rate — not tax advice; consult a CPA.
Schools (NCES district)
- District
- Des Moines Independent Community School District
- NCES district ID
- 1908970
- Math proficiency
- 43% ▼ -6.00%
- Reading proficiency
- 46% ▼ -1.00%
- Median HH income
- $45,905
- Composite
- 37.83/100
- National rank
- #4331
- State rank
- #289 of 289 in IA
Livability — Des Moines
- Score
- 81/100
- State rank
- #63
- US rank
- #1432
Category grades
Schools grade is shown separately in the Schools card above.
Census & demographics
- Census place
- Des Moines, IA
- County
- Polk County · 453,298 people
- City population
- 203,612
- Metro
- Des Moines-West Des Moines, IA
- Population (ZIP)
- 34,816
- Household income
- $60,590
- Rent vs Own
- Severe rent burden
- 1072.0
Population outlook (Polk County) Hauer SSP2
- Today (2025)
- 548,042 people
- By 2030
- 588,557 · +7.4%
- By 2040
- 670,629 · +22.4%
- By 2050
- 752,830 · +37.4%
- By 2075
- 955,069 · +74.3%
- By 2100
- 1,115,436 · +103.5%
Race, ethnicity, and origin ACS 2023
- Neighborhood character
- Predominantly White (66%)
- Race & ethnicity
- White 66% Hispanic / Latino 19% Two or more races 11% Black 9% Asian 2%
- Hispanic origin (detail)
- Mexican 14%
- Common ancestry
- Iranian 2% Portuguese 2% Italian 2%
- Foreign-born
- 10% · Canada, Philippines
- Languages at home
- 83% English-only · Spanish 13% Other Asian/Pacific 1%
Political lean MEDSL · Polk
- 2024 margin
- D (+10.9) · D 54.8% · R 43.9% · Other 1.3%
- 2008→2024 swing
- -3.7pp toward R · 2008: 14.6pp · 2024: 10.9pp
- All cycles
- 2024: D+10.9 2020: D+15.2 2016: D+11.5 2012: D+14.2 2008: D+14.6
Not yet ingested
- Civics
- —
Market trends
- HPI YoY
- ▼ -259.03%
- Current HPI
- 269.7231
- Rent YoY
- ▲ 3.48%
- Metro
- Des Moines-West Des Moines, IA
- State GDP YoY
- ▲ 2.48%
- F500 in state
- 4
Industry mix (Fortune 500 HQ in IA)
| Industry | F500 HQs | Revenue |
|---|---|---|
| Financial Services | 1 | $16B |
|
||
| Retail / Convenience | 1 | $15B |
|
||
Price history
+95.4% since first listed20 events — show timeline
- 2026-05-31 Listed $105,500 DMMLS
- 2025-12-02 Sold (Public Records) $91,372 Public Records
- 2018-04-20 Sold (Public Records) $107,000 Public Records
- 2018-04-19 Sold (MLS) $107,000 DMMLS
- 2018-03-21 Pending — DMMLS
- 2018-03-08 Listed $110,000 DMMLS
- 2016-08-29 Sold (MLS) $89,900 DMMLS
- 2016-05-26 Listed $89,900 DMMLS
- 2016-05-19 Listing Removed — DMMLS
- 2016-01-04 Listed $99,900 DMMLS
- 2015-04-02 Sold (Public Records) $32,000 Public Records
- 2015-04-01 Sold (MLS) $31,950 DMMLS
- 2015-01-27 Listed $33,999 DMMLS
- 2015-01-05 Sold (Public Records) $23,795 Public Records
- 2015-01-05 Sold (Public Records) $23,795 Public Records
- 2014-09-10 Listing Removed — DMMLS
- 2014-03-10 Listed $78,500 DMMLS
- 2006-04-20 Sold (Public Records) $50,000 Public Records
- 2006-02-16 Listed $47,900 DMMLS
- 2005-09-27 Sold (Public Records) $54,000 Public Records
Property tax history
+6.7%/yrLatest (2025): $2,764 · +2.2% YoY. Source: county tax records.
Cash-flow waterfall
monthlySold comps — $/sqft
last 12 mo · ≤1 miLoading sold comps…