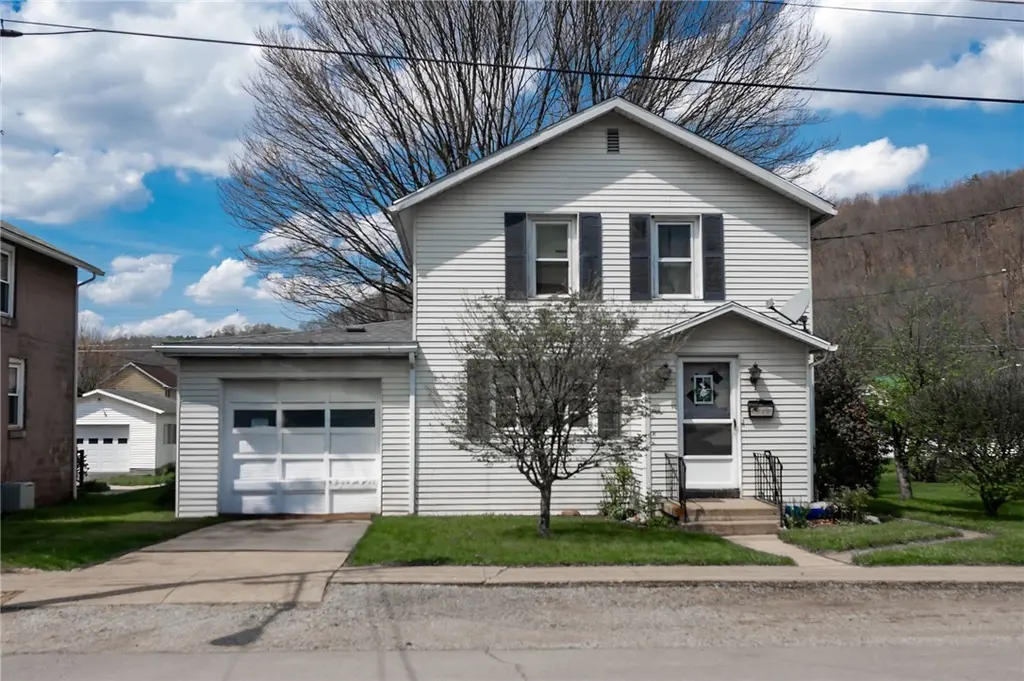
240 Morris St · Clymer, PA
Flood risk 4/10 · Minor
- FEMA flood zone
- X (unshaded)
- Chance of flooding over 30 yrs
- 0.21%
- Est. flood insurance / yr
- $473 – $860
Fire risk 1/10 · Minimal
- Est. fire insurance / yr
- $511 – $949
Heat risk 4/10 · Minor
- Hot days now (above 94°F)
- 8 days/yr
- Hot days in 30 yrs
- 19 days/yr
Wind risk 2/10 · Minimal
- Chance of severe wind over 30 yrs
- —
Air-quality risk 3/10 · Minor
- Unhealthy air days now
- 2 days/yr
- Unhealthy air days in 30 yrs
- 4 days/yr
Risk factors via First Street. Map © Google.
Why this score? — see what drove the A- grade
The composite is a weighted blend of 9 inputs, each scored 0–100. Each bar is that input's sub-score; the figure is the points it added to the 100-point composite (weight × sub-score).
- Cash flow +30.0/30.0
- ARV discount +15.0/15.0
- 1% rule +10.0/10.0
- DSCR +10.0/10.0
- Appreciation +7.3/10.0
- Livability +3.4/5.0
- Schools +3.0/10.0
- Rent growth +2.5/5.0
- Condition / age +2.5/5.0
$69,999
🖨 Deal sheet 📄 Offer letter ✓ Due diligence
Listing remarks MLS
Modest 3 bed/1 bath house with an attached garage located in the Borough of Clymer. Level lot, hardwood floors, and a full basement are some of the extras.
Key facts
- Shopping
- Everyday essentials
- 7,405 sq ft lot
Tags
Property features AI
Exterior
- Parking: Attached garage
- Utilities: Public water; Public sewer
- Home design: Two-story home; Resale property
- Construction: Asphalt roof
Interior
- Flooring: Carpet; Laminate
- Bathrooms: 1 full bathroom
- Heating & cooling: Gas heating; Wall/Window air conditioning units
- Interior features: Basement
Neighborhood map
What this means for you Summary
Snapshot
- This is a 3-bed/1.0-bath single-family listed at $70k.
Deal economics
- At list price, monthly cash flow is $408 ($5k/yr) — positive.
- The deal already cash-flows at list — no discount required.
- Meets the 1% rule at list price ($1k rent vs $70k).
Location & tenants
- Location reads 67/100 on livability (#966 in PA) — a middle-class / working-renter tenant base. Strengths: crime A+, cost of living A+, housing A+; Watch: schools D+, amenities F, commute F.
- Penns Manor Area SD (rural): math 24% / reading 47% proficiency, ranked #410 of 539 in PA (top 76%) — families likely to look elsewhere, expect single-tenant / working-renter base with shorter leases.
- Market conditions: 13 active listings in the ZIP; 44 units permitted in Indiana County in 2024 (0 in 5+ unit buildings).
Forward outlook
- In year one you build about $4k of equity ($484 loan paydown + $3k appreciation (4.7% local appreciation)).
- Indiana County population projected at -18% by 2050 — secular population decline; favor cash flow + early exit over multi-decade hold.
- At projected returns (4.7% appreciation + 3.0% rent growth), your $20k cash investment doubles in ~3 years — after that, you're playing with house money.
- By year 9, paydown + projected appreciation supports a ~$33k cash-out refi (75% LTV) — recoverable capital for the next deal without selling this one.
Negotiation context
- Only 13 days on market — expect competitive offers; lowballing is unlikely to land.
- 2 sale attempts since 10y ago with the ask held roughly flat each time — persistent listings suggest the price (not the market) is what's stuck; bring a comps-based counter.
Risks & watch-outs
- Watch-outs: property tax is 2.6% of price; built in 1923 — expect roof / HVAC / electrical / plumbing capex.
Questions for the listing agent
- Built in 1923 — when were the roof, HVAC, electrical panel, plumbing, and water heater last replaced?
- Property tax is high relative to price — has the assessment been appealed recently, and will the sale trigger a re-assessment?
- Is there a deadline driving the sale (1031 exchange, divorce, estate, relocation)? That informs how much negotiation room exists.
- Schools are D-rated, which usually means shorter tenancies and higher turnover. Who's the typical renter profile here, and what's been the actual vacancy rate?
- What's the average days-on-market for RENTAL listings here right now (not sales)? A rising rental-DOM trend means longer vacancies and softer asking-rent achievability than the comps imply.
- What's the recent tenant-quality profile in this submarket — average credit score on applications, eviction rate, late-payment / NSF rate, and stable-employment percentage? A property-management company in the area should have these aggregated.
- How much new for-sale + rental construction is in the pipeline within 1–3 miles? Heavy new supply typically softens prices + rents 12–24 months out; constrained supply supports both.
Investment metrics
- 1% rule
- 1.72% ✓
- Cap rate
- 13.29%
- Cash-on-cash
- 25.00%
- DSCR
- 2.11
- GRM
- 4.8
CMA / ARV
- ARV (median comp)
- $95,143
- List price
- $69,999
- Delta
- -26.43%
- Verdict
- UNDERPRICED
- Comps
- 20 within 1.0 mi
Show comp detail 10 sales within ~0.75 mi
| Address | Dist | Beds/Ba | Sqft | Sold | Price | $/sf | Match |
|---|---|---|---|---|---|---|---|
| 240 Morris St | 0.00mi | 3/1.0 | 1,296 (0%) | 0mo | $65,000 | $50 | 100 |
| 319 Morris St | 0.08mi | 3/1.0 | 1,330 (+3%) | 6mo | $130,000 | $98 | 87 |
| 115 Morris St | 0.12mi | 2/1.0 (-1) | 1,304 (+1%) | 20mo | $118,000 | $90 | 72 |
| 175 Walcott St | 0.17mi | 3/2.0 | 1,188 (-8%) | 5mo | $62,000 | $52 | 70 |
| 85 Dixon Rd | 0.55mi | 3/1.5 | 1,276 (-2%) | 3mo | $95,000 | $74 | 68 |
| 1045 Sage St | 0.69mi | 3/1.5 | 1,332 (+3%) | 14mo | $123,400 | $93 | 49 |
| 135 7th St | 0.42mi | 2/1.0 (-1) | 1,474 (+14%) | 8mo | $105,000 | $71 | 46 |
| 969 Dixon Rd | 0.62mi | 2/1.0 (-1) | 1,168 (-10%) | 6mo | $124,000 | $106 | 44 |
| 1081 Dixon Rd | 0.72mi | 3/1.5 | 1,188 (-8%) | 11mo | $119,900 | $101 | 41 |
| 925 Dixon Rd | 0.58mi | 4/2.0 (+1) | 1,456 (+12%) | 11mo | $78,000 | $54 | 34 |
Match score weights: distance 35% · size 25% · config 20% · recency 20%. Top-matched comps best support the ARV.
Projected returns pro-forma
4.69% appreciation · 3.0% rent growth · sell at horizon
- IRR
- 34.2%
- Equity multiple
- 3.09×
- Total profit
- $40,968
- Equity at exit
- $38,355
- IRR
- 32.9%
- Equity multiple
- 6.21×
- Total profit
- $102,081
- Equity at exit
- $65,135
Cash invested: $19,600 (down + closing). Projections, not guarantees.
Landlord ↔ Tenant lean methodology
- Overall (STATE)
- 62 Landlord-Friendly
- State Pennsylvania
- 62 Landlord-Friendly · EVEN
- County
- — inherits STATE
- City
- — inherits STATE
ZIP-level market 15728
- Home prices YoY
- 3.6%
- Active inventory
- 13
- Price-to-rent
- 4.8×
Monthly cashflow live
- Estimated rent
- $1,207 medium interval (Pro) →
- Mortgage (P&I)
- −$367
- Tax from tax record
- −$149 /mo · $1,787/yr
- Insurance
- −$29
- HOA
- −$0
- Vacancy / Maint / Mgmt
- −$253
- Net cashflow
- $408
Break-even live
UW: 25.0% down · 7.5% · 30yr · 1.5% tax · 5.0% vac · 8.0% maint · 8.0% mgmt
Financing live
Cash to close
- Down payment
- $17,500
- Closing costs
- $2,100
- Reserves months
- —
- Total cash needed
- —
Loan-product check · same deal, 3 products live
Conventional
25% down · 7.5% · 30yr
- Down + closing
- —
- Monthly P&I
- —
- Monthly cashflow
- —
- DSCR
- —
- Eligible?
- —
Personal DTI + credit; lowest rate.
DSCR
20% down · 8.5% · 30yr
- Down + closing
- —
- Monthly P&I
- —
- Monthly cashflow
- —
- DSCR
- —
- Eligible?
- —
No personal income docs; deal must DSCR.
Hard money
10% down · 12.0% · 12mo
- Down + closing
- —
- Monthly P&I
- —
- Monthly cashflow
- —
- DSCR
- —
- Eligible?
- —
Short-term bridge; refi at stabilization.
Listing history 10 events
-
2026-05-07status Pending 322-char remark
-
2026-05-07historical Contingent 322-char remark
-
2026-04-24$69,999 Active 322-char remark
-
2016-10-28soldstatus $37,000
-
2016-05-13price $26,510 155-char remark
Show marketing remark (155 chars)
Modest 3 bed/1 bath house with an attached garage located in the Borough of Clymer. Level lot, hardwood floors, and a full basement are some of the extras.
-
2016-05-04soldstatus $26,510 Sold 155-char remark
Show marketing remark (155 chars)
Modest 3 bed/1 bath house with an attached garage located in the Borough of Clymer. Level lot, hardwood floors, and a full basement are some of the extras.
-
2016-04-24status Under Contract 155-char remark
Show marketing remark (155 chars)
Modest 3 bed/1 bath house with an attached garage located in the Borough of Clymer. Level lot, hardwood floors, and a full basement are some of the extras.
-
2016-04-21price $26,999 155-char remark
Show marketing remark (155 chars)
Modest 3 bed/1 bath house with an attached garage located in the Borough of Clymer. Level lot, hardwood floors, and a full basement are some of the extras.
-
2016-04-13historical Contingent 155-char remark
Show marketing remark (155 chars)
Modest 3 bed/1 bath house with an attached garage located in the Borough of Clymer. Level lot, hardwood floors, and a full basement are some of the extras.
-
2016-03-01$26,999 Active 155-char remark
Show marketing remark (155 chars)
Modest 3 bed/1 bath house with an attached garage located in the Borough of Clymer. Level lot, hardwood floors, and a full basement are some of the extras.
ⓘ Source: listings_history table (triggers on properties + properties_extension) + one-shot
backfill from property_details.listing_events for pre-trigger history.
Tax reassessment forecast PA · Partial reset (capped growth)
- Current annual tax
- $1,787 · $149/mo
- Projected year-2 tax
- $1,787 · $149/mo
- Expected delta
- $0/yr ($0/mo · 0.0%)
ⓘ Screening estimate from a state-policy table — verify with the county assessor before closing.
Climate risk First Street
- Flood 4/10 Moderate FEMA zone X (unshaded) · 21% chance over 30 yrs
- Wildfire 1/10 Low
- Heat 4/10 Moderate 8 d/yr ≥94°F today · 19 d/yr by 30 yrs out
- Wind 2/10 Low
- Air quality 3/10 Moderate 2 unhealthy d/yr today · 4 by 30 yrs out
Nearby sold comps map
Loading sold comps map…
Walkable amenities ~0.75 mi
Loading nearby amenities…
Taxation est. · year 1
- Rental income
- $14,484
- − Mortgage interest
- −$3,921
- − Property taxes
- −$1,787
- − Insurance
- −$350
- − Repairs & maintenance
- −$1,159
- − Management
- −$1,159
- − Depreciation
- −$2,036
- Taxable income
- $4,073
- Est. tax owed @ 24.0%
- −$977
- After-tax cash flow
- $3,923/yr
For passive investors: Depreciation is non-cash, so a rental often shows a tax loss while cash-flowing — sheltering income. Rental losses are passive: they offset passive income freely, and up to $25,000/yr can offset ordinary (W-2) income if you actively participate and your MAGI is under $100k (phasing out to $0 by $150k); unused losses carry forward. On sale, claimed depreciation is recaptured at up to 25%, and gains may owe capital-gains tax (a 1031 exchange can defer both). Figures are a year-1 estimate at your 24.0% rate — not tax advice; consult a CPA.
Schools (NCES district)
- District
- Penns Manor Area SD
- NCES district ID
- 4218780
- Math proficiency
- 24% ▼ -16.00%
- Reading proficiency
- 47% ▼ -9.00%
- Median HH income
- $46,434
- Composite
- 30.33/100
- National rank
- #6271
- State rank
- #410 of 539 in PA
Livability — Clymer
- Score
- 67/100
- State rank
- #966
- US rank
- #10555
Category grades
Schools grade is shown separately in the Schools card above.
Census & demographics
- Census place
- Clymer, PA
- Population (ZIP)
- 3,468
Population outlook (Indiana County) Hauer SSP2
- Today (2025)
- 84,294 people
- By 2030
- 81,773 · -3.0%
- By 2040
- 75,213 · -10.8%
- By 2050
- 69,348 · -17.7%
- By 2075
- 57,951 · -31.3%
- By 2100
- 47,313 · -43.9%
Race, ethnicity, and origin ACS 2023
- Neighborhood character
- Predominantly White (96%)
- Race & ethnicity
- White 96% Two or more races 3%
- Common ancestry
- Polish 5% Romanian 3% Iranian 2%
- Foreign-born
- 1% · Canada
- Languages at home
- 96% English-only · German/W. Germanic 3% Spanish 1%
Political lean MEDSL · Indiana
- 2024 margin
- Solid R (+39.1) · D 30.1% · R 69.2%
- 2008→2024 swing
- -32.0pp toward R · 2008: -7.1pp · 2024: -39.1pp
- All cycles
- 2024: R+39.1 2020: R+37.5 2016: R+35.6 2012: R+18.8 2008: R+7.1
Not yet ingested
- Civics
- —
Market trends
- HPI YoY
- ▲ 4.69%
- Current HPI
- 133.5535
- Rent YoY
- —
- Metro
- —
- State GDP YoY
- ▲ 1.68%
- F500 in state
- 34
Industry mix (Fortune 500 HQ in PA)
| Industry | F500 HQs | Revenue |
|---|---|---|
| Healthcare | 2 | $309B |
|
||
| Insurance | 2 | $27B |
|
||
| Telecommunications / Media | 1 | $124B |
|
||
| Industrial Distribution | 1 | $22B |
|
||
| Financial Services | 1 | $20B |
|
||
| Chemicals / Materials | 1 | $18B |
|
||
Price history
+140.7% since first listed11 events — show timeline
- 2026-06-05 Sold (MLS) $65,000 West Penn MLS
- 2026-05-07 Pending — West Penn MLS
- 2026-05-07 Contingent — West Penn MLS
- 2026-04-24 Listed $69,999 West Penn MLS
- 2016-10-28 Sold (Public Records) $37,000 Public Records
- 2016-05-13 Price Changed $26,510 West Penn MLS
- 2016-05-04 Sold (MLS) $26,510 West Penn MLS
- 2016-04-24 Pending — West Penn MLS
- 2016-04-21 Price Changed $26,999 West Penn MLS
- 2016-04-13 Contingent — West Penn MLS
- 2016-03-01 Listed $26,999 West Penn MLS
Property tax history
+5.5%/yrLatest (2026): $1,787 · +3.4% YoY. Source: county tax records.
Cash-flow waterfall
monthlySold comps — $/sqft
last 12 mo · ≤1 miLoading sold comps…