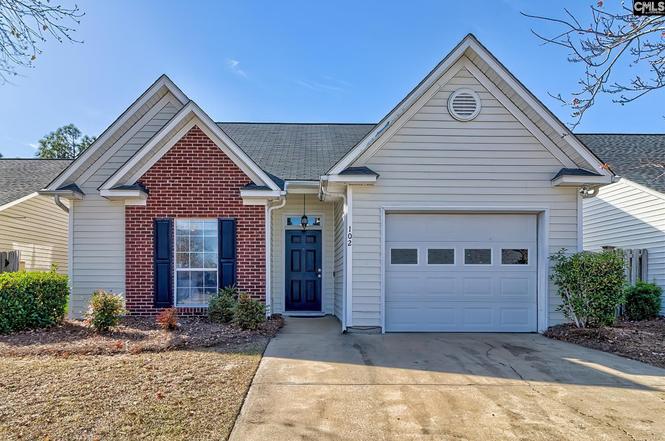
102 Autumn Run Cir · Columbia, SC
Flood risk 1/10 · Minimal
- FEMA flood zone
- X (unshaded)
- Chance of flooding over 30 yrs
- 0.0%
- Est. flood insurance / yr
- $507 – $1,088
Fire risk 3/10 · Minor
- Est. fire insurance / yr
- $783 – $1,453
Heat risk 7/10 · Major
- Hot days now (above 107°F)
- 7 days/yr
- Hot days in 30 yrs
- 16 days/yr
Wind risk 6/10 · Moderate
- Chance of severe wind over 30 yrs
- 62.0%
Air-quality risk 3/10 · Minor
- Unhealthy air days now
- 2 days/yr
- Unhealthy air days in 30 yrs
- 3 days/yr
Risk factors via First Street. Map © Google.
Why this score? — see what drove the D+ grade
The composite is a weighted blend of 9 inputs, each scored 0–100. Each bar is that input's sub-score; the figure is the points it added to the 100-point composite (weight × sub-score).
- ARV discount +15.0/15.0
- Cash flow +13.1/30.0
- DSCR +3.9/10.0
- Livability +3.9/5.0
- Schools +3.6/10.0
- Rent growth +3.2/5.0
- 1% rule +3.1/10.0
- Condition / age +2.5/5.0
- Appreciation +0.0/10.0
$222,500
🖨 Deal sheet (PDF) 📄 Offer letter ✓ Due diligence
Listing remarks
Summit Community Open House Sat May 9th 12-3pm. Welcome to 102 Autumn Run Circle, a home that makes everyday living feel simpler, lighter, and more comfortable. In a market where people want convenience without compromise, this 2-bedroom, 2-bath home delivers a smart blend of comfort, flexibility, and low-maintenance living in a convenient Columbia location. From the moment you step inside, the home feels inviting. The spacious great room creates a natural gathering space for organized mornings, planned evenings, and easy entertaining nights, while the cozy fireplace adds warmth and character. The eat-in kitchen keeps daily life practical and efficient, offering the kind of layout that supp
Key facts
- Master suite
- Walk-in closet
- Eat in kitchen
Tags
Property features AI
Finance
- HOA & community: Has homeowners association
Exterior
- Parking: Attached 1-car garage
- Utilities: Public sewer
- Home design: Two-story home
- Construction: Slab foundation
- Exterior features: Partial brick above foundation exterior; Vinyl siding; Paved road access; Public water
Interior
- Bedrooms: Master bedroom on the second floor; Additional bedroom on the main level
- Bathrooms: Two full bathrooms (including one main full bath)
- Interior features: One fireplace; Central heating and central cooling
Neighborhood map
What this means for you Summary
Snapshot
- This is a 2-bed/2.0-bath single-family listed at $222k.
Deal economics
- At list price, monthly cash flow is $-7 ($-81/yr) — negative.
- To cash-flow at today's rent, offer at most $221k (0.5% below list).
- To meet the 1% rule (rent ≥ 1% of price), the offer needs to be $180k (19.0% below list).
- Recommended offer: $180k (19.0% below list) — sets the bar for 1% rule.
- Cap rate 6.3% vs local median 5.1% in Columbia — meaningfully above typical; check what's discounted (condition, days-on-market, listing class) to confirm the premium yield is real.
Location & tenants
- Location reads 78/100 on livability (#18 in SC, #2,436 nationally) — a middle-class / working-renter tenant base. Strengths: amenities A+, commute A+, cost of living A+; Watch: employment D, crime F.
- Richland 02 (suburban): math 35% / reading 47% proficiency, ranked #29 of 80 in SC (top 36%) — families likely to look elsewhere, expect single-tenant / working-renter base with shorter leases.
- Zoned schools: Rice Creek Elementary (math 36% / reading 34%, grade F, #339 of 597 statewide, top 57%, 737 students, 76% FRL); Ridge View High (math 43% / reading 76%, grade C+, #110 of 196 statewide, top 58%, 1,711 students, 60% FRL) — zoned schools average 68% FRL vs 38% district-wide (30 pts higher); higher-poverty schools than district average — tighter screening recommended.
- Market conditions: Rents rising (+2.8%/yr); 417 active listings in the ZIP; 15 comparable units currently listed for rent nearby; rentals leasing fast (median 13d on market — plan ~1-2 weeks tenant-placement turnaround); 3,472 units permitted in Richland County in 2024 (1,096 in 5+ unit buildings).
Forward outlook
- Local home prices are declining (-3.0%/yr); year-one equity from $2k of loan paydown is wiped out by about $7k of value loss. Plan a longer hold.
- Richland County population projected at +30% by 2050 — long-run rental-demand tailwind backs the buy-and-hold thesis.
Negotiation context
- It's been on market 214 days — a 12% lower offer ($196k) is reasonable based on typical stale-listing flexibility.
- 3 sale attempts since 3y ago with the ask held roughly flat each time — persistent listings suggest the price (not the market) is what's stuck; bring a comps-based counter.
Risks & watch-outs
- Climate carrying-cost: major wind risk, 62% chance of damaging wind over 30y; extreme-heat days projected 7→16/yr by 2055 (HVAC capex compounding) — expect insurance premiums to compound above CPI over the hold.
Questions for the listing agent
- What do current leases actually rent for vs. the listed asking? Can we see a recent rent roll and the last 12 months of T-12 income?
- It's been on market 214 days. Have you received any prior offers? Is the seller open to a 19% concession, seller financing, or rate buy-down credit?
- Why hasn't it sold? Are there any deal-killer items the seller is aware of (foundation, flood, title, zoning, code violations)?
- Is there a deadline driving the sale (1031 exchange, divorce, estate, relocation)? That informs how much negotiation room exists.
- Schools are D-rated, which usually means shorter tenancies and higher turnover. Who's the typical renter profile here, and what's been the actual vacancy rate?
- Crime grade is F in this area — have there been break-ins, vandalism, or insurance claims at this property in the last 3 years? What carrier currently insures it and at what premium?
- The area grade is low — what's the realistic commute time and amenity access for the typical tenant pool here? Any planned neighborhood developments (good or bad) we should know about?
- What's the average days-on-market for RENTAL listings here right now (not sales)? A rising rental-DOM trend means longer vacancies and softer asking-rent achievability than the comps imply.
- What's the recent tenant-quality profile in this submarket — average credit score on applications, eviction rate, late-payment / NSF rate, and stable-employment percentage? A property-management company in the area should have these aggregated.
- How much new for-sale + rental construction is in the pipeline within 1–3 miles? Heavy new supply typically softens prices + rents 12–24 months out; constrained supply supports both.
Investment metrics
- 1% rule
- 0.81% ✗
- Cap rate
- 6.26%
- Cash-on-cash
- -0.13%
- DSCR
- 0.99
- GRM
- 10.3
CMA / ARV
- ARV (on-the-fly)
- $272,617
- Comps found
- 1
Show comp detail 1 sale within ~0.75 mi
| Address | Dist | Beds/Ba | Sqft | Sold | Price | $/sf | Match |
|---|---|---|---|---|---|---|---|
| 1007 May Oak Cir | 0.26mi | 3/2.0 (+1) | 1,342 (-12%) | 24mo | $240,000 | $179 | 43 |
Match score weights: distance 35% · size 25% · config 20% · recency 20%. Top-matched comps best support the ARV.
Projected returns pro-forma
-3.0% appreciation · 2.81% rent growth · sell at horizon
- IRR
- -16.7%
- Equity multiple
- 0.41×
- Total profit
- $-36,865
- Equity at exit
- $33,175
- IRR
- -8.9%
- Equity multiple
- 0.45×
- Total profit
- $-34,214
- Equity at exit
- $19,238
Cash invested: $62,300 (down + closing). Projections, not guarantees.
Landlord ↔ Tenant lean methodology
- Overall (STATE)
- 90 Strongly Landlord-Friendly
- State South Carolina
- 90 Strongly Landlord-Friendly · R+6
- County
- — inherits STATE
- City
- — inherits STATE
ZIP-level market 29229
- Home prices YoY
- -21.5%
- Rents YoY
- 2.8%
- Active inventory
- 417
- Price-to-rent
- 10.3×
Monthly cashflow live
- Estimated rent
- $1,803 high interval (Pro) →
- Mortgage (P&I)
- −$1,167
- Tax from tax record
- −$172 /mo · $2,060/yr
- Insurance
- −$93
- HOA
- −$0
- Vacancy / Maint / Mgmt
- −$379
- Net cashflow
- $-7
Break-even live
Sensitivity live
| Price | -10% $119 | -5% $56 | +0% $-7 | +5% $-70 | +10% $-133 |
|---|---|---|---|---|---|
| Rent | -10% $-149 | -5% $-78 | +0% $-7 | +5% $65 | +10% $136 |
| Rate | -1.0pp $105 | -0.5pp $50 | base $-7 | +0.5pp $-64 | +1.0pp $-123 |
UW: 25.0% down · 7.5% · 30yr · 1.5% tax · 5.0% vac · 8.0% maint · 8.0% mgmt
Financing live
Cash to close
- Down payment
- $55,625
- Closing costs
- $6,675
- Reserves months
- —
- Total cash needed
- —
Loan-product check · same deal, 3 products live
Conventional
25% down · 7.5% · 30yr
- Down + closing
- —
- Monthly P&I
- —
- Monthly cashflow
- —
- DSCR
- —
- Eligible?
- —
Personal DTI + credit; lowest rate.
DSCR
20% down · 8.5% · 30yr
- Down + closing
- —
- Monthly P&I
- —
- Monthly cashflow
- —
- DSCR
- —
- Eligible?
- —
No personal income docs; deal must DSCR.
Hard money
10% down · 12.0% · 12mo
- Down + closing
- —
- Monthly P&I
- —
- Monthly cashflow
- —
- DSCR
- —
- Eligible?
- —
Short-term bridge; refi at stabilization.
Rent comps 15 comps
| Address | Beds | Baths | Sqft | Rent | $/sqft | DOM | Units | Dist |
|---|---|---|---|---|---|---|---|---|
| 3 Long Glen Ct Columbia, SC | 3.0 | 2.0 | 1314 | $1,849 | $1.41 | 4d | 1 | 0.14mi |
| 3 Glen Knoll Ct Columbia, SC | 3.0 | 2.0 | 1320 | $1,699 | $1.29 | 13d | 1 | 0.61mi |
| 225 Lawson Dr Columbia, SC | 2.0 | 2.0 | 1288 | $1,580 | $1.23 | 25d | 1 | 0.64mi |
| 1214 Waverly Place Ln Columbia, SC | 3.0 | 2.0 | 1152 | $1,800 | $1.56 | 13d | 1 | 0.69mi |
| 1116 Waverly Place Ln Columbia, SC | 3.0 | 2.0 | 1428 | $1,875 | $1.31 | 16d | 1 | 0.76mi |
| 500 Castle Ridge Dr Columbia, SC | 3.0 | 2.0 | 1753 | $2,150 | $1.23 | 5d | 1 | 0.86mi |
| 416 Sandfarm Trl Blythewood, SC | 3.0 | 2.5 | 1664 | $2,025 | $1.22 | 16d | 1 | 0.87mi |
| 416 Sandfarm Trl Blythewood, SC | 3.0 | 2.5 | 1664 | $2,025 | $1.22 | 25d | 1 | 0.87mi |
| 214 Elders Pond Dr Columbia, SC | 3.0 | 2.5 | 1400 | $1,350 | $0.96 | 13d | 1 | 0.89mi |
| 5 Elders Pond Ct Columbia, SC | 3.0 | 2.5 | 1640 | $1,795 | $1.09 | 16d | 1 | 0.97mi |
| 423 Elders Pond Cir Columbia, SC | 2.0 | 2.0 | 1125 | $1,475 | $1.31 | 21d | 1 | 1.08mi |
| 4500 Hard Scrabble Rd Columbia, SC | 1.0–3.0 | 1.0–2.0 | 1031 | $1,348 | $1.31 | 4d | 4 | 1.25mi |
| 20 Helton Dr Columbia, SC | 1.0–3.0 | 1.0–2.0 | 1167 | $1,584 | $1.36 | 4d | 38 | 1.26mi |
| 223 Sunny Hill DR Blythewood, SC | 3.0 | 3.5 | 1892 | $2,495 | $1.32 | 4d | 1 | 1.41mi |
| 5324 Hard Scrabble Rd Blythewood, SC | 1.0–2.0 | 1.0–2.0 | 992 | $1,915 | $1.93 | 4d | 59 | 1.41mi |
Listing history 29 events
-
2026-06-22days on market $222,500 Active 214 DOM
-
2026-06-18days on market $222,500 Active 211 DOM
-
2026-06-17days on market $222,500 Active 210 DOM
-
2026-06-16days on market $222,500 Active 209 DOM
-
2026-06-15days on market $222,500 Active 208 DOM
-
2026-06-14days on market $222,500 Active 206 DOM
-
2026-06-13days on market $222,500 Active 205 DOM
-
2026-06-10days on market $222,500 Active 203 DOM
-
2026-06-09days on market $222,500 Active 202 DOM
-
2026-06-08days on market $222,500 Active 201 DOM
-
2026-06-07days on market $222,500 Active 200 DOM
-
2026-06-05days on market $222,500 Active 197 DOM
-
2026-06-03days on market $222,500 Active 196 DOM
-
2026-06-03days on market $222,500 Active 195 DOM
-
2026-06-01days on market $222,500 Active 194 DOM
-
2026-05-31days on market $222,500 Active 193 DOM
-
2026-04-24price $222,500
-
2026-01-22price $227,000
-
2026-01-21price $230,000
-
2026-01-21price $227,000
-
2025-11-19$230,000 Active
-
2023-10-17soldstatus $201,700
-
2023-09-19status Pending
-
2023-09-05historical Active - Contingent
-
2023-08-24price $224,000
-
2023-08-15$227,000 Active
-
2023-07-28$225,000 Active
-
2015-03-13soldstatus $105,000
-
2012-11-13soldstatus $105,000
ⓘ Source: listings_history table (triggers on properties + properties_extension) + one-shot
backfill from property_details.listing_events for pre-trigger history.
Tax reassessment forecast SC · Resets to sale price
- Current annual tax
- $2,060 · $172/mo
- Projected year-2 tax
- $2,060 · $172/mo
- Expected delta
- $0/yr ($0/mo · 0.0%)
ⓘ Screening estimate from a state-policy table — verify with the county assessor before closing.
Climate risk First Street
- Flood 1/10 Low FEMA zone X (unshaded) · 0% chance over 30 yrs
- Wildfire 3/10 Moderate
- Heat 7/10 Severe 7 d/yr ≥107°F today · 16 d/yr by 30 yrs out
- Wind 6/10 Major 62% chance of damaging wind over 30 yrs
- Air quality 3/10 Moderate 2 unhealthy d/yr today · 3 by 30 yrs out
Nearby sold comps map
Loading sold comps map…
Walkable amenities ~0.75 mi
Loading nearby amenities…
Taxation est. · year 1
- Rental income
- $21,638
- − Mortgage interest
- −$12,463
- − Property taxes
- −$2,060
- − Insurance
- −$1,112
- − Repairs & maintenance
- −$1,731
- − Management
- −$1,731
- − Depreciation
- −$6,473
- Taxable loss
- −$3,933
- Est. tax savings @ 24.0%
- +$944
- After-tax cash flow
- $863/yr
For passive investors: Depreciation is non-cash, so a rental often shows a tax loss while cash-flowing — sheltering income. Rental losses are passive: they offset passive income freely, and up to $25,000/yr can offset ordinary (W-2) income if you actively participate and your MAGI is under $100k (phasing out to $0 by $150k); unused losses carry forward. On sale, claimed depreciation is recaptured at up to 25%, and gains may owe capital-gains tax (a 1031 exchange can defer both). Figures are a year-1 estimate at your 24.0% rate — not tax advice; consult a CPA.
Schools (NCES district)
- District
- Richland 02
- NCES district ID
- 4503390
- Math proficiency
- 35% ▼ -15.00%
- Reading proficiency
- 47% ▼ -5.00%
- Median HH income
- $59,684
- Composite
- 36.2/100
- National rank
- #4730
- State rank
- #29 of 80 in SC
Livability — Columbia
- Score
- 78/100
- State rank
- #18
- US rank
- #2436
Category grades
Schools grade is shown separately in the Schools card above.
Census & demographics
- County
- Richland County · 389,530 people
- City population
- 335,994
- Metro
- Columbia, SC
- Population (ZIP)
- 51,861
- Household income
- $74,043
- Rent vs Own
- Severe rent burden
- 1939.0
Population outlook (Richland County) Hauer SSP2
- Today (2025)
- 459,667 people
- By 2030
- 487,524 · +6.1%
- By 2040
- 542,035 · +17.9%
- By 2050
- 595,371 · +29.5%
- By 2075
- 732,998 · +59.5%
- By 2100
- 820,415 · +78.5%
Race, ethnicity, and origin ACS 2023
- Neighborhood character
- Diverse neighborhood (Simpson 0.56)
- Race & ethnicity
- Black 62% White 24% Hispanic / Latino 8% Two or more races 6% Asian 3%
- Hispanic origin (detail)
- Mexican 2% Puerto Rican 2%
- Common ancestry
- Slovak 1% Lithuanian 1% Romanian 1%
- Foreign-born
- 7% · Canada, South Korea, Jamaica
- Languages at home
- 89% English-only · Spanish 6% Other Indo-European 1% Korean 1%
Political lean MEDSL · Richland
- 2024 margin
- Solid D (+34.6) · D 66.4% · R 31.8% · Other 1.8%
- 2008→2024 swing
- +5.7pp toward D · 2008: 28.9pp · 2024: 34.6pp
- All cycles
- 2024: D+34.6 2020: D+38.3 2016: D+32.9 2012: D+33.3 2008: D+28.9
Not yet ingested
- Civics
- —
Market trends
- HPI YoY
- ▼ -51.11%
- Current HPI
- 186.782
- Rent YoY
- ▲ 2.81%
- Metro
- Columbia, SC
- State GDP YoY
- ▲ 4.51%
- F500 in state
- 2
Industry mix (Fortune 500 HQ in SC)
| Industry | F500 HQs | Revenue |
|---|---|---|
| Packaging | 1 | $7B |
|
||
Price history
+111.9% since first listed13 events — show timeline
- 2026-04-24 Price Changed $222,500 Consolidated MLS
- 2026-01-22 Price Changed $227,000 Consolidated MLS
- 2026-01-21 Price Changed $230,000 Consolidated MLS
- 2026-01-21 Price Changed $227,000 Consolidated MLS
- 2025-11-19 Listed $230,000 Consolidated MLS
- 2023-10-17 Sold (Public Records) $201,700 Public Records
- 2023-09-19 Pending — Consolidated MLS
- 2023-09-05 Contingent — Consolidated MLS
- 2023-08-24 Price Changed $224,000 Consolidated MLS
- 2023-08-15 Listed $227,000 Consolidated MLS
- 2023-07-28 Listed $225,000 Consolidated MLS
- 2015-03-13 Sold (Public Records) $105,000 Public Records
- 2012-11-13 Sold (Public Records) $105,000 Public Records
Property tax history
+5.7%/yrLatest (2025): $2,060 · -69.3% YoY. Source: county tax records.
Cash-flow waterfall
monthlySold comps — $/sqft
last 12 mo · ≤1 miLoading sold comps…