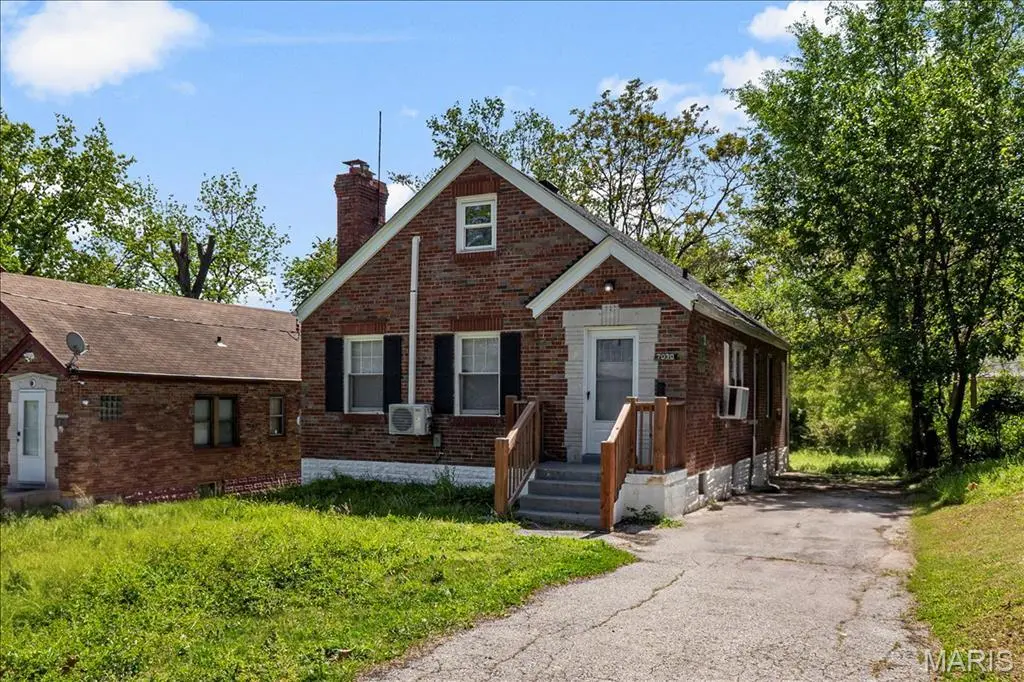
7030 Lena Ave · Jennings, MO
Flood risk 1/10 · Minimal
- FEMA flood zone
- X (unshaded)
- Chance of flooding over 30 yrs
- 0.0%
- Est. flood insurance / yr
- $473 – $860
Fire risk 1/10 · Minimal
- Est. fire insurance / yr
- $1,054 – $1,958
Heat risk 5/10 · Moderate
- Hot days now (above 107°F)
- 7 days/yr
- Hot days in 30 yrs
- 21 days/yr
Wind risk 2/10 · Minimal
- Chance of severe wind over 30 yrs
- 1.0%
Air-quality risk 4/10 · Minor
- Unhealthy air days now
- 4 days/yr
- Unhealthy air days in 30 yrs
- 5 days/yr
Risk factors via First Street. Map © Google.
Why this score? — see what drove the C+ grade
The composite is a weighted blend of 9 inputs, each scored 0–100. Each bar is that input's sub-score; the figure is the points it added to the 100-point composite (weight × sub-score).
- Cash flow +24.4/30.0
- DSCR +7.9/10.0
- ARV discount +7.5/15.0
- Appreciation +6.9/10.0
- 1% rule +5.7/10.0
- Rent growth +3.7/5.0
- Livability +3.4/5.0
- Condition / age +2.5/5.0
- Schools +1.1/10.0
$125,000
🖨 Deal sheet 📄 Offer letter ✓ Due diligence
Listing remarks MLS
WOW! Check out this gorgeous, updated brick home with great curb appeal! Living room with beautifull flooring that continues throughout the dining room and kitchen. Nice sized bedrooms, updated kitchen with stylilsh cabinets, neutral colors and so much more! Don't wait! Home sold as-is.
Key facts
- 6,098 sq ft lot
- Built 1941
- Listed 51 days
Property features AI
Exterior
- Utilities: Public water; Public sewer; Electric: Other
- Home design: Single-family residence; One and one-half levels; Residential property
- Construction: Brick construction
- Exterior features: Lot features: Other; 0.14-acre lot
Interior
- Bedrooms: 4 bedrooms total; 2 bedrooms on the main level; 2 bedrooms on the upper level
- Bathrooms: 1 full bathroom
- Heating & cooling: Forced air heating; Wall unit(s) for cooling
- Interior features: Fireplace (1); Full, unfinished basement
Neighborhood map
What this means for you Summary
Snapshot
- This is a 4-bed/1.0-bath single-family listed at $125k.
Deal economics
- At list price, monthly cash flow is $253 ($3k/yr) — positive.
- The deal already cash-flows at list — no discount required.
- Meets the 1% rule at list price ($1k rent vs $125k).
- Recommended offer: $121k (3.0% below list) — sets the bar for market timing.
- Cap rate 8.7% vs local median 12.2% in Jennings — below-typical yield; the buyer is paying a premium for something (appreciation thesis, condition, location) that the cap rate doesn't capture.
Location & tenants
- Location reads 67/100 on livability (#208 in MO) — a middle-class / working-renter tenant base. Strengths: cost of living A+, commute A-, housing A-; Watch: crime F, amenities F, employment F.
- Jennings (suburban): math 8% / reading 20% proficiency, ranked #315 of 324 in MO (top 97%) — low school quality limits family demand, transient renter base, plan for 1-2y turnover; 86% free/reduced lunch — lower-income household profile, screen leases tightly.
- Zoned schools: Fairview Primary (math 34% / reading 34%, grade F, #676 of 1,115 statewide, top 66%, 267 students, 100% FRL); Jennings High (math 8% / reading 17%, grade F, #497 of 521 statewide, top 96%, 691 students, 100% FRL).
- Market conditions: Rents rising fast (+5.0%/yr); 372 active listings in the ZIP; 28 comparable units currently listed for rent nearby; rentals at typical pace (median 24d on market — plan ~3-4 weeks tenant-placement turnaround); 43% of comp listings sitting > 30 days — soft ceiling on asking rent; lower-income renter base — watch delinquency; 920 units permitted in St. Louis County in 2024 (250 in 5+ unit buildings).
Forward outlook
- In year one you build about $6k of equity ($864 loan paydown + $5k appreciation (3.8% local appreciation)).
- At projected returns (3.8% appreciation + 5.0% rent growth), your $35k cash investment doubles in ~4 years — after that, you're playing with house money.
- By year 7, paydown + projected appreciation supports a ~$36k cash-out refi (75% LTV) — recoverable capital for the next deal without selling this one.
Negotiation context
- It's been on market 51 days — a 3% lower offer ($121k) is reasonable based on typical stale-listing flexibility.
- 10 sale attempts since 4y ago with the ask held roughly flat each time — persistent listings suggest the price (not the market) is what's stuck; bring a comps-based counter.
- Current owner paid $75k; list at $125k implies a 67% gain — meaningful room to come down on a strong offer.
Risks & watch-outs
- Watch-outs: built in 1941 — expect roof / HVAC / electrical / plumbing capex.
- Climate carrying-cost: extreme-heat days projected 7→21/yr by 2055 (HVAC capex compounding) — expect insurance premiums to compound above CPI over the hold.
Questions for the listing agent
- It's been on market 51 days. Have you received any prior offers? Is the seller open to a 3% concession, seller financing, or rate buy-down credit?
- Built in 1941 — when were the roof, HVAC, electrical panel, plumbing, and water heater last replaced?
- Is there a deadline driving the sale (1031 exchange, divorce, estate, relocation)? That informs how much negotiation room exists.
- Schools are D-rated, which usually means shorter tenancies and higher turnover. Who's the typical renter profile here, and what's been the actual vacancy rate?
- Crime grade is F in this area — have there been break-ins, vandalism, or insurance claims at this property in the last 3 years? What carrier currently insures it and at what premium?
- What's the average days-on-market for RENTAL listings here right now (not sales)? A rising rental-DOM trend means longer vacancies and softer asking-rent achievability than the comps imply.
- What's the recent tenant-quality profile in this submarket — average credit score on applications, eviction rate, late-payment / NSF rate, and stable-employment percentage? A property-management company in the area should have these aggregated.
- How much new for-sale + rental construction is in the pipeline within 1–3 miles? Heavy new supply typically softens prices + rents 12–24 months out; constrained supply supports both.
Investment metrics
- 1% rule
- 1.07% ✓
- Cap rate
- 8.72%
- Cash-on-cash
- 8.69%
- DSCR
- 1.39
- GRM
- 7.8
CMA / ARV
- ARV (median comp)
- $63,563
- List price
- $125,000
- Delta
- 96.66%
- Verdict
- OVERPRICED
- Comps
- 20 within 1.0 mi
Show comp detail 12 sales within ~0.75 mi
| Address | Dist | Beds/Ba | Sqft | Sold | Price | $/sf | Match |
|---|---|---|---|---|---|---|---|
| 5657 Janet Ave | 0.21mi | 4/2.0 | 1,200 (-3%) | 3mo | $60,000 | $50 | 79 |
| 7056 Idlewild Ave | 0.30mi | 3/1.0 (-1) | 1,234 (-0%) | 4mo | $59,900 | $49 | 77 |
| 7137 Garesche Ave | 0.34mi | 3/1.0 (-1) | 1,251 (+1%) | 7mo | $110,000 | $88 | 71 |
| 5637 Jennings Station Rd | 0.14mi | 3/1.0 (-1) | 1,116 (-10%) | 2mo | $30,000 | $27 | 71 |
| 7138 Garesche Ave | 0.37mi | 3/1.0 (-1) | 1,220 (-2%) | 6mo | $99,750 | $82 | 70 |
| 7212 Eunice Ave | 0.32mi | 4/1.0 | 1,134 (-8%) | 2mo | $64,900 | $57 | 69 |
| 5468 Janet Ave | 0.22mi | 3/2.0 (-1) | 1,188 (-4%) | 5mo | $79,000 | $66 | 69 |
| 2327 Switzer Ave | 0.70mi | 4/1.0 | 1,201 (-3%) | 7mo | $45,000 | $37 | 56 |
| 7126 Theodore Ave | 0.50mi | 3/1.0 (-1) | 1,123 (-9%) | 2mo | $34,900 | $31 | 54 |
| 2508 Main St | 0.66mi | 3/1.0 (-1) | 1,298 (+5%) | 8mo | $60,000 | $46 | 50 |
| 7410 Greenport Dr | 0.55mi | 3/1.0 (-1) | 1,081 (-13%) | 7mo | $121,500 | $112 | 42 |
| 7441 Calvin Ave | 0.71mi | 3/1.0 (-1) | 1,068 (-14%) | 3mo | $99,500 | $93 | 36 |
Match score weights: distance 35% · size 25% · config 20% · recency 20%. Top-matched comps best support the ARV.
Projected returns pro-forma
3.79% appreciation · 4.97% rent growth · sell at horizon
- IRR
- 18.6%
- Equity multiple
- 2.12×
- Total profit
- $39,189
- Equity at exit
- $61,849
- IRR
- 20.3%
- Equity multiple
- 4.28×
- Total profit
- $114,837
- Equity at exit
- $99,958
Cash invested: $35,000 (down + closing). Projections, not guarantees.
Landlord ↔ Tenant lean methodology
- Overall (STATE)
- 81 Strongly Landlord-Friendly
- State Missouri
- 81 Strongly Landlord-Friendly · R+10
- County
- — inherits STATE
- City
- — inherits STATE
ZIP-level market 63136
- Home prices YoY
- 0.9%
- Rents YoY
- 5.0%
- Active inventory
- 372
- Price-to-rent
- 7.8×
Monthly cashflow live
- Estimated rent
- $1,340 high interval (Pro) →
- Mortgage (P&I)
- −$656
- Tax from tax record
- −$98 /mo · $1,172/yr
- Insurance
- −$52
- HOA
- −$0
- Vacancy / Maint / Mgmt
- −$281
- Net cashflow
- $253
Break-even live
UW: 25.0% down · 7.5% · 30yr · 1.5% tax · 5.0% vac · 8.0% maint · 8.0% mgmt
Financing live
Cash to close
- Down payment
- $31,250
- Closing costs
- $3,750
- Reserves months
- —
- Total cash needed
- —
Loan-product check · same deal, 3 products live
Conventional
25% down · 7.5% · 30yr
- Down + closing
- —
- Monthly P&I
- —
- Monthly cashflow
- —
- DSCR
- —
- Eligible?
- —
Personal DTI + credit; lowest rate.
DSCR
20% down · 8.5% · 30yr
- Down + closing
- —
- Monthly P&I
- —
- Monthly cashflow
- —
- DSCR
- —
- Eligible?
- —
No personal income docs; deal must DSCR.
Hard money
10% down · 12.0% · 12mo
- Down + closing
- —
- Monthly P&I
- —
- Monthly cashflow
- —
- DSCR
- —
- Eligible?
- —
Short-term bridge; refi at stabilization.
Rent comps 28 comps
| Address | Beds | Baths | Sqft | Rent | $/sqft | DOM | Units | Dist |
|---|---|---|---|---|---|---|---|---|
| 5637 Jennings Station Rd Saint Louis, MO | 3.0 | 1.0 | 1116 | $895 | $0.80 | 43d | 1 | 0.13mi |
| 7120 Greenhaven Dr Saint Louis, MO | 3.0 | 2.0 | 1131 | $1,050 | $0.93 | 23d | 1 | 0.21mi |
| 5612 Hodiamont Ave Saint Louis, MO | 3.0 | 1.5 | 1200 | $1,150 | $0.96 | 10d | 1 | 0.27mi |
| 7121 Garesche Ave Saint Louis, MO | 3.0 | 1.0 | 1156 | $1,200 | $1.04 | 43d | 1 | 0.32mi |
| 5515 Wilborn Dr Saint Louis, MO | 3.0 | 1.0 | 1248 | $1,400 | $1.12 | 43d | 1 | 0.36mi |
| 5347 Janet Ave Saint Louis, MO | 4.0 | 1.0 | 893 | $1,350 | $1.51 | 16d | 1 | 0.37mi |
| 7315 Albright Ave Saint Louis, MO | 3.0 | 1.0 | 888 | $1,150 | $1.30 | 43d | 1 | 0.42mi |
| 7205 Calvin Ave Saint Louis, MO | 3.0 | 1.0 | 832 | $750 | $0.90 | 43d | 1 | 0.45mi |
| 5361 Wilborn Dr Saint Louis, MO | 3.0 | 1.0 | 900 | $1,420 | $1.58 | 17d | 1 | 0.51mi |
| 5225 Fletcher St Saint Louis, MO | 3.0 | 2.0 | 918 | $1,295 | $1.41 | 23d | 1 | 0.59mi |
| 8527 Dianthus Ln Saint Louis, MO | 3.0 | 1.0 | 976 | $1,295 | $1.33 | 43d | 1 | 0.64mi |
| 5574 Era Ave Saint Louis, MO | 3.0 | 1.0 | 850 | $1,400 | $1.65 | 12d | 1 | 0.64mi |
| 5932 Floy Ave Saint Louis, MO | 3.0 | 1.0 | 1080 | $1,373 | $1.27 | 20d | 1 | 0.71mi |
| 7441 Calvin Ave Saint Louis, MO | 3.0 | 1.0 | 1068 | $1,350 | $1.26 | 12d | 1 | 0.74mi |
| 2022 McLaran Ave Saint Louis, MO | 3.0 | 2.0 | 1181 | $1,593 | $1.35 | 14d | 1 | 0.76mi |
| 2427 Switzer Ave Saint Louis, MO | 3.0 | 1.0 | 1008 | $1,300 | $1.29 | 43d | 1 | 0.78mi |
| 6024 Lucille Ave Saint Louis, MO | 5.0 | 1.0 | 1152 | $1,500 | $1.30 | 14d | 1 | 0.81mi |
| 2546 Main St Saint Louis, MO | 4.0 | 1.0 | 984 | $1,269 | $1.29 | 43d | 1 | 0.81mi |
| 2527 Switzer Ave Saint Louis, MO | 3.0 | 1.0 | 888 | $1,135 | $1.28 | 16d | 1 | 0.81mi |
| 2415 Shirley Ave Saint Louis, MO | 3.0 | 1.0 | 990 | $1,450 | $1.46 | 23d | 1 | 0.82mi |
| 5730 Park Ln Saint Louis, MO | 4.0 | 1.0 | 1174 | $1,600 | $1.36 | 20d | 1 | 0.87mi |
| 5936 Theodore Ave Saint Louis, MO | 3.0 | 2.0 | 1008 | $1,350 | $1.34 | 43d | 1 | 0.90mi |
| 2623 Avie Dr Saint Louis, MO | 3.0 | 2.0 | 921 | $1,350 | $1.47 | 43d | 1 | 0.91mi |
| 8548 Drury Ln Saint Louis, MO | 3.0 | 2.0 | 1107 | $1,420 | $1.28 | 43d | 1 | 1.10mi |
| 7 Lamar Dr Saint Louis, MO | 3.0 | 1.0 | 894 | $1,200 | $1.34 | 17d | 1 | 1.19mi |
| 2056 Coleridge Dr Saint Louis, MO | 3.0 | 1.0 | 949 | $1,195 | $1.26 | 23d | 1 | 1.31mi |
| 4914 Plover Ave Saint Louis, MO | 3.0 | 2.0 | 1248 | $925 | $0.74 | 23d | 1 | 1.33mi |
| 4737 Plover Ave Saint Louis, MO | 4.0 | 1.5 | 1200 | $1,400 | $1.17 | 43d | 1 | 1.34mi |
Listing history 43 events
-
2026-06-18days on market $125,000 Active 51 DOM
-
2026-06-17days on market $125,000 Active 50 DOM
-
2026-06-16days on market $125,000 Active 49 DOM
-
2026-06-15days on market $125,000 Active 48 DOM
-
2026-06-13days on market $125,000 Active 46 DOM
-
2026-06-09days on market $125,000 Active 42 DOM
-
2026-06-08days on market $125,000 Active 41 DOM
-
2026-06-07days on market $125,000 Active 40 DOM
-
2026-06-03days on market $125,000 Active 36 DOM
-
2026-06-02days on market $125,000 Active 35 DOM
-
2026-06-01days on market $125,000 Active 34 DOM
-
2026-05-31days on market $125,000 Active 33 DOM
-
2026-04-28$125,000 Active 313-char remark
-
2025-08-27$135,000 Active
-
2024-05-09soldstatus Closed
Show marketing remark (287 chars)
WOW! Check out this gorgeous, updated brick home with great curb appeal! Living room with beautifull flooring that continues throughout the dining room and kitchen. Nice sized bedrooms, updated kitchen with stylilsh cabinets, neutral colors and so much more! Don't wait! Home sold as-is.
-
2024-04-18status Pending
Show marketing remark (287 chars)
WOW! Check out this gorgeous, updated brick home with great curb appeal! Living room with beautifull flooring that continues throughout the dining room and kitchen. Nice sized bedrooms, updated kitchen with stylilsh cabinets, neutral colors and so much more! Don't wait! Home sold as-is.
-
2024-03-13status Active
Show marketing remark (287 chars)
WOW! Check out this gorgeous, updated brick home with great curb appeal! Living room with beautifull flooring that continues throughout the dining room and kitchen. Nice sized bedrooms, updated kitchen with stylilsh cabinets, neutral colors and so much more! Don't wait! Home sold as-is.
-
2024-03-13price $94,900
Show marketing remark (287 chars)
WOW! Check out this gorgeous, updated brick home with great curb appeal! Living room with beautifull flooring that continues throughout the dining room and kitchen. Nice sized bedrooms, updated kitchen with stylilsh cabinets, neutral colors and so much more! Don't wait! Home sold as-is.
-
2024-03-13historical
Show marketing remark (287 chars)
WOW! Check out this gorgeous, updated brick home with great curb appeal! Living room with beautifull flooring that continues throughout the dining room and kitchen. Nice sized bedrooms, updated kitchen with stylilsh cabinets, neutral colors and so much more! Don't wait! Home sold as-is.
-
2024-01-25status Active
Show marketing remark (287 chars)
WOW! Check out this gorgeous, updated brick home with great curb appeal! Living room with beautifull flooring that continues throughout the dining room and kitchen. Nice sized bedrooms, updated kitchen with stylilsh cabinets, neutral colors and so much more! Don't wait! Home sold as-is.
-
2024-01-05status Pending
Show marketing remark (287 chars)
WOW! Check out this gorgeous, updated brick home with great curb appeal! Living room with beautifull flooring that continues throughout the dining room and kitchen. Nice sized bedrooms, updated kitchen with stylilsh cabinets, neutral colors and so much more! Don't wait! Home sold as-is.
-
2023-12-12$99,900 Active
Show marketing remark (287 chars)
WOW! Check out this gorgeous, updated brick home with great curb appeal! Living room with beautifull flooring that continues throughout the dining room and kitchen. Nice sized bedrooms, updated kitchen with stylilsh cabinets, neutral colors and so much more! Don't wait! Home sold as-is.
-
2023-11-01historical
-
2023-09-20price $109,900
-
2023-08-09status Active
-
2023-08-07historical
-
2023-07-06price $119,900
-
2023-06-22status Active
-
2023-06-10historical
-
2023-04-25status Active
-
2023-04-25price $129,900
-
2023-04-25historical
-
2023-02-24status Active
-
2023-02-16historical
-
2022-11-16$144,900 Active
-
2022-10-26price $144,900
-
2019-06-09price $27,900
-
2015-12-07price $14,600
-
2015-11-06price $16,600
-
2005-01-20soldstatus $75,000
-
1996-08-15soldstatus $45,000
-
1996-08-15soldstatus $45,000
-
1993-05-07soldstatus
ⓘ Source: listings_history table (triggers on properties + properties_extension) + one-shot
backfill from property_details.listing_events for pre-trigger history.
Tax reassessment forecast MO · Resets to sale price
- Current annual tax
- $1,172 · $98/mo
- Projected year-2 tax
- $1,212 · $101/mo
- Expected delta
- +$41/yr (+$3/mo · 3.5%)
ⓘ Screening estimate from a state-policy table — verify with the county assessor before closing.
Climate risk First Street
- Flood 1/10 Low FEMA zone X (unshaded) · 0% chance over 30 yrs
- Wildfire 1/10 Low
- Heat 5/10 Major 7 d/yr ≥107°F today · 21 d/yr by 30 yrs out
- Wind 2/10 Low 100% chance of damaging wind over 30 yrs
- Air quality 4/10 Moderate 4 unhealthy d/yr today · 5 by 30 yrs out
Nearby sold comps map
Loading sold comps map…
Walkable amenities ~0.75 mi
Loading nearby amenities…
Taxation est. · year 1
- Rental income
- $16,079
- − Mortgage interest
- −$7,002
- − Property taxes
- −$1,172
- − Insurance
- −$625
- − Repairs & maintenance
- −$1,286
- − Management
- −$1,286
- − Depreciation
- −$3,636
- Taxable income
- $1,072
- Est. tax owed @ 24.0%
- −$257
- After-tax cash flow
- $2,783/yr
For passive investors: Depreciation is non-cash, so a rental often shows a tax loss while cash-flowing — sheltering income. Rental losses are passive: they offset passive income freely, and up to $25,000/yr can offset ordinary (W-2) income if you actively participate and your MAGI is under $100k (phasing out to $0 by $150k); unused losses carry forward. On sale, claimed depreciation is recaptured at up to 25%, and gains may owe capital-gains tax (a 1031 exchange can defer both). Figures are a year-1 estimate at your 24.0% rate — not tax advice; consult a CPA.
Schools (NCES district)
- District
- Jennings
- NCES district ID
- 2916290
- Math proficiency
- 8% ▼ -16.00%
- Reading proficiency
- 20% ▼ -4.00%
- Median HH income
- $30,595
- Composite
- 11.04/100
- National rank
- #9739
- State rank
- #315 of 324 in MO
Livability — Jennings
- Score
- 67/100
- State rank
- #208
- US rank
- #10499
Category grades
Schools grade is shown separately in the Schools card above.
Census & demographics
- Census place
- Jennings, MO
- County
- Saint Louis County · 888,823 people
- Metro
- St. Louis, MO-IL
- Population (ZIP)
- 40,929
- Household income
- $41,154
- Rent vs Own
- Severe rent burden
- 3085.0
Population outlook (St. Louis County) Hauer SSP2
- Today (2025)
- 1,025,227 people
- By 2030
- 1,028,023 · +0.3%
- By 2040
- 1,020,940 · -0.4%
- By 2050
- 1,007,280 · -1.8%
- By 2075
- 987,277 · -3.7%
- By 2100
- 921,984 · -10.1%
Race, ethnicity, and origin ACS 2023
- Neighborhood character
- Predominantly Black (90%)
- Race & ethnicity
- Black 90% White 5% Two or more races 3%
- Foreign-born
- 1% · Canada
Political lean MEDSL · St. Louis
- 2024 margin
- Strong D (+23.4) · D 60.8% · R 37.4% · Other 1.7%
- 2008→2024 swing
- +3.5pp toward D · 2008: 19.9pp · 2024: 23.4pp
- All cycles
- 2024: D+23.4 2020: D+24.0 2016: D+16.2 2012: D+13.7 2008: D+19.9
Not yet ingested
- Civics
- —
Market trends
- HPI YoY
- ▲ 3.79%
- Current HPI
- 420.28
- Rent YoY
- ▲ 4.97%
- Metro
- St. Louis, MO-IL
- State GDP YoY
- ▲ 1.84%
- F500 in state
- 20
Industry mix (Fortune 500 HQ in MO)
| Industry | F500 HQs | Revenue |
|---|---|---|
| Healthcare | 1 | $163B |
|
||
| Insurance | 1 | $21B |
|
||
| Industrial Technology | 1 | $17B |
|
||
| Retail | 1 | $16B |
|
||
| Industrial Distribution | 1 | $10B |
|
||
| Utilities | 1 | $9B |
|
||
Price history
+177.8% since first listed31 events — show timeline
- 2026-04-28 Listed $125,000 MARIS as Distributed by MLS Grid
- 2025-08-27 Listed $135,000 MARIS as Distributed by MLS Grid
- 2024-05-09 Sold (MLS) — MARIS as Distributed by MLS Grid
- 2024-04-18 Pending — MARIS as Distributed by MLS Grid
- 2024-03-13 Relisted — MARIS as Distributed by MLS Grid
- 2024-03-13 Price Changed $94,900 MARIS as Distributed by MLS Grid
- 2024-03-13 Delisted — MARIS as Distributed by MLS Grid
- 2024-01-25 Relisted — MARIS as Distributed by MLS Grid
- 2024-01-05 Pending — MARIS as Distributed by MLS Grid
- 2023-12-12 Listed $99,900 MARIS as Distributed by MLS Grid
- 2023-11-01 Delisted — MARIS as Distributed by MLS Grid
- 2023-09-20 Price Changed $109,900 MARIS as Distributed by MLS Grid
- 2023-08-09 Relisted — MARIS as Distributed by MLS Grid
- 2023-08-07 Delisted — MARIS as Distributed by MLS Grid
- 2023-07-06 Price Changed $119,900 MARIS as Distributed by MLS Grid
- 2023-06-22 Relisted — MARIS as Distributed by MLS Grid
- 2023-06-10 Delisted — MARIS as Distributed by MLS Grid
- 2023-04-25 Relisted — MARIS as Distributed by MLS Grid
- 2023-04-25 Price Changed $129,900 MARIS as Distributed by MLS Grid
- 2023-04-25 Delisted — MARIS as Distributed by MLS Grid
- 2023-02-24 Relisted — MARIS as Distributed by MLS Grid
- 2023-02-16 Delisted — MARIS as Distributed by MLS Grid
- 2022-11-16 Listed $144,900 MARIS as Distributed by MLS Grid
- 2022-10-26 Price Changed $144,900 MARIS as Distributed by MLS Grid
- 2019-06-09 Price Changed $27,900 MARIS as Distributed by MLS Grid
- 2015-12-07 Price Changed $14,600 MARIS as Distributed by MLS Grid
- 2015-11-06 Price Changed $16,600 MARIS as Distributed by MLS Grid
- 2005-01-20 Sold (Public Records) $75,000 Public Records
- 1996-08-15 Sold (Public Records) $45,000 Public Records
- 1996-08-15 Sold (Public Records) $45,000 Public Records
- 1993-05-07 Sold (Public Records) — Public Records
Property tax history
+1.2%/yrLatest (2022): $1,172 · +1.5% YoY. Source: county tax records.
Cash-flow waterfall
monthlySold comps — $/sqft
last 12 mo · ≤1 miLoading sold comps…