107 Coffey St · Wartrace, TN
Flood risk 7/10 · Major
- FEMA flood zone
- X (unshaded)
- Chance of flooding over 30 yrs
- 0.77%
- Est. flood insurance / yr
- $507 – $1,088
Fire risk 3/10 · Minor
- Est. fire insurance / yr
- $949 – $1,763
Heat risk 5/10 · Moderate
- Hot days now (above 105°F)
- 7 days/yr
- Hot days in 30 yrs
- 20 days/yr
Wind risk 4/10 · Minor
- Chance of severe wind over 30 yrs
- 11.0%
Air-quality risk 2/10 · Minimal
- Unhealthy air days now
- 1 days/yr
- Unhealthy air days in 30 yrs
- 3 days/yr
Risk factors via First Street. Map © Google.
Why this score? — see what drove the B- grade
The composite is a weighted blend of 9 inputs, each scored 0–100. Each bar is that input's sub-score; the figure is the points it added to the 100-point composite (weight × sub-score).
- Cash flow +29.5/30.0
- DSCR +10.0/10.0
- 1% rule +8.3/10.0
- ARV discount +7.5/15.0
- Livability +3.0/5.0
- Rent growth +2.5/5.0
- Condition / age +2.2/5.0
- Schools +2.0/10.0
- Appreciation +0.0/10.0
$99,900
🖨 Deal sheet 📄 Offer letter ✓ Due diligence
Listing remarks
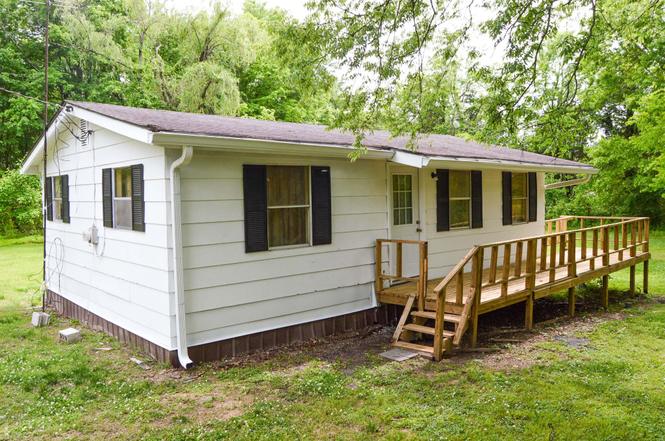
Home to sell at ONLINE ONLY AUCTION. Bid now until May 28th at 1pm (soft close). GREAT INVESTMENT OPPORTUNITY! Great opportunity to purchase a good home and lot that has been used as a rental property for the past 27 years. Currently vacant, the home features 2 bedrooms, living room, kitchen, full bath and utility room. The interior does need some renovation to bring it new life, but the exterior has been freshly painted and new gutters installed. The house is not on a continuous foundation, is on piers, as many homes were in that era. Also, several foundation jacks have been recently installed. Central heat and air, city water and sewer. Situated on a . 61± acre lot. (A small porti
Key facts
- 0.6 acre lot
- Built 1969
Property features AI
Finance
- Financial info: Annual property tax reported
Exterior
- Utilities: Public water; Public sewer; Electricity available
- Home design: Single-family residence; One story
- Construction: Frame construction; Pillar/post/pier foundation; Built (existing)
- Exterior features: Crawl space foundation; Lot approximately 0.61 acres (survey)
Interior
- Kitchen: Electric oven; Refrigerator
- Bedrooms: 2 bedrooms (both on the main level)
- Flooring: Carpet; Vinyl
- Bathrooms: 1 full bathroom
- Heating & cooling: Central heating (electric); Central air conditioning (electric)
- Interior features: Electric oven; Refrigerator
Neighborhood map
What this means for you Summary
Snapshot
- This is a 2-bed/1.0-bath single-family listed at $100k. Condition is rated fair.
Deal economics
- At list price, monthly cash flow is $291 ($3k/yr) — positive.
- The deal already cash-flows at list — no discount required.
- Meets the 1% rule at list price ($1k rent vs $100k).
Location & tenants
- Location reads 60/100 on livability (#276 in TN) — a middle-class / working-renter tenant base. Strengths: cost of living A+, housing A+; Watch: health & safety C-, crime F, amenities F.
- Bedford County (rural): math 24% / reading 23% proficiency, ranked #97 of 139 in TN (top 70%) — low school quality limits family demand, transient renter base, plan for 1-2y turnover.
- Zoned schools: Cascade Elementary (math 60% / reading 44%, grade C-, #107 of 952 statewide, top 12%, 675 students, 0% FRL); Cascade High School (math 2% / reading 37%, grade F, #183 of 332 statewide, top 59%, 545 students, 0% FRL) — zoned schools average 0% FRL vs 56% district-wide (56 pts lower); this property's tenant base skews higher-income than the district average.
- Zoned-school proficiency averages 36% at this address vs 24% district-wide (+12 pts) — the actual schools serving this property are materially stronger than the Bedford County average implies; a family-tenant draw the district grade alone would hide.
- Market conditions: 45 active listings in the ZIP; 630 units permitted in Bedford County in 2024 (6 in 5+ unit buildings).
Forward outlook
- Local home prices are declining (-3.0%/yr); year-one equity from $691 of loan paydown is wiped out by about $3k of value loss. Plan a longer hold.
- Bedford County population projected at +16% by 2050 — long-run rental-demand tailwind backs the buy-and-hold thesis.
- At projected returns (-3.0% appreciation + 3.0% rent growth), your $28k cash investment doubles in ~10 years — after that, you're playing with house money.
Negotiation context
- Only 1 days on market — expect competitive offers; lowballing is unlikely to land.
Risks & watch-outs
- Watch-outs: flood insurance adds $66/mo.
- Climate carrying-cost: major flood risk; extreme-heat days projected 7→20/yr by 2055 (HVAC capex compounding) — expect insurance premiums to compound above CPI over the hold.
Questions for the listing agent
- Have any recent inspections been done? Can we get a copy of the seller's disclosures and any deferred-maintenance estimates?
- Built in 1969 — when were the roof, HVAC, electrical panel, plumbing, and water heater last replaced?
- What's the actual annual flood-insurance premium (NFIP or private), and is the property in a SFHA with mandatory coverage?
- Is there a deadline driving the sale (1031 exchange, divorce, estate, relocation)? That informs how much negotiation room exists.
- Schools are F-rated, which usually means shorter tenancies and higher turnover. Who's the typical renter profile here, and what's been the actual vacancy rate?
- Crime grade is F in this area — have there been break-ins, vandalism, or insurance claims at this property in the last 3 years? What carrier currently insures it and at what premium?
- What's the average days-on-market for RENTAL listings here right now (not sales)? A rising rental-DOM trend means longer vacancies and softer asking-rent achievability than the comps imply.
- What's the recent tenant-quality profile in this submarket — average credit score on applications, eviction rate, late-payment / NSF rate, and stable-employment percentage? A property-management company in the area should have these aggregated.
- How much new for-sale + rental construction is in the pipeline within 1–3 miles? Heavy new supply typically softens prices + rents 12–24 months out; constrained supply supports both.
Investment metrics
- 1% rule
- 1.33% ✓
- Cap rate
- 10.58%
- Cash-on-cash
- 15.32%
- DSCR
- 1.68
- GRM
- 6.3
CMA / ARV
No comps found within radius.
Projected returns pro-forma
-3.0% appreciation · 3.0% rent growth · sell at horizon
- IRR
- 2.2%
- Equity multiple
- 1.09×
- Total profit
- $2,379
- Equity at exit
- $14,895
- IRR
- 11.8%
- Equity multiple
- 1.93×
- Total profit
- $26,148
- Equity at exit
- $8,638
Cash invested: $27,972 (down + closing). Projections, not guarantees.
Landlord ↔ Tenant lean methodology
- Overall (STATE)
- 87 Strongly Landlord-Friendly
- State Tennessee
- 87 Strongly Landlord-Friendly · R+13
- County
- — inherits STATE
- City
- — inherits STATE
ZIP-level market 37183
- Home prices YoY
- -10.5%
- Active inventory
- 45
- Price-to-rent
- 6.3×
Monthly cashflow live
- Estimated rent
- $1,326 medium interval (Pro) →
- Mortgage (P&I)
- −$524
- Tax est. 1.5%
- −$125 /mo · $1,498/yr
- Insurance
- −$42
- Flood insurance flood zone
- −$66 /mo · $798/yr
- HOA
- −$0
- Vacancy / Maint / Mgmt
- −$278
- Net cashflow
- $291
Break-even live
UW: 25.0% down · 7.5% · 30yr · 1.5% tax · 5.0% vac · 8.0% maint · 8.0% mgmt
Financing live
Cash to close
- Down payment
- $24,975
- Closing costs
- $2,997
- Reserves months
- —
- Total cash needed
- —
Loan-product check · same deal, 3 products live
Conventional
25% down · 7.5% · 30yr
- Down + closing
- —
- Monthly P&I
- —
- Monthly cashflow
- —
- DSCR
- —
- Eligible?
- —
Personal DTI + credit; lowest rate.
DSCR
20% down · 8.5% · 30yr
- Down + closing
- —
- Monthly P&I
- —
- Monthly cashflow
- —
- DSCR
- —
- Eligible?
- —
No personal income docs; deal must DSCR.
Hard money
10% down · 12.0% · 12mo
- Down + closing
- —
- Monthly P&I
- —
- Monthly cashflow
- —
- DSCR
- —
- Eligible?
- —
Short-term bridge; refi at stabilization.
Listing history 2 events
-
2026-06-18pricestatusdays on market $99,900 Active 1 DOM
-
2026-05-20Active
ⓘ Source: listings_history table (triggers on properties + properties_extension) + one-shot
backfill from property_details.listing_events for pre-trigger history.
Climate risk First Street
- Flood 7/10 Severe FEMA zone X (unshaded) · 77% chance over 30 yrs
- Wildfire 3/10 Moderate
- Heat 5/10 Major 7 d/yr ≥105°F today · 20 d/yr by 30 yrs out
- Wind 4/10 Moderate 11% chance of damaging wind over 30 yrs
- Air quality 2/10 Low 1 unhealthy d/yr today · 3 by 30 yrs out
Nearby sold comps map
Loading sold comps map…
Walkable amenities ~0.75 mi
Loading nearby amenities…
Taxation est. · year 1
- Rental income
- $15,910
- − Mortgage interest
- −$5,596
- − Property taxes
- −$1,498
- − Insurance
- −$1,297
- − Repairs & maintenance
- −$1,273
- − Management
- −$1,273
- − Depreciation
- −$2,906
- Taxable income
- $2,067
- Est. tax owed @ 24.0%
- −$496
- After-tax cash flow
- $2,991/yr
For passive investors: Depreciation is non-cash, so a rental often shows a tax loss while cash-flowing — sheltering income. Rental losses are passive: they offset passive income freely, and up to $25,000/yr can offset ordinary (W-2) income if you actively participate and your MAGI is under $100k (phasing out to $0 by $150k); unused losses carry forward. On sale, claimed depreciation is recaptured at up to 25%, and gains may owe capital-gains tax (a 1031 exchange can defer both). Figures are a year-1 estimate at your 24.0% rate — not tax advice; consult a CPA.
Condition & rehab AI · 13 photos
The home requires moderate renovations to improve its condition and increase its value. The interior walls and flooring are in poor condition, and the exterior siding shows signs of wear. Repainting and repairing the exterior will significantly enhance the home's appeal.
Repairs flagged
- Moderate exterior siding — The exterior siding shows signs of wear and discoloration.
- Major interior walls — The interior walls and paint are in poor condition, with peeling paint and discoloration.
- Major flooring — The flooring is carpeted and in poor condition, with visible wear and tear.
Value-add opportunities
- Both paint interior walls and flooring — Refreshing the interior walls and flooring will improve the home's appearance and appeal to potential buyers or renters.
- Both repair and replace exterior siding — Updating the exterior siding will improve the home's curb appeal and increase its value.
Renovation cost estimate screening
| Repair item | Severity | Est. cost |
|---|---|---|
| exterior siding · The exterior siding shows signs of wear and discoloration. | Moderate | $3,000–15,000 |
| interior walls · The interior walls and paint are in poor condition, with peeling paint and discoloration. | Major | $15,000–50,000 |
| flooring · The flooring is carpeted and in poor condition, with visible wear and tear. | Major | $15,000–50,000 |
| Total estimated repair cost · 3 items | $33,000–115,000 |
Value-add ROI direction
- Both paint interior walls and flooring — Refreshing the interior walls and flooring will improve the home's appearance and appeal to potential buyers or renters. ↑
- Both repair and replace exterior siding — Updating the exterior siding will improve the home's curb appeal and increase its value. ↑
ⓘ Cost ranges are severity-bucket heuristics (US national rule-of-thumb). Get contractor quotes + a written scope before underwriting a rehab budget.
Schools (NCES district)
- District
- Bedford County
- NCES district ID
- 4700180
- Math proficiency
- 24% ▼ -4.00%
- Reading proficiency
- 23% ▼ -3.00%
- Median HH income
- $41,704
- Composite
- 20.03/100
- National rank
- #8658
- State rank
- #97 of 139 in TN
Livability — Wartrace
- Score
- 60/100
- State rank
- #276
- US rank
- #19389
Category grades
Schools grade is shown separately in the Schools card above.
Census & demographics
- Census place
- Wartrace, TN
- Population (ZIP)
- 3,211
Population outlook (Bedford County) Hauer SSP2
- Today (2025)
- 51,064 people
- By 2030
- 52,954 · +3.7%
- By 2040
- 56,534 · +10.7%
- By 2050
- 59,482 · +16.5%
- By 2075
- 65,597 · +28.5%
- By 2100
- 68,030 · +33.2%
Race, ethnicity, and origin ACS 2023
- Neighborhood character
- Predominantly White (92%)
- Race & ethnicity
- White 92% Black 3% Two or more races 3% Hispanic / Latino 2%
- Common ancestry
- Lithuanian 2% Serbian 2% Italian 1%
- Foreign-born
- 2% · Canada
Political lean MEDSL · Bedford
- 2024 margin
- Solid R (+58.0) · D 20.5% · R 78.5%
- 2008→2024 swing
- -24.5pp toward R · 2008: -33.5pp · 2024: -58.0pp
- All cycles
- 2024: R+58.0 2020: R+51.9 2016: R+52.8 2012: R+40.3 2008: R+33.5
Not yet ingested
- Civics
- —
Market trends
- HPI YoY
- ▼ -32.77%
- Current HPI
- 280.1833
- Rent YoY
- —
- Metro
- —
- State GDP YoY
- ▲ 2.78%
- F500 in state
- 22
Industry mix (Fortune 500 HQ in TN)
| Industry | F500 HQs | Revenue |
|---|---|---|
| Healthcare | 3 | $91B |
|
||
| Retail | 3 | $72B |
|
||
| Transportation / Logistics | 1 | $88B |
|
||
| Paper / Packaging | 1 | $19B |
|
||
| Insurance | 1 | $13B |
|
||
| Energy | 1 | $12B |
|
||
Cash-flow waterfall
monthlySold comps — $/sqft
last 12 mo · ≤1 miLoading sold comps…