318 Fountain View Blvd · North Fort Myers, FL
Flood risk 1/10 · Minimal
- FEMA flood zone
- X (unshaded)
- Chance of flooding over 30 yrs
- 0.0%
- Est. flood insurance / yr
- $507 – $1,088
Fire risk 4/10 · Minor
- Est. fire insurance / yr
- $947 – $1,759
Heat risk 10/10 · Severe
- Hot days now (above 107°F)
- 7 days/yr
- Hot days in 30 yrs
- 29 days/yr
Wind risk 10/10 · Severe
- Chance of severe wind over 30 yrs
- 99.0%
Air-quality risk 2/10 · Minimal
- Unhealthy air days now
- 1 days/yr
- Unhealthy air days in 30 yrs
- 1 days/yr
Risk factors via First Street. Map © Google.
Why this score? — see what drove the C+ grade
The composite is a weighted blend of 9 inputs, each scored 0–100. Each bar is that input's sub-score; the figure is the points it added to the 100-point composite (weight × sub-score).
- Cash flow +29.8/30.0
- 1% rule +10.0/10.0
- DSCR +10.0/10.0
- Schools +4.1/10.0
- Livability +3.7/5.0
- Condition / age +2.5/5.0
- Rent growth +2.0/5.0
- ARV discount +0.6/15.0
- Appreciation +0.0/10.0
$72,700
🖨 Deal sheet (PDF) 📄 Offer letter ✓ Due diligence
Listing remarks
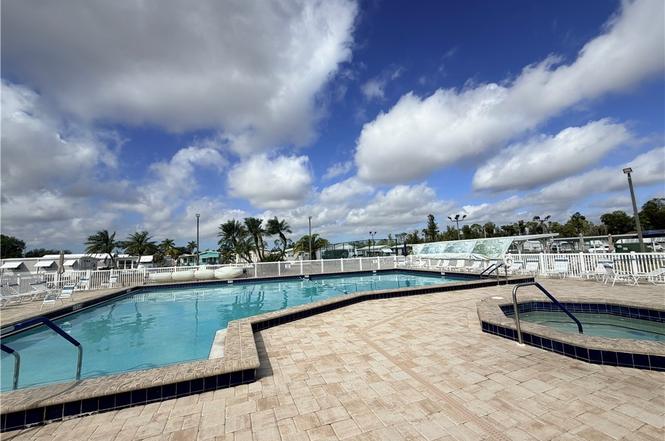
WELCOME TO 318 FOUNTAIN VIEW BLVD, where you OWN THE LAND in the highly desirable FOUNTAIN VIEW 55+ COMMUNITY and the property is NOT IN A FLOOD ZONE. Located in North Fort Myers, this WELL-MAINTAINED, TURNKEY HOME is filled with natural light and offers peaceful PRESERVE VIEWS that provide privacy and a tranquil Florida setting. Enjoy low-maintenance living with a LOW HOA OF APPROXIMATELY $230 PER MONTH, which includes water, sewer, trash collection, irrigation water, pest control, street lighting, road maintenance, professional management, reserve funding, and maintenance of all common areas. Residents also enjoy full access to the community clubhouse, heated pool and spa, sauna, pickleba
Key facts
- Clubhouse
- Pickleball courts
- Tennis courts
Tags
Property features AI
Finance
- Financial info: Pets allowed with conditions (call for details)
- HOA & community: Homeowners association with a $198 monthly fee; Association covers irrigation water, pest control, reserve fund, road maintenance, sewer, street lights, security, trash, and water; Community amenities include clubhouse, fitness center, pickleball, park, pool, shuffleboard court, sauna, sidewalks, and management; Non-gated senior community with 318 units
Exterior
- Parking: Parking information not provided
- Security: Smoke detectors
- Utilities: Cable available; Public water (assessment paid); Public sewer (assessment paid)
- Home design: Single-story; Resale property; Faces northwest; RV-3 zoning
- Construction: Block and concrete construction with vinyl siding; Metal roof; Built with a foundation (details not provided)
- Exterior features: Fenced yard; Automatic sprinklers; Shutters (manual); Community pool; Southeast exposure; Has a view
Interior
- Kitchen: Dishwasher; Electric cooktop; Self-cleaning oven; Range; Microwave; Garbage disposal; Icemaker; Refrigerator; Breakfast bar/area
- Bedrooms: Bedroom on main level; Florida room; Great room; Media room; Office
- Flooring: Carpet; Vinyl
- Bathrooms: 1 full bathroom
- Heating & cooling: Central heating (electric); Central air (electric)
- Interior features: Breakfast bar; Breakfast area; Family/Dining room; Living/Dining room; Bar; Home office; Split bedrooms; Tub/shower; Furnished; Single-hung windows
- Laundry & utility: Washer and dryer inside; Dryer
Neighborhood map
What this means for you Summary
Snapshot
- This is a 1-bed/1.0-bath manufactured listed at $73k.
Deal economics
- At list price, monthly cash flow is $268 ($3k/yr) — positive.
- The deal already cash-flows at list — no discount required.
- Meets the 1% rule at list price ($1k rent vs $73k).
- Recommended offer: $64k (12.0% below list) — sets the bar for market timing.
- Cap rate 10.7% vs local median 3.6% in North Fort Myers — top-decile yield for the area; either an underpriced asset or a hidden risk that comps aren't pricing in. Stress-test before assuming the spread holds.
Location & tenants
- Location reads 74/100 on livability (#269 in FL, #4,409 nationally) — a middle-class / working-renter tenant base. Strengths: cost of living A+, housing A+, health & safety A+; Watch: employment C-, amenities F, commute F.
- Lee (suburban): math 47% / reading 50% proficiency, ranked #42 of 73 in FL (top 58%) — families likely to look elsewhere, expect single-tenant / working-renter base with shorter leases.
- Market conditions: Rents soft (-1.9%/yr); 472 active listings in the ZIP; 15,411 units permitted in Lee County in 2024 (4,686 in 5+ unit buildings).
Forward outlook
- Local home prices are declining (-3.0%/yr); year-one equity from $503 of loan paydown is wiped out by about $2k of value loss. Plan a longer hold.
- Lee County population projected at +44% by 2050 — long-run rental-demand tailwind backs the buy-and-hold thesis.
Negotiation context
- It's been on market 147 days — a 12% lower offer ($64k) is reasonable based on typical stale-listing flexibility.
- 4 sale attempts since 8y ago; this cycle's ask has dropped $12k (14%) from the opening price — seller is motivated, your offer sets the floor, not the list.
- Current owner paid $52k; 40% above their basis — modest negotiation headroom, anchor on the comps not their cost.
Risks & watch-outs
- Climate carrying-cost: severe wind risk, 99% chance of damaging wind over 30y; extreme-heat days projected 7→29/yr by 2055 (HVAC capex compounding) — expect insurance premiums to compound above CPI over the hold.
Questions for the listing agent
- It's been on market 147 days. Have you received any prior offers? Is the seller open to a 12% concession, seller financing, or rate buy-down credit?
- What does the HOA fee cover, when was the last increase, and are there any pending special assessments or reserve-fund shortfalls?
- Why hasn't it sold? Are there any deal-killer items the seller is aware of (foundation, flood, title, zoning, code violations)?
- Is there a deadline driving the sale (1031 exchange, divorce, estate, relocation)? That informs how much negotiation room exists.
- What's the average days-on-market for RENTAL listings here right now (not sales)? A rising rental-DOM trend means longer vacancies and softer asking-rent achievability than the comps imply.
- What's the recent tenant-quality profile in this submarket — average credit score on applications, eviction rate, late-payment / NSF rate, and stable-employment percentage? A property-management company in the area should have these aggregated.
- How much new for-sale + rental construction is in the pipeline within 1–3 miles? Heavy new supply typically softens prices + rents 12–24 months out; constrained supply supports both.
Investment metrics
- 1% rule
- 1.69% ✓
- Cap rate
- 10.71%
- Cash-on-cash
- 15.77%
- DSCR
- 1.70
- GRM
- 4.9
CMA / ARV
- ARV (on-the-fly)
- $63,000
- Comps found
- 2
Show comp detail 2 sales within ~0.75 mi
| Address | Dist | Beds/Ba | Sqft | Sold | Price | $/sf | Match |
|---|---|---|---|---|---|---|---|
| 169 Vista Mar Dr | 0.05mi | 1/1.0 | 386 (-8%) | 6mo | $30,000 | $78 | 79 |
| 10 Fountain View Blvd | 0.17mi | 1/1.5 | 442 (+5%) | 22mo | $66,500 | $150 | 63 |
Match score weights: distance 35% · size 25% · config 20% · recency 20%. Top-matched comps best support the ARV.
Projected returns pro-forma
-3.0% appreciation · 0.0% rent growth · sell at horizon
- IRR
- 2.4%
- Equity multiple
- 1.09×
- Total profit
- $1,796
- Equity at exit
- $10,840
- IRR
- 7.9%
- Equity multiple
- 1.50×
- Total profit
- $10,145
- Equity at exit
- $6,286
Cash invested: $20,356 (down + closing). Projections, not guarantees.
Landlord ↔ Tenant lean methodology
- Overall (STATE)
- 87 Strongly Landlord-Friendly
- State Florida
- 87 Strongly Landlord-Friendly · R+3
- County
- — inherits STATE
- City
- — inherits STATE
ZIP-level market 33903
- Rents YoY
- -1.9%
- Active inventory
- 472
- Price-to-rent
- 4.9×
Monthly cashflow live
- Estimated rent
- $1,231 medium interval (Pro) →
- Mortgage (P&I)
- −$381
- Tax from tax record
- −$96 /mo · $1,147/yr
- Insurance
- −$30
- HOA
- −$198
- Vacancy / Maint / Mgmt
- −$259
- Net cashflow
- $268
Break-even live
Sensitivity live
| Price | -10% $309 | -5% $288 | +0% $268 | +5% $247 | +10% $226 |
|---|---|---|---|---|---|
| Rent | -10% $170 | -5% $219 | +0% $268 | +5% $316 | +10% $365 |
| Rate | -1.0pp $304 | -0.5pp $286 | base $268 | +0.5pp $249 | +1.0pp $230 |
UW: 25.0% down · 7.5% · 30yr · 1.5% tax · 5.0% vac · 8.0% maint · 8.0% mgmt
Financing live
Cash to close
- Down payment
- $18,175
- Closing costs
- $2,181
- Reserves months
- —
- Total cash needed
- —
Loan-product check · same deal, 3 products live
Conventional
25% down · 7.5% · 30yr
- Down + closing
- —
- Monthly P&I
- —
- Monthly cashflow
- —
- DSCR
- —
- Eligible?
- —
Personal DTI + credit; lowest rate.
DSCR
20% down · 8.5% · 30yr
- Down + closing
- —
- Monthly P&I
- —
- Monthly cashflow
- —
- DSCR
- —
- Eligible?
- —
No personal income docs; deal must DSCR.
Hard money
10% down · 12.0% · 12mo
- Down + closing
- —
- Monthly P&I
- —
- Monthly cashflow
- —
- DSCR
- —
- Eligible?
- —
Short-term bridge; refi at stabilization.
HOA detail
- Monthly dues
- $198 · $2,376/yr
- Likely covers
- watersewertrashpool
Listing history 24 events
-
2026-06-17days on market $72,700 Active 147 DOM
-
2026-06-16days on market $72,700 Active 146 DOM
-
2026-06-15days on market $72,700 Active 145 DOM
-
2026-06-13days on market $72,700 Active 143 DOM
-
2026-06-10days on market $72,700 Active 140 DOM
-
2026-06-09days on market $72,700 Active 139 DOM
-
2026-06-07days on market $72,700 Active 137 DOM
-
2026-06-02days on market $72,700 Active 132 DOM
-
2026-06-01days on market $72,700 Active 131 DOM
-
2026-06-01days on market $72,700 Active 130 DOM
-
2026-02-05price $72,700
-
2026-01-20$85,000 Active
-
2019-03-11soldstatus $52,000
-
2019-01-28historical
-
2018-12-27price $59,900
-
2018-10-30$60,900 Active
-
2018-09-30historical
-
2018-09-26status Active
-
2018-08-23status Pending
-
2018-06-30price $60,900
-
2018-06-02$62,000 Active
-
2018-05-16soldstatus $42,000
-
1991-08-05soldstatus $37,500
-
1989-02-01soldstatus $22,600
ⓘ Source: listings_history table (triggers on properties + properties_extension) + one-shot
backfill from property_details.listing_events for pre-trigger history.
Tax reassessment forecast FL · Resets to sale price
- Current annual tax
- $1,147 · $96/mo
- Projected year-2 tax
- $1,147 · $96/mo
- Expected delta
- $0/yr ($0/mo · 0.0%)
ⓘ Screening estimate from a state-policy table — verify with the county assessor before closing.
Climate risk First Street
- Flood 1/10 Low FEMA zone X (unshaded) · 0% chance over 30 yrs
- Wildfire 4/10 Moderate
- Heat 10/10 Extreme 7 d/yr ≥107°F today · 29 d/yr by 30 yrs out
- Wind 10/10 Extreme 99% chance of damaging wind over 30 yrs
- Air quality 2/10 Low 1 unhealthy d/yr today · 1 by 30 yrs out
Nearby sold comps map
Loading sold comps map…
Walkable amenities ~0.75 mi
Loading nearby amenities…
Taxation est. · year 1
- Rental income
- $14,775
- − Mortgage interest
- −$4,072
- − Property taxes
- −$1,147
- − Insurance
- −$364
- − Repairs & maintenance
- −$1,182
- − Management
- −$1,182
- − HOA
- −$2,376
- − Depreciation
- −$2,115
- Taxable income
- $2,337
- Est. tax owed @ 24.0%
- −$561
- After-tax cash flow
- $2,650/yr
For passive investors: Depreciation is non-cash, so a rental often shows a tax loss while cash-flowing — sheltering income. Rental losses are passive: they offset passive income freely, and up to $25,000/yr can offset ordinary (W-2) income if you actively participate and your MAGI is under $100k (phasing out to $0 by $150k); unused losses carry forward. On sale, claimed depreciation is recaptured at up to 25%, and gains may owe capital-gains tax (a 1031 exchange can defer both). Figures are a year-1 estimate at your 24.0% rate — not tax advice; consult a CPA.
Schools (NCES district)
- District
- Lee
- NCES district ID
- 1201080
- Math proficiency
- 47% ▼ -11.00%
- Reading proficiency
- 50% ▼ -4.00%
- Median HH income
- $49,518
- Composite
- 41.49/100
- National rank
- #3458
- State rank
- #42 of 73 in FL
Livability — North Fort Myers
- Score
- 74/100
- State rank
- #269
- US rank
- #4409
Category grades
Schools grade is shown separately in the Schools card above.
Census & demographics
- Census place
- North Fort Myers, FL
- County
- Lee County · 788,662 people
- City population
- 57,035
- Metro
- Cape Coral-Fort Myers, FL
- Population (ZIP)
- 23,655
- Household income
- $56,993
- Rent vs Own
- Severe rent burden
- 468.0
Population outlook (Lee County) Hauer SSP2
- Today (2025)
- 871,946 people
- By 2030
- 955,468 · +9.6%
- By 2040
- 1,113,587 · +27.7%
- By 2050
- 1,256,891 · +44.1%
- By 2075
- 1,560,270 · +78.9%
- By 2100
- 1,726,848 · +98.0%
Race, ethnicity, and origin ACS 2023
- Neighborhood character
- Predominantly White (81%)
- Race & ethnicity
- White 81% Hispanic / Latino 14% Two or more races 8% Black 2%
- Hispanic origin (detail)
- Mexican 3% Puerto Rican 3% Cuban 3%
- Common ancestry
- Lithuanian 4% Romanian 4% Italian 3%
- Foreign-born
- 11% · Canada
- Languages at home
- 88% English-only · Spanish 9% Other Indo-European 1%
Political lean MEDSL · Lee
- 2024 margin
- Strong R (+28.4) · D 35.5% · R 63.9%
- 2008→2024 swing
- -18.0pp toward R · 2008: -10.4pp · 2024: -28.4pp
- All cycles
- 2024: R+28.4 2020: R+19.2 2016: R+20.4 2012: R+16.6 2008: R+10.4
Not yet ingested
- Civics
- —
Market trends
- HPI YoY
- ▼ -172.26%
- Current HPI
- 256.773
- Rent YoY
- ▼ -1.94%
- Metro
- Cape Coral-Fort Myers, FL
- State GDP YoY
- ▲ 3.28%
- F500 in state
- 36
Industry mix (Fortune 500 HQ in FL)
| Industry | F500 HQs | Revenue |
|---|---|---|
| Industrial Technology | 2 | $29B |
|
||
| Insurance | 2 | $17B |
|
||
| Retail | 1 | $60B |
|
||
| Technology Distribution | 1 | $58B |
|
||
| Homebuilding | 1 | $35B |
|
||
| Technology Manufacturing | 1 | $35B |
|
||
Price history
+221.7% since first listed14 events — show timeline
- 2026-02-05 Price Changed $72,700 FORTMLS
- 2026-01-20 Listed $85,000 FORTMLS
- 2019-03-11 Sold (Public Records) $52,000 Public Records
- 2019-01-28 Listing Removed — FORTMLS
- 2018-12-27 Price Changed $59,900 FORTMLS
- 2018-10-30 Listed $60,900 FORTMLS
- 2018-09-30 Listing Removed — FORTMLS
- 2018-09-26 Relisted — FORTMLS
- 2018-08-23 Pending — FORTMLS
- 2018-06-30 Price Changed $60,900 FORTMLS
- 2018-06-02 Listed $62,000 FORTMLS
- 2018-05-16 Sold (Public Records) $42,000 Public Records
- 1991-08-05 Sold (Public Records) $37,500 Public Records
- 1989-02-01 Sold (Public Records) $22,600 Public Records
Property tax history
+8.1%/yrLatest (2025): $1,147 · +16.1% YoY. Source: county tax records.
Cash-flow waterfall
monthlySold comps — $/sqft
last 12 mo · ≤1 miLoading sold comps…