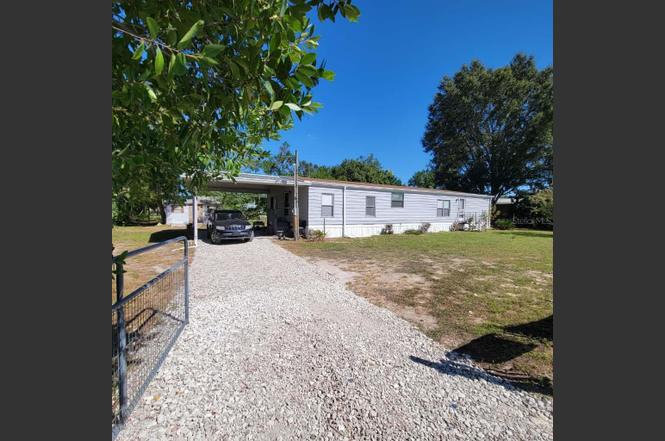
16165 Narrow St · Spring Hill, FL
Flood risk 1/10 · Minimal
- FEMA flood zone
- X (unshaded)
- Chance of flooding over 30 yrs
- 0.0%
- Est. flood insurance / yr
- $507 – $1,088
Fire risk 5/10 · Moderate
- Est. fire insurance / yr
- $947 – $1,759
Heat risk 10/10 · Severe
- Hot days now (above 109°F)
- 7 days/yr
- Hot days in 30 yrs
- 26 days/yr
Wind risk 10/10 · Severe
- Chance of severe wind over 30 yrs
- 99.0%
Air-quality risk 2/10 · Minimal
- Unhealthy air days now
- 2 days/yr
- Unhealthy air days in 30 yrs
- 2 days/yr
Risk factors via First Street. Map © Google.
Why this score? — see what drove the B- grade
The composite is a weighted blend of 9 inputs, each scored 0–100. Each bar is that input's sub-score; the figure is the points it added to the 100-point composite (weight × sub-score).
- Cash flow +25.6/30.0
- ARV discount +15.0/15.0
- DSCR +8.5/10.0
- 1% rule +6.4/10.0
- Schools +4.2/10.0
- Livability +3.2/5.0
- Rent growth +2.9/5.0
- Condition / age +2.5/5.0
- Appreciation +0.0/10.0
$185,000
🖨 Deal sheet 📄 Offer letter ✓ Due diligence
Listing remarks MLS
3-2 in Brooksville, FL!
Key facts
- New well pump
- New gutters
- Recently renovated
Tags
Property features AI
Finance
- Other: Lot size approximately 0.34 acres (0.25–0.5 acre); Asphalt road access; Living area about 1728 square feet; Total rooms: 5
- HOA & community: No HOA association; Community street lights
Exterior
- Parking: Carport with 2 spaces
- Utilities: Public water; Septic tank; Electricity connected; Water connected; Sewer available; Broadband/high-speed internet available
- Home design: Manufactured double wide home; Residential property; One story; Faces north; Entry level: One
- Construction: Vinyl siding and frame construction; Shingle roof; Pillar/post/pier foundation; Built in 1 building (double wide)
- Exterior features: Sidewalk; Storage
Interior
- Kitchen: Cooktop; Dishwasher; Disposal; Microwave
- Bedrooms: 3 bedrooms
- Flooring: Carpet; Ceramic tile; Laminate
- Bathrooms: 2 full bathrooms
- Heating & cooling: Central heating; Central air conditioning
- Interior features: Built-in features
- Laundry & utility: Laundry room; Washer; Electric water heater
Neighborhood map
What this means for you Summary
Snapshot
- This is a 3-bed/2.0-bath manufactured listed at $185k.
Deal economics
- At list price, monthly cash flow is $435 ($5k/yr) — positive.
- The deal already cash-flows at list — no discount required.
- Meets the 1% rule at list price ($2k rent vs $185k).
- Recommended offer: $163k (12.0% below list) — sets the bar for market timing.
- Cap rate 9.1% vs local median 4.4% in Spring Hill — top-decile yield for the area; either an underpriced asset or a hidden risk that comps aren't pricing in. Stress-test before assuming the spread holds.
Location & tenants
- Location reads 63/100 on livability (#738 in FL) — a middle-class / working-renter tenant base. Strengths: cost of living A+, housing A+; Watch: health & safety C-, employment D+, amenities F.
- Hernando (suburban): math 50% / reading 50% proficiency, ranked #38 of 73 in FL (top 52%) — acceptable for families but not a draw, mixed tenant base, ~2y average lease.
- Market conditions: Rents rising (+1.6%/yr); 196 active listings in the ZIP; 3 comparable units currently listed for rent nearby; rentals leasing fast (median 13d on market — plan ~1-2 weeks tenant-placement turnaround); solid renter incomes; 2,505 units permitted in Hernando County in 2024 (318 in 5+ unit buildings).
Forward outlook
- Local home prices are declining (-3.0%/yr); year-one equity from $1k of loan paydown is wiped out by about $6k of value loss. Plan a longer hold.
- Hernando County population projected at +11% by 2050 — modest demand growth; plan on rents tracking national, not racing it.
Negotiation context
- It's been on market 245 days — a 12% lower offer ($163k) is reasonable based on typical stale-listing flexibility.
- 7 sale attempts since 22y ago; this cycle's ask has dropped $30k (14%) from the opening price — seller is motivated, your offer sets the floor, not the list.
- Current owner paid $83k; list at $185k implies a 123% gain — meaningful room to come down on a strong offer.
Risks & watch-outs
- Climate carrying-cost: severe wind risk, 99% chance of damaging wind over 30y; moderate wildfire risk; extreme-heat days projected 7→26/yr by 2055 (HVAC capex compounding) — expect insurance premiums to compound above CPI over the hold.
Questions for the listing agent
- It's been on market 245 days. Have you received any prior offers? Is the seller open to a 12% concession, seller financing, or rate buy-down credit?
- Why hasn't it sold? Are there any deal-killer items the seller is aware of (foundation, flood, title, zoning, code violations)?
- Is there a deadline driving the sale (1031 exchange, divorce, estate, relocation)? That informs how much negotiation room exists.
- What's the average days-on-market for RENTAL listings here right now (not sales)? A rising rental-DOM trend means longer vacancies and softer asking-rent achievability than the comps imply.
- What's the recent tenant-quality profile in this submarket — average credit score on applications, eviction rate, late-payment / NSF rate, and stable-employment percentage? A property-management company in the area should have these aggregated.
- How much new for-sale + rental construction is in the pipeline within 1–3 miles? Heavy new supply typically softens prices + rents 12–24 months out; constrained supply supports both.
Investment metrics
- 1% rule
- 1.14% ✓
- Cap rate
- 9.11%
- Cash-on-cash
- 10.07%
- DSCR
- 1.45
- GRM
- 7.3
CMA / ARV
- ARV (on-the-fly)
- $238,464
- Comps found
- 5
Show comp detail 5 sales within ~0.75 mi
| Address | Dist | Beds/Ba | Sqft | Sold | Price | $/sf | Match |
|---|---|---|---|---|---|---|---|
| 4357 Orlando Ave | 0.27mi | 3/2.0 | 1,620 (-6%) | 0mo | $134,000 | $83 | 77 |
| 16125 Putnam St | 0.29mi | 3/2.0 | 1,836 (+6%) | 2mo | $175,000 | $95 | 74 |
| 16077 Bradenton St | 0.71mi | 4/2.0 (+1) | 1,813 (+5%) | 3mo | $251,000 | $138 | 51 |
| 16109 La Bella St | 0.41mi | 4/2.0 (+1) | 1,512 (-12%) | 13mo | $219,000 | $145 | 44 |
| 5139 Orlando Ave | 0.71mi | 4/2.0 (+1) | 1,832 (+6%) | 11mo | $264,200 | $144 | 43 |
Match score weights: distance 35% · size 25% · config 20% · recency 20%. Top-matched comps best support the ARV.
Projected returns pro-forma
-3.0% appreciation · 1.61% rent growth · sell at horizon
- IRR
- -2.7%
- Equity multiple
- 0.90×
- Total profit
- $-5,199
- Equity at exit
- $27,584
- IRR
- 5.4%
- Equity multiple
- 1.38×
- Total profit
- $19,527
- Equity at exit
- $15,995
Cash invested: $51,800 (down + closing). Projections, not guarantees.
Landlord ↔ Tenant lean methodology
- Overall (STATE)
- 87 Strongly Landlord-Friendly
- State Florida
- 87 Strongly Landlord-Friendly · R+3
- County
- — inherits STATE
- City
- — inherits STATE
ZIP-level market 34604
- Home prices YoY
- -23.4%
- Rents YoY
- 1.6%
- Active inventory
- 196
- Price-to-rent
- 7.3×
Monthly cashflow live
- Estimated rent
- $2,108 medium interval (Pro) →
- Mortgage (P&I)
- −$970
- Tax from tax record
- −$184 /mo · $2,205/yr
- Insurance
- −$77
- HOA
- −$0
- Vacancy / Maint / Mgmt
- −$443
- Net cashflow
- $435
Break-even live
UW: 25.0% down · 7.5% · 30yr · 1.5% tax · 5.0% vac · 8.0% maint · 8.0% mgmt
Financing live
Cash to close
- Down payment
- $46,250
- Closing costs
- $5,550
- Reserves months
- —
- Total cash needed
- —
Loan-product check · same deal, 3 products live
Conventional
25% down · 7.5% · 30yr
- Down + closing
- —
- Monthly P&I
- —
- Monthly cashflow
- —
- DSCR
- —
- Eligible?
- —
Personal DTI + credit; lowest rate.
DSCR
20% down · 8.5% · 30yr
- Down + closing
- —
- Monthly P&I
- —
- Monthly cashflow
- —
- DSCR
- —
- Eligible?
- —
No personal income docs; deal must DSCR.
Hard money
10% down · 12.0% · 12mo
- Down + closing
- —
- Monthly P&I
- —
- Monthly cashflow
- —
- DSCR
- —
- Eligible?
- —
Short-term bridge; refi at stabilization.
Rent comps 3 comps
| Address | Beds | Baths | Sqft | Rent | $/sqft | DOM | Units | Dist |
|---|---|---|---|---|---|---|---|---|
| 286 Cherry Birch LN Masaryktown, FL | 3.0 | 1.0–2.0 | 964 | $1,884 | $1.95 | 1d | 44 | 0.75mi |
| 14499 Tamarind Loop Spring Hill, FL | 3.0 | 2.0 | 1688 | $2,200 | $1.30 | 12d | 1 | 1.24mi |
| 14501 Silversmith Cir Spring Hill, FL | 3.0 | 2.0 | 1557 | $2,000 | $1.28 | 24d | 1 | 1.34mi |
Listing history 37 events
-
2026-06-18days on market $185,000 Active 245 DOM
-
2026-06-17days on market $185,000 Active 244 DOM
-
2026-06-16days on market $185,000 Active 243 DOM
-
2026-06-15days on market $185,000 Active 242 DOM
-
2026-06-13days on market $185,000 Active 240 DOM
-
2026-06-13days on market $185,000 Active 239 DOM
-
2026-06-09days on market $185,000 Active 236 DOM
-
2026-06-08days on market $185,000 Active 235 DOM
-
2026-06-07pricedays on market $185,000 Active 234 DOM
-
2026-06-04days on market $192,000 Active 231 DOM
-
2026-06-03days on market $192,000 Active 230 DOM
-
2026-06-02days on market $192,000 Active 229 DOM
-
2026-06-01days on market $192,000 Active 228 DOM
-
2026-05-31days on market $192,000 Active 227 DOM
-
2026-05-07price $192,000
-
2026-04-30price $201,000
-
2026-03-10price $202,999
-
2026-02-18price $203,999
-
2026-01-20price $205,000
-
2025-11-21price $209,000
-
2025-10-17$215,000 Active
-
2023-11-02soldstatus $83,000 Closed 23-char remark
Show marketing remark (23 chars)
3-2 in Brooksville, FL!
-
2023-09-19soldstatus $83,000
-
2023-08-10status Pending 23-char remark
Show marketing remark (23 chars)
3-2 in Brooksville, FL!
-
2023-07-28status Active 23-char remark
Show marketing remark (23 chars)
3-2 in Brooksville, FL!
-
2023-07-11status Pending 23-char remark
Show marketing remark (23 chars)
3-2 in Brooksville, FL!
-
2023-06-06price $109,900 23-char remark
Show marketing remark (23 chars)
3-2 in Brooksville, FL!
-
2023-05-15$124,900 Active 23-char remark
Show marketing remark (23 chars)
3-2 in Brooksville, FL!
-
2020-09-29historical
-
2020-09-29historical
-
2019-10-31soldstatus $35,000
-
2012-05-12$37,000
-
2011-11-26historical
-
2011-08-26$40,000
-
2010-12-30$56,000
-
2004-03-31soldstatus $34,000
-
2004-02-23$34,900
ⓘ Source: listings_history table (triggers on properties + properties_extension) + one-shot
backfill from property_details.listing_events for pre-trigger history.
Tax reassessment forecast FL · Resets to sale price
- Current annual tax
- $2,205 · $184/mo
- Projected year-2 tax
- $2,205 · $184/mo
- Expected delta
- $0/yr ($0/mo · 0.0%)
ⓘ Screening estimate from a state-policy table — verify with the county assessor before closing.
Climate risk First Street
- Flood 1/10 Low FEMA zone X (unshaded) · 0% chance over 30 yrs
- Wildfire 5/10 Major
- Heat 10/10 Extreme 7 d/yr ≥109°F today · 26 d/yr by 30 yrs out
- Wind 10/10 Extreme 99% chance of damaging wind over 30 yrs
- Air quality 2/10 Low 2 unhealthy d/yr today · 2 by 30 yrs out
Nearby sold comps map
Loading sold comps map…
Walkable amenities ~0.75 mi
Loading nearby amenities…
Taxation est. · year 1
- Rental income
- $25,302
- − Mortgage interest
- −$10,363
- − Property taxes
- −$2,205
- − Insurance
- −$925
- − Repairs & maintenance
- −$2,024
- − Management
- −$2,024
- − Depreciation
- −$5,382
- Taxable income
- $2,379
- Est. tax owed @ 24.0%
- −$571
- After-tax cash flow
- $4,645/yr
For passive investors: Depreciation is non-cash, so a rental often shows a tax loss while cash-flowing — sheltering income. Rental losses are passive: they offset passive income freely, and up to $25,000/yr can offset ordinary (W-2) income if you actively participate and your MAGI is under $100k (phasing out to $0 by $150k); unused losses carry forward. On sale, claimed depreciation is recaptured at up to 25%, and gains may owe capital-gains tax (a 1031 exchange can defer both). Figures are a year-1 estimate at your 24.0% rate — not tax advice; consult a CPA.
Schools (NCES district)
- District
- Hernando
- NCES district ID
- 1200810
- Math proficiency
- 50% ▼ -8.00%
- Reading proficiency
- 50% ▼ -4.00%
- Median HH income
- $41,985
- Composite
- 42.03/100
- National rank
- #3329
- State rank
- #38 of 73 in FL
Livability — Spring Hill
- Score
- 63/100
- State rank
- #738
- US rank
- #15937
Category grades
Schools grade is shown separately in the Schools card above.
Census & demographics
- Census place
- Spring Hill, FL
- County
- Hernando County · 169,677 people
- City population
- 83,915
- Metro
- Tampa-St. Petersburg-Clearwater, FL
- Population (ZIP)
- 13,642
- Household income
- $84,833
- Rent vs Own
- Severe rent burden
- 142.0
Population outlook (Hernando County) Hauer SSP2
- Today (2025)
- 189,218 people
- By 2030
- 194,367 · +2.7%
- By 2040
- 203,398 · +7.5%
- By 2050
- 209,589 · +10.8%
- By 2075
- 218,452 · +15.4%
- By 2100
- 205,923 · +8.8%
Race, ethnicity, and origin ACS 2023
- Neighborhood character
- Predominantly White (74%)
- Race & ethnicity
- White 74% Hispanic / Latino 16% Two or more races 10% Black 3% Asian 2%
- Hispanic origin (detail)
- Mexican 1% Puerto Rican 10% Cuban 3%
- Common ancestry
- Romanian 3% Lithuanian 2% Scotch-Irish 2%
- Foreign-born
- 4% · Canada
- Languages at home
- 89% English-only · Spanish 8% Other Indo-European 1% Russian/Polish/Slavic 1%
Political lean MEDSL · Hernando
- 2024 margin
- Solid R (+37.0) · D 31.1% · R 68.2%
- 2008→2024 swing
- -33.5pp toward R · 2008: -3.6pp · 2024: -37.0pp
- All cycles
- 2024: R+37.0 2020: R+30.2 2016: R+29.0 2012: R+8.5 2008: R+3.6
Not yet ingested
- Civics
- —
Market trends
- HPI YoY
- ▼ -84.38%
- Current HPI
- 276.4751
- Rent YoY
- ▲ 1.61%
- Metro
- Tampa-St. Petersburg-Clearwater, FL
- State GDP YoY
- ▲ 3.28%
- F500 in state
- 36
Industry mix (Fortune 500 HQ in FL)
| Industry | F500 HQs | Revenue |
|---|---|---|
| Industrial Technology | 2 | $29B |
|
||
| Insurance | 2 | $17B |
|
||
| Retail | 1 | $60B |
|
||
| Technology Distribution | 1 | $58B |
|
||
| Homebuilding | 1 | $35B |
|
||
| Technology Manufacturing | 1 | $35B |
|
||
Price history
+450.1% since first listed23 events — show timeline
- 2026-05-07 Price Changed $192,000 Stellar MLS as Distributed by MLS Grid
- 2026-04-30 Price Changed $201,000 Stellar MLS as Distributed by MLS Grid
- 2026-03-10 Price Changed $202,999 Stellar MLS as Distributed by MLS Grid
- 2026-02-18 Price Changed $203,999 Stellar MLS as Distributed by MLS Grid
- 2026-01-20 Price Changed $205,000 Stellar MLS as Distributed by MLS Grid
- 2025-11-21 Price Changed $209,000 Stellar MLS as Distributed by MLS Grid
- 2025-10-17 Listed $215,000 Stellar MLS as Distributed by MLS Grid
- 2023-11-02 Sold (MLS) $83,000 Stellar MLS as Distributed by MLS Grid
- 2023-09-19 Sold (Public Records) $83,000 Public Records
- 2023-08-10 Pending — Stellar MLS as Distributed by MLS Grid
- 2023-07-28 Relisted — Stellar MLS as Distributed by MLS Grid
- 2023-07-11 Pending — Stellar MLS as Distributed by MLS Grid
- 2023-06-06 Price Changed $109,900 Stellar MLS as Distributed by MLS Grid
- 2023-05-15 Listed $124,900 Stellar MLS as Distributed by MLS Grid
- 2020-09-29 Listing Removed — HCAR
- 2020-09-29 Listing Removed — HCAR
- 2019-10-31 Sold (Public Records) $35,000 Public Records
- 2012-05-12 Listed $37,000 HCAR
- 2011-11-26 Listing Removed — Stellar MLS as Distributed by MLS Grid
- 2011-08-26 Listed $40,000 Stellar MLS as Distributed by MLS Grid
- 2010-12-30 Listed $56,000 HCAR
- 2004-03-31 Sold (MLS) $34,000 HCAR
- 2004-02-23 Listed $34,900 HCAR
Property tax history
+9.7%/yrLatest (2025): $2,205 · -7.9% YoY. Source: county tax records.
Cash-flow waterfall
monthlySold comps — $/sqft
last 12 mo · ≤1 miLoading sold comps…