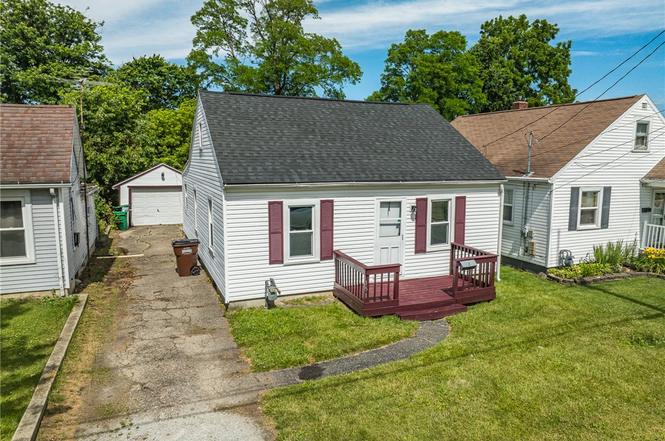
151 4th Ave · Springfield, OH
Flood risk 1/10 · Minimal
- FEMA flood zone
- X (unshaded)
- Chance of flooding over 30 yrs
- 0.0%
- Est. flood insurance / yr
- $507 – $1,088
Fire risk 1/10 · Minimal
- Est. fire insurance / yr
- $713 – $1,323
Heat risk 3/10 · Minor
- Hot days now (above 100°F)
- 7 days/yr
- Hot days in 30 yrs
- 18 days/yr
Wind risk 2/10 · Minimal
- Chance of severe wind over 30 yrs
- 0.0%
Air-quality risk 3/10 · Minor
- Unhealthy air days now
- 2 days/yr
- Unhealthy air days in 30 yrs
- 3 days/yr
Risk factors via First Street. Map © Google.
Why this score? — see what drove the C- grade
The composite is a weighted blend of 9 inputs, each scored 0–100. Each bar is that input's sub-score; the figure is the points it added to the 100-point composite (weight × sub-score).
- Cash flow +16.7/30.0
- ARV discount +15.0/15.0
- DSCR +5.2/10.0
- 1% rule +4.3/10.0
- Livability +2.8/5.0
- Rent growth +2.5/5.0
- Condition / age +2.5/5.0
- Schools +1.9/10.0
- Appreciation +0.0/10.0
$139,900
🖨 Deal sheet (PDF) 📄 Offer letter ✓ Due diligence
Listing remarks MLS
Own for less than rent with this lovely 3 bed 1 bath Cape Cod! From the entryway is a spacious living room straight into a bonus room that could be used as a play room or formal dining area. Large eat in kitchen, and covered patio where the owner moved the laundry room for convenience and space! Two of the bedrooms are on the first floor and the attic has been finished to make a spacious third bedroom. 1 car detached garage and back yard is near fully fenced in! Fresh new paint on the interior and ready for your personal touches! Entry deck and shutters will be painted black once the weather cooperates! Conveniently located near shopping and highway access! Call to schedule a showing today!
Key facts
- Spacious yard
- Upstairs area
- Detached garage
Tags
Property features AI
Finance
- Financial info: Offered for sale
Exterior
- Parking: Detached one-car garage
- Home design: Single-family residence
- Construction: Aluminum and vinyl siding
- Exterior features: Irregular lot; Residential zoning
Interior
- Kitchen: Kitchen on the main level (9 x 19)
- Bedrooms: Two main-level bedrooms (11 x 10 and 11 x 11)
- Bathrooms: One full bathroom (main level)
- Heating & cooling: Central air conditioning; Forced air heating (natural gas)
- Interior features: Bonus room on the second level (24 x 12); Florida room on the main level (23 x 8); Living room on the main level (13 x 13); Dining room on the main level (11 x 13)
Neighborhood map
What this means for you Summary
Snapshot
- This is a 2-bed/1.0-bath single-family listed at $140k.
Deal economics
- At list price, monthly cash flow is $87 ($1k/yr) — positive.
- The deal already cash-flows at list — no discount required.
- To meet the 1% rule (rent ≥ 1% of price), the offer needs to be $130k (7.3% below list).
- Recommended offer: $130k (7.3% below list) — sets the bar for 1% rule.
- Cap rate 7.0% vs local median 4.7% in Springfield — top-decile yield for the area; either an underpriced asset or a hidden risk that comps aren't pricing in. Stress-test before assuming the spread holds.
Location & tenants
- Location reads 56/100 on livability (#1,108 in OH) — a working-class tenant base; expect higher turnover. Strengths: cost of living A+, housing A+; Watch: crime F, amenities F, commute F.
- Springfield City School District (urban): math 20% / reading 27% proficiency, ranked #616 of 656 in OH (top 94%) — low school quality limits family demand, transient renter base, plan for 1-2y turnover; 75% free/reduced lunch — lower-income household profile, screen leases tightly.
- Zoned schools: Mann Elementary School (math 29% / reading 32%, grade F, #1,151 of 1,584 statewide, top 73%, 383 students, 0% FRL); Schaefer Middle School (math 20% / reading 27%, grade F, #597 of 654 statewide, top 92%, 268 students, 0% FRL); Springfield High School (math 17% / reading 31%, grade F, #665 of 781 statewide, top 85%, 1,516 students, 0% FRL) — zoned schools average 0% FRL vs 75% district-wide (75 pts lower); this property's tenant base skews higher-income than the district average.
- Market conditions: 158 active listings in the ZIP; 3 comparable units currently listed for rent nearby; rentals leasing fast (median 5d on market — plan ~1-2 weeks tenant-placement turnaround); lower-income renter base — watch delinquency; 232 units permitted in Clark County in 2024 (116 in 5+ unit buildings).
- This rent runs 36% of the median local income ($44k/yr) — at the standard rent-burdened threshold; future hikes will face affordability resistance.
Forward outlook
- Local home prices are declining (-3.0%/yr); year-one equity from $967 of loan paydown is wiped out by about $4k of value loss. Plan a longer hold.
- Clark County population projected at -16% by 2050 — secular population decline; favor cash flow + early exit over multi-decade hold.
Negotiation context
- Only 6 days on market — expect competitive offers; lowballing is unlikely to land.
- 2 sale attempts since 4y ago with the ask held roughly flat each time — persistent listings suggest the price (not the market) is what's stuck; bring a comps-based counter.
- Current owner paid $97k; 44% above their basis — modest negotiation headroom, anchor on the comps not their cost.
Risks & watch-outs
- Watch-outs: built in 1926 — expect roof / HVAC / electrical / plumbing capex.
Questions for the listing agent
- Built in 1926 — when were the roof, HVAC, electrical panel, plumbing, and water heater last replaced?
- Is there a deadline driving the sale (1031 exchange, divorce, estate, relocation)? That informs how much negotiation room exists.
- Crime grade is F in this area — have there been break-ins, vandalism, or insurance claims at this property in the last 3 years? What carrier currently insures it and at what premium?
- What's the average days-on-market for RENTAL listings here right now (not sales)? A rising rental-DOM trend means longer vacancies and softer asking-rent achievability than the comps imply.
- What's the recent tenant-quality profile in this submarket — average credit score on applications, eviction rate, late-payment / NSF rate, and stable-employment percentage? A property-management company in the area should have these aggregated.
- How much new for-sale + rental construction is in the pipeline within 1–3 miles? Heavy new supply typically softens prices + rents 12–24 months out; constrained supply supports both.
Investment metrics
- 1% rule
- 0.93% ✗
- Cap rate
- 7.04%
- Cash-on-cash
- 2.67%
- DSCR
- 1.12
- GRM
- 9.0
CMA / ARV
- ARV (on-the-fly)
- $188,136
- Comps found
- 12
Show comp detail 12 sales within ~0.75 mi
| Address | Dist | Beds/Ba | Sqft | Sold | Price | $/sf | Match |
|---|---|---|---|---|---|---|---|
| 451 Lawnview Ave | 0.36mi | 3/2.0 (+1) | 1,226 (+2%) | 2mo | $205,000 | $167 | 69 |
| 121 Willis Ave | 0.19mi | 2/1.0 | 1,042 (-14%) | 3mo | $169,900 | $163 | 66 |
| 3332 E High St | 0.64mi | 3/1.0 (+1) | 1,228 (+2%) | 2mo | $200,000 | $163 | 61 |
| 262 Raffensperger Ave | 0.68mi | 2/1.0 | 1,148 (-5%) | 4mo | $54,500 | $47 | 57 |
| 438 Lawnview Ave | 0.34mi | 3/1.0 (+1) | 1,327 (+10%) | 7mo | $160,000 | $121 | 57 |
| 120 S Fostoria Ave | 0.25mi | 3/1.5 (+1) | 1,342 (+11%) | 8mo | $170,500 | $127 | 56 |
| 507 Elbron Rd | 0.64mi | 3/2.0 (+1) | 1,232 (+2%) | 2mo | $265,000 | $215 | 56 |
| 106 Cottage Pl | 0.60mi | 3/1.5 (+1) | 1,056 (-12%) | 1mo | $164,900 | $156 | 44 |
| 532 Gruen Dr | 0.53mi | 3/1.0 (+1) | 1,041 (-14%) | 6mo | $155,000 | $149 | 42 |
| 314 Raffensperger Ave | 0.69mi | 3/2.0 (+1) | 1,352 (+12%) | 1mo | $170,000 | $126 | 38 |
| 501 Elbron Rd | 0.64mi | 3/2.0 (+1) | 1,072 (-11%) | 6mo | $275,000 | $257 | 37 |
| 127 Bellevue Ave | 0.73mi | 3/1.0 (+1) | 1,040 (-14%) | 7mo | $129,900 | $125 | 32 |
Match score weights: distance 35% · size 25% · config 20% · recency 20%. Top-matched comps best support the ARV.
Projected returns pro-forma
-3.0% appreciation · 3.0% rent growth · sell at horizon
- IRR
- -12.1%
- Equity multiple
- 0.56×
- Total profit
- $-17,108
- Equity at exit
- $20,860
- IRR
- -2.9%
- Equity multiple
- 0.80×
- Total profit
- $-7,731
- Equity at exit
- $12,096
Cash invested: $39,172 (down + closing). Projections, not guarantees.
Landlord ↔ Tenant lean methodology
- Overall (STATE)
- 73 Landlord-Friendly
- State Ohio
- 73 Landlord-Friendly · R+6
- County
- — inherits STATE
- City
- — inherits STATE
ZIP-level market 45505
- Home prices YoY
- -34.3%
- Active inventory
- 158
- Price-to-rent
- 9.0×
Monthly cashflow live
- Estimated rent
- $1,297 medium interval (Pro) →
- Mortgage (P&I)
- −$734
- Tax from tax record
- −$146 /mo · $1,748/yr
- Insurance
- −$58
- HOA
- −$0
- Vacancy / Maint / Mgmt
- −$272
- Net cashflow
- $87
Break-even live
Sensitivity live
| Price | -10% $166 | -5% $127 | +0% $87 | +5% $48 | +10% $8 |
|---|---|---|---|---|---|
| Rent | -10% $-15 | -5% $36 | +0% $87 | +5% $139 | +10% $190 |
| Rate | -1.0pp $158 | -0.5pp $123 | base $87 | +0.5pp $51 | +1.0pp $14 |
UW: 25.0% down · 7.5% · 30yr · 1.5% tax · 5.0% vac · 8.0% maint · 8.0% mgmt
Financing live
Cash to close
- Down payment
- $34,975
- Closing costs
- $4,197
- Reserves months
- —
- Total cash needed
- —
Loan-product check · same deal, 3 products live
Conventional
25% down · 7.5% · 30yr
- Down + closing
- —
- Monthly P&I
- —
- Monthly cashflow
- —
- DSCR
- —
- Eligible?
- —
Personal DTI + credit; lowest rate.
DSCR
20% down · 8.5% · 30yr
- Down + closing
- —
- Monthly P&I
- —
- Monthly cashflow
- —
- DSCR
- —
- Eligible?
- —
No personal income docs; deal must DSCR.
Hard money
10% down · 12.0% · 12mo
- Down + closing
- —
- Monthly P&I
- —
- Monthly cashflow
- —
- DSCR
- —
- Eligible?
- —
Short-term bridge; refi at stabilization.
Rent comps 3 comps
| Address | Beds | Baths | Sqft | Rent | $/sqft | DOM | Units | Dist |
|---|---|---|---|---|---|---|---|---|
| 190 Skyway Dr Springfield, OH | 3.0 | 2.5 | 1460 | $2,200 | $1.51 | 4d | 1 | 1.01mi |
| 127 N Belmont Ave Unit 1 Springfield, OH | 2.0 | 1.0 | 1052 | $1,050 | $1.00 | 3d | 1 | 1.04mi |
| 515 Ludlow Ave Springfield, OH | 3.0 | 1.0 | 1000 | $950 | $0.95 | 45d | 1 | 1.28mi |
Listing history 5 events
-
2026-06-22days on market $139,900 Active 6 DOM
-
2026-06-19days on market $139,900 Active 3 DOM
-
2026-06-18days on market $139,900 Active 2 DOM
-
2026-06-17remarks 368-char remark
-
2026-06-17$139,900 Active 1 DOM
ⓘ Source: listings_history table (triggers on properties + properties_extension) + one-shot
backfill from property_details.listing_events for pre-trigger history.
Tax reassessment forecast OH · Partial reset (capped growth)
- Current annual tax
- $1,748 · $146/mo
- Projected year-2 tax
- $1,965 · $164/mo
- Expected delta
- +$217/yr (+$18/mo · 12.4%)
ⓘ Screening estimate from a state-policy table — verify with the county assessor before closing.
Climate risk First Street
- Flood 1/10 Low FEMA zone X (unshaded) · 0% chance over 30 yrs
- Wildfire 1/10 Low
- Heat 3/10 Moderate 7 d/yr ≥100°F today · 18 d/yr by 30 yrs out
- Wind 2/10 Low 0% chance of damaging wind over 30 yrs
- Air quality 3/10 Moderate 2 unhealthy d/yr today · 3 by 30 yrs out
Nearby sold comps map
Loading sold comps map…
Walkable amenities ~0.75 mi
Loading nearby amenities…
Taxation est. · year 1
- Rental income
- $15,568
- − Mortgage interest
- −$7,837
- − Property taxes
- −$1,748
- − Insurance
- −$700
- − Repairs & maintenance
- −$1,245
- − Management
- −$1,245
- − Depreciation
- −$4,070
- Taxable loss
- −$1,277
- Est. tax savings @ 24.0%
- +$306
- After-tax cash flow
- $1,354/yr
For passive investors: Depreciation is non-cash, so a rental often shows a tax loss while cash-flowing — sheltering income. Rental losses are passive: they offset passive income freely, and up to $25,000/yr can offset ordinary (W-2) income if you actively participate and your MAGI is under $100k (phasing out to $0 by $150k); unused losses carry forward. On sale, claimed depreciation is recaptured at up to 25%, and gains may owe capital-gains tax (a 1031 exchange can defer both). Figures are a year-1 estimate at your 24.0% rate — not tax advice; consult a CPA.
Schools (NCES district)
- District
- Springfield City School District
- NCES district ID
- 3904481
- Math proficiency
- 20% ▼ -16.00%
- Reading proficiency
- 27% ▼ -12.00%
- Median HH income
- $32,541
- Composite
- 19.12/100
- National rank
- #8834
- State rank
- #616 of 656 in OH
Livability — Springfield
- Score
- 56/100
- State rank
- #1108
- US rank
- #22551
Category grades
Schools grade is shown separately in the Schools card above.
Census & demographics
- County
- Clark County · 33,261 people
- City population
- 33,261
- Metro
- Springfield, OH
- Population (ZIP)
- 19,826
- Household income
- $43,819
- Rent vs Own
- Severe rent burden
- 950.0
Population outlook (Clark County) Hauer SSP2
- Today (2025)
- 130,703 people
- By 2030
- 126,952 · -2.9%
- By 2040
- 118,344 · -9.5%
- By 2050
- 109,590 · -16.2%
- By 2075
- 89,464 · -31.6%
- By 2100
- 68,810 · -47.4%
Race, ethnicity, and origin ACS 2023
- Neighborhood character
- Predominantly White (75%)
- Race & ethnicity
- White 75% Black 14% Two or more races 7% Hispanic / Latino 4%
- Common ancestry
- Slovak 1% German 1% Iranian 1%
- Foreign-born
- 2% · Canada
- Languages at home
- 96% English-only · Spanish 2% French/Haitian/Cajun 1% German/W. Germanic 1%
Political lean MEDSL · Clark
- 2024 margin
- Strong R (+29.5) · D 34.8% · R 64.3%
- 2008→2024 swing
- -27.0pp toward R · 2008: -2.5pp · 2024: -29.5pp
- All cycles
- 2024: R+29.5 2020: R+23.3 2016: R+19.5 2012: R+1.8 2008: R+2.5
Not yet ingested
- Civics
- —
Market trends
- HPI YoY
- ▼ -135.16%
- Current HPI
- 258.9037
- Rent YoY
- —
- Metro
- Springfield, OH
- State GDP YoY
- ▲ 1.98%
- F500 in state
- 48
Industry mix (Fortune 500 HQ in OH)
| Industry | F500 HQs | Revenue |
|---|---|---|
| Insurance | 3 | $145B |
|
||
| Industrial Machinery | 3 | $49B |
|
||
| Financial Services | 3 | $24B |
|
||
| Consumer Goods | 2 | $93B |
|
||
| Aerospace / Defense | 2 | $47B |
|
||
| Utilities | 2 | $33B |
|
||
Price history
+337.2% since first listed8 events — show timeline
- 2026-06-17 Listed $139,900 Dayton MLS
- 2026-05-07 Sold (Public Records) $97,000 Public Records
- 2022-07-21 Sold (Public Records) $102,000 Public Records
- 2022-06-13 Sold (MLS) $102,000 WRIST
- 2022-05-09 Pending — WRIST
- 2022-05-06 Listed $95,000 WRIST
- 2004-04-01 Sold (Public Records) $67,000 Public Records
- 2003-09-16 Sold (Public Records) $32,000 Public Records
Property tax history
+7.1%/yrLatest (2025): $1,748 · +59.8% YoY. Source: county tax records.
Cash-flow waterfall
monthlySold comps — $/sqft
last 12 mo · ≤1 miLoading sold comps…