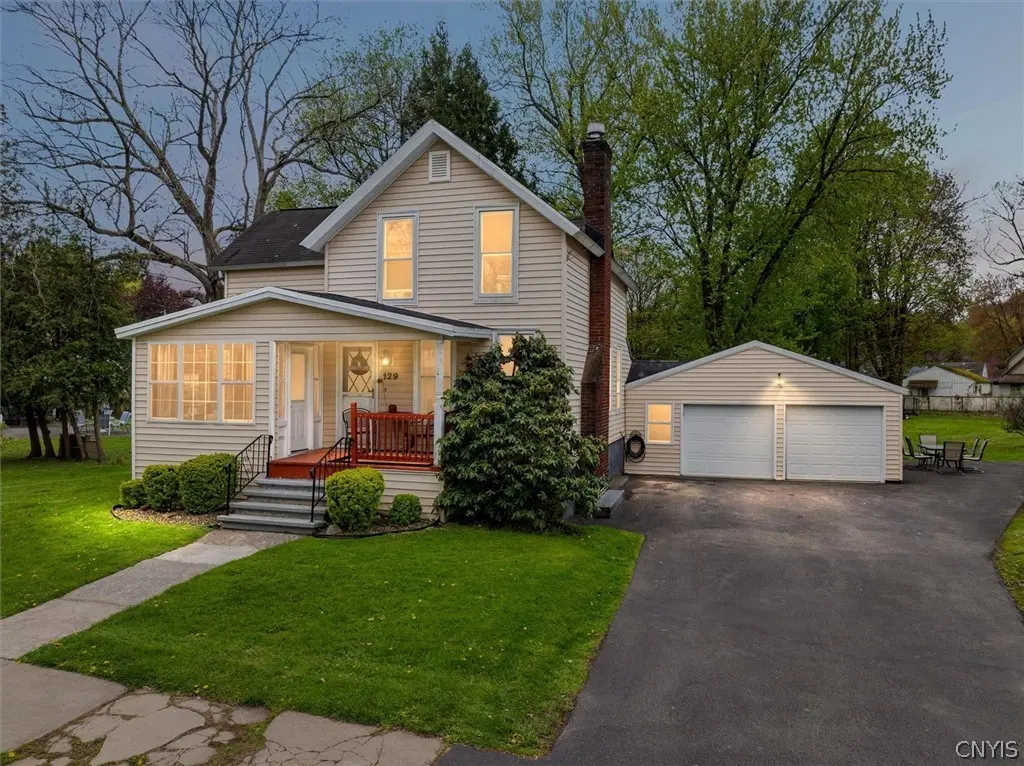
129 Seward Ave · Utica, NY
Flood risk 1/10 · Minimal
- FEMA flood zone
- X (unshaded)
- Chance of flooding over 30 yrs
- 0.0%
- Est. flood insurance / yr
- $473 – $860
Fire risk 3/10 · Minor
- Est. fire insurance / yr
- $691 – $1,283
Heat risk 3/10 · Minor
- Hot days now (above 95°F)
- 7 days/yr
- Hot days in 30 yrs
- 17 days/yr
Wind risk 1/10 · Minimal
- Chance of severe wind over 30 yrs
- 1.0%
Air-quality risk 2/10 · Minimal
- Unhealthy air days now
- 0 days/yr
- Unhealthy air days in 30 yrs
- 2 days/yr
Risk factors via First Street. Map © Google.
Why this score? — see what drove the C grade
The composite is a weighted blend of 9 inputs, each scored 0–100. Each bar is that input's sub-score; the figure is the points it added to the 100-point composite (weight × sub-score).
- Cash flow +23.4/30.0
- DSCR +7.5/10.0
- ARV discount +7.5/15.0
- 1% rule +5.5/10.0
- Livability +4.0/5.0
- Schools +2.9/10.0
- Rent growth +2.5/5.0
- Condition / age +2.5/5.0
- Appreciation +0.0/10.0
$209,000
🖨 Deal sheet 📄 Offer letter ✓ Due diligence
Listing remarks
Welcome to this beautifully maintained home in the heart of South Utica! Featuring 3 bedrooms and 1.5 bathrooms, this move-in ready property offers comfort, charm, and functionality. Enjoy relaxing mornings with coffee on the covered front porch or unwind in the private backyard, complete with an expansive yard and patio area — perfect for entertaining or quiet evenings at home. Inside, you’ll find a bright three-season room, central air conditioning, and a cozy gas fireplace that adds warmth and character throughout the year. The attached two-stall garage provides ample space for vehicles, storage, and even a workshop. A new driveway adds to the home’s curb appeal and con
Key facts
- Covered front porch
- Private backyard
- Expansive yard
Tags
Property features AI
Finance
- Other: Property listed as resale
Exterior
- Parking: Attached garage with 2 car spaces; Garage includes storage area, workshop and garage door opener
- Security: Owned security system
- Utilities: Electricity connected with circuit breakers; Public water connected; Sewer connected; High-speed internet available; Cable available
- Home design: Two-story existing single-family residence; Stone foundation; Vinyl siding; Asphalt shingle roof
- Construction: Built previously (existing); Stone foundation; Vinyl siding construction; Asphalt shingle roofing
- Exterior features: Blacktop driveway; Covered patio/porch; Patio; Porch; Shed(s) and exterior storage; Near public transit; Rectangular residential lot; City street frontage
Interior
- Kitchen: Gas oven and gas range; Range hood; Refrigerator; Exhaust fan
- Bedrooms: Total of 8 rooms including living areas, office, sunroom/Florida room and laundry (bedroom count not specified)
- Flooring: Carpet; Hardwood; Laminate; Tile; Varied flooring
- Bathrooms: 1 full bathroom; 1 half bathroom; One main-level bathroom
- Heating & cooling: Forced-air gas heating; Central air conditioning
- Interior features: Ceiling fans; Separate/formal dining room; Separate/formal living room; Home office; Programmable thermostat; Full dirt-floor basement
- Laundry & utility: Washer and dryer located on the main level; Gas water heater
Neighborhood map
What this means for you Summary
Snapshot
- This is a 3-bed/1.5-bath single-family listed at $209k.
Deal economics
- At list price, monthly cash flow is $388 ($5k/yr) — positive.
- The deal already cash-flows at list — no discount required.
- Meets the 1% rule at list price ($2k rent vs $209k).
- Recommended offer: $206k (1.5% below list) — sets the bar for market timing.
Location & tenants
- Location reads 80/100 on livability (#104 in NY, #1,589 nationally) — a professional / high-income tenant draw. Strengths: commute A+, cost of living A+, housing A+; Watch: employment D, schools D-, crime F.
- Utica City School District (urban): math 33% / reading 38% proficiency, ranked #562 of 590 in NY (top 95%) — families likely to look elsewhere, expect single-tenant / working-renter base with shorter leases; 71% free/reduced lunch — lower-income household profile, screen leases tightly.
- Market conditions: 150 active listings in the ZIP; 5 comparable units currently listed for rent nearby; rentals lingering (median 44d on market — plan ~5-8 weeks vacancy on turnover, expect pricing pressure); 100% of comp listings sitting > 30 days — soft ceiling on asking rent; 204 units permitted in Oneida County in 2024 (68 in 5+ unit buildings).
- At $2,202/mo this rent would consume 46% of the median local household income ($58k/yr) (locally 1604% of renters already pay >50% of income on rent) — very limited rent-growth headroom before tenants either downsize or default.
Forward outlook
- Local home prices are declining (-3.0%/yr); year-one equity from $1k of loan paydown is wiped out by about $6k of value loss. Plan a longer hold.
- Oneida County population projected at -12% by 2050 — secular population decline; favor cash flow + early exit over multi-decade hold.
Negotiation context
- It's been on market 24 days — a 2% lower offer ($206k) is reasonable based on typical stale-listing flexibility.
- Current owner paid $82k; list at $209k implies a 154% gain — meaningful room to come down on a strong offer.
Risks & watch-outs
- Watch-outs: built in 1925 — expect roof / HVAC / electrical / plumbing capex.
Questions for the listing agent
- Built in 1925 — when were the roof, HVAC, electrical panel, plumbing, and water heater last replaced?
- Is there a deadline driving the sale (1031 exchange, divorce, estate, relocation)? That informs how much negotiation room exists.
- Schools are D-rated, which usually means shorter tenancies and higher turnover. Who's the typical renter profile here, and what's been the actual vacancy rate?
- Crime grade is F in this area — have there been break-ins, vandalism, or insurance claims at this property in the last 3 years? What carrier currently insures it and at what premium?
- What's the average days-on-market for RENTAL listings here right now (not sales)? A rising rental-DOM trend means longer vacancies and softer asking-rent achievability than the comps imply.
- What's the recent tenant-quality profile in this submarket — average credit score on applications, eviction rate, late-payment / NSF rate, and stable-employment percentage? A property-management company in the area should have these aggregated.
- How much new for-sale + rental construction is in the pipeline within 1–3 miles? Heavy new supply typically softens prices + rents 12–24 months out; constrained supply supports both.
Investment metrics
- 1% rule
- 1.05% ✓
- Cap rate
- 8.52%
- Cash-on-cash
- 7.96%
- DSCR
- 1.35
- GRM
- 7.9
CMA / ARV
- ARV (median comp)
- $208,876
- List price
- $209,000
- Delta
- 0.06%
- Verdict
- FAIR
- Comps
- 20 within 1.0 mi
Show comp detail 12 sales within ~0.75 mi
| Address | Dist | Beds/Ba | Sqft | Sold | Price | $/sf | Match |
|---|---|---|---|---|---|---|---|
| 435 French Rd | 0.26mi | 3/1.0 | 1,279 (-7%) | 6mo | $140,000 | $109 | 69 |
| 140 Lynch Ave | 0.12mi | 3/1.0 | 1,200 (-13%) | 7mo | $191,500 | $160 | 65 |
| 121 Lynch Ave | 0.11mi | 4/1.0 (+1) | 1,560 (+13%) | 2mo | $120,000 | $77 | 64 |
| 303 French Rd | 0.40mi | 3/2.0 | 1,456 (+6%) | 7mo | $334,000 | $229 | 64 |
| 5 Patricia Ct | 0.58mi | 3/1.5 | 1,420 (+3%) | 5mo | $295,000 | $208 | 64 |
| 101 Barton St | 0.32mi | 4/1.5 (+1) | 1,560 (+13%) | 7mo | $185,000 | $119 | 52 |
| 134 Roosevelt Dr | 0.40mi | 3/1.5 | 1,184 (-14%) | 8mo | $213,000 | $180 | 52 |
| 412 Rugby Rd | 0.35mi | 3/1.0 | 1,174 (-15%) | 7mo | $155,000 | $132 | 52 |
| 424 Rugby Rd | 0.35mi | 4/1.0 (+1) | 1,176 (-15%) | 2mo | $175,000 | $149 | 50 |
| 912 Symonds Pl | 0.75mi | 3/2.0 | 1,296 (-6%) | 8mo | $180,000 | $139 | 46 |
| 2803 Ogden Pl | 0.66mi | 3/1.5 | 1,568 (+14%) | 2mo | $265,000 | $169 | 45 |
| 124 Richardson Ave | 0.59mi | 3/1.5 | 1,568 (+14%) | 6mo | $210,000 | $134 | 44 |
Match score weights: distance 35% · size 25% · config 20% · recency 20%. Top-matched comps best support the ARV.
Projected returns pro-forma
-3.0% appreciation · 3.0% rent growth · sell at horizon
- IRR
- -4.2%
- Equity multiple
- 0.84×
- Total profit
- $-9,167
- Equity at exit
- $31,163
- IRR
- 5.5%
- Equity multiple
- 1.41×
- Total profit
- $23,756
- Equity at exit
- $18,071
Cash invested: $58,520 (down + closing). Projections, not guarantees.
Landlord ↔ Tenant lean methodology
- Overall (STATE)
- 15 Strongly Tenant-Friendly
- State New York
- 15 Strongly Tenant-Friendly · D+10
- County
- — inherits STATE
- City
- — inherits STATE
ZIP-level market 13502
- Home prices YoY
- -12.1%
- Active inventory
- 150
- Price-to-rent
- 7.9×
Monthly cashflow live
- Estimated rent
- $2,202 high interval (Pro) →
- Mortgage (P&I)
- −$1,096
- Tax from tax record
- −$168 /mo · $2,021/yr
- Insurance
- −$87
- HOA
- −$0
- Vacancy / Maint / Mgmt
- −$462
- Net cashflow
- $388
Break-even live
UW: 25.0% down · 7.5% · 30yr · 1.5% tax · 5.0% vac · 8.0% maint · 8.0% mgmt
Financing live
Cash to close
- Down payment
- $52,250
- Closing costs
- $6,270
- Reserves months
- —
- Total cash needed
- —
Loan-product check · same deal, 3 products live
Conventional
25% down · 7.5% · 30yr
- Down + closing
- —
- Monthly P&I
- —
- Monthly cashflow
- —
- DSCR
- —
- Eligible?
- —
Personal DTI + credit; lowest rate.
DSCR
20% down · 8.5% · 30yr
- Down + closing
- —
- Monthly P&I
- —
- Monthly cashflow
- —
- DSCR
- —
- Eligible?
- —
No personal income docs; deal must DSCR.
Hard money
10% down · 12.0% · 12mo
- Down + closing
- —
- Monthly P&I
- —
- Monthly cashflow
- —
- DSCR
- —
- Eligible?
- —
Short-term bridge; refi at stabilization.
Rent comps 5 comps
| Address | Beds | Baths | Sqft | Rent | $/sqft | DOM | Units | Dist |
|---|---|---|---|---|---|---|---|---|
| 225 Thieme Pl Utica, NY | 3.0 | 2.0 | 1872 | $2,150 | $1.15 | 43d | 1 | 0.51mi |
| 1503 Fox Pl Utica, NY | 3.0 | 1.0 | 1119 | $2,000 | $1.79 | 43d | 1 | 0.85mi |
| 11 Sanger Ave New Hartford, NY | 3.0 | 2.5 | 1852 | $3,750 | $2.02 | 43d | 1 | 1.14mi |
| 1804 Storrs Ave Utica, NY | 3.0 | 1.5 | 1633 | $3,000 | $1.84 | 43d | 1 | 1.22mi |
| 77 Clinton St New York Mills, NY | 2.0 | 1.0 | 777 | $1,450 | $1.86 | 43d | 7 | 1.32mi |
Listing history 9 events
-
2026-06-03status $209,000 Pending 24 DOM
-
2026-06-02days on market $209,000 Active 24 DOM
-
2026-06-01days on market $209,000 Active 23 DOM
-
2026-05-31days on market $209,000 Active 22 DOM
-
2026-05-30days on market $209,000 Active 21 DOM
-
2026-05-09$229,000 Active 843-char remark
-
2006-05-16soldstatus $82,400
-
2000-01-24soldstatus $71,000
-
1993-03-26soldstatus $40,000
ⓘ Source: listings_history table (triggers on properties + properties_extension) + one-shot
backfill from property_details.listing_events for pre-trigger history.
Tax reassessment forecast NY · Partial reset (capped growth)
- Current annual tax
- $2,021 · $168/mo
- Projected year-2 tax
- $2,776 · $231/mo
- Expected delta
- +$756/yr (+$63/mo · 37.4%)
ⓘ Screening estimate from a state-policy table — verify with the county assessor before closing.
Climate risk First Street
- Flood 1/10 Low FEMA zone X (unshaded) · 0% chance over 30 yrs
- Wildfire 3/10 Moderate
- Heat 3/10 Moderate 7 d/yr ≥95°F today · 17 d/yr by 30 yrs out
- Wind 1/10 Low 100% chance of damaging wind over 30 yrs
- Air quality 2/10 Low 0 unhealthy d/yr today · 2 by 30 yrs out
Nearby sold comps map
Loading sold comps map…
Walkable amenities ~0.75 mi
Loading nearby amenities…
Taxation est. · year 1
- Rental income
- $26,425
- − Mortgage interest
- −$11,707
- − Property taxes
- −$2,021
- − Insurance
- −$1,045
- − Repairs & maintenance
- −$2,114
- − Management
- −$2,114
- − Depreciation
- −$6,080
- Taxable income
- $1,344
- Est. tax owed @ 24.0%
- −$323
- After-tax cash flow
- $4,336/yr
For passive investors: Depreciation is non-cash, so a rental often shows a tax loss while cash-flowing — sheltering income. Rental losses are passive: they offset passive income freely, and up to $25,000/yr can offset ordinary (W-2) income if you actively participate and your MAGI is under $100k (phasing out to $0 by $150k); unused losses carry forward. On sale, claimed depreciation is recaptured at up to 25%, and gains may owe capital-gains tax (a 1031 exchange can defer both). Figures are a year-1 estimate at your 24.0% rate — not tax advice; consult a CPA.
Schools (NCES district)
- District
- Utica City School District
- NCES district ID
- 3629370
- Math proficiency
- 33% ▼ -7.00%
- Reading proficiency
- 38% ▲ 2.00%
- Median HH income
- $31,834
- Composite
- 29.01/100
- National rank
- #6613
- State rank
- #562 of 590 in NY
Livability — Utica
- Score
- 80/100
- State rank
- #104
- US rank
- #1589
Category grades
Schools grade is shown separately in the Schools card above.
Census & demographics
- Census place
- Utica, NY
- County
- Oneida County · 89,710 people
- City population
- 72,968
- Metro
- Utica-Rome, NY
- Population (ZIP)
- 34,037
- Household income
- $57,835
- Rent vs Own
- Severe rent burden
- 1604.0
Population outlook (Oneida County) Hauer SSP2
- Today (2025)
- 225,223 people
- By 2030
- 220,384 · -2.1%
- By 2040
- 209,071 · -7.2%
- By 2050
- 197,920 · -12.1%
- By 2075
- 175,541 · -22.1%
- By 2100
- 148,491 · -34.1%
Race, ethnicity, and origin ACS 2023
- Neighborhood character
- Predominantly White (71%)
- Race & ethnicity
- White 71% Hispanic / Latino 11% Black 9% Two or more races 7% Asian 5%
- Hispanic origin (detail)
- Mexican 2% Puerto Rican 5% Dominican 2%
- Common ancestry
- Romanian 11% Lithuanian 3% American 2%
- Foreign-born
- 12% · Canada, Philippines, China
- Languages at home
- 81% English-only · Spanish 7% Russian/Polish/Slavic 4% Other Asian/Pacific 3%
Political lean MEDSL · Oneida
- 2024 margin
- Strong R (+21.3) · D 39.4% · R 60.6%
- 2008→2024 swing
- -15.2pp toward R · 2008: -6.1pp · 2024: -21.3pp
- All cycles
- 2024: R+21.3 2020: R+15.5 2016: R+21.1 2012: R+5.3 2008: R+6.1
Not yet ingested
- Civics
- —
Market trends
- HPI YoY
- ▼ -50.76%
- Current HPI
- 368.3955
- Rent YoY
- —
- Metro
- Utica-Rome, NY
- State GDP YoY
- ▲ 2.60%
- F500 in state
- 92
Industry mix (Fortune 500 HQ in NY)
| Industry | F500 HQs | Revenue |
|---|---|---|
| Financial Services | 10 | $950B |
|
||
| Consumer Goods | 9 | $162B |
|
||
| Insurance | 4 | $225B |
|
||
| Telecommunications | 2 | $144B |
|
||
| Pharmaceuticals | 2 | $112B |
|
||
| Media / Entertainment | 2 | $69B |
|
||
Price history
+422.5% since first listed6 events — show timeline
- 2026-06-02 Pending — CNYIS
- 2026-05-27 Price Changed $209,000 CNYIS
- 2026-05-09 Listed $229,000 CNYIS
- 2006-05-16 Sold (Public Records) $82,400 Public Records
- 2000-01-24 Sold (Public Records) $71,000 Public Records
- 1993-03-26 Sold (Public Records) $40,000 Public Records
Property tax history
+2.5%/yrLatest (2025): $2,021 · +9.0% YoY. Source: county tax records.
Cash-flow waterfall
monthlySold comps — $/sqft
last 12 mo · ≤1 miLoading sold comps…