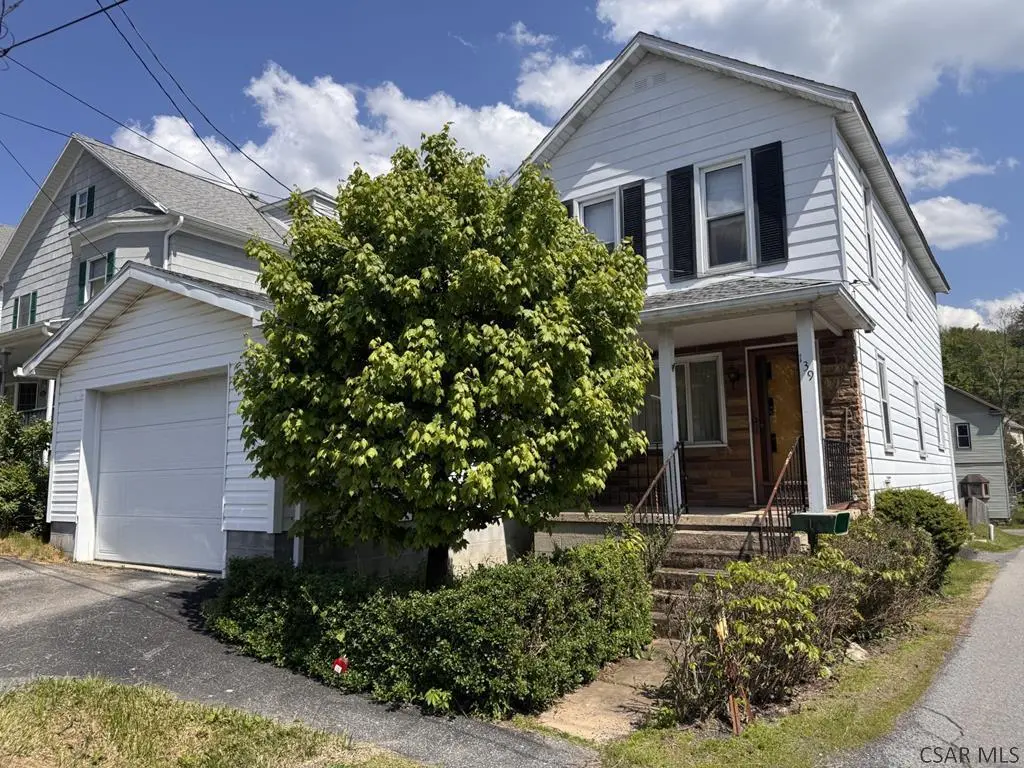
139 Reed St · Elmora, PA
Flood risk 1/10 · Minimal
- FEMA flood zone
- X (unshaded)
- Chance of flooding over 30 yrs
- 0.0%
- Est. flood insurance / yr
- $473 – $860
Fire risk 3/10 · Minor
- Est. fire insurance / yr
- $511 – $949
Heat risk 3/10 · Minor
- Hot days now (above 89°F)
- 7 days/yr
- Hot days in 30 yrs
- 19 days/yr
Wind risk 2/10 · Minimal
- Chance of severe wind over 30 yrs
- —
Air-quality risk 2/10 · Minimal
- Unhealthy air days now
- 1 days/yr
- Unhealthy air days in 30 yrs
- 3 days/yr
Risk factors via First Street. Map © Google.
Why this score? — see what drove the B grade
The composite is a weighted blend of 9 inputs, each scored 0–100. Each bar is that input's sub-score; the figure is the points it added to the 100-point composite (weight × sub-score).
- Cash flow +30.0/30.0
- 1% rule +10.0/10.0
- DSCR +10.0/10.0
- ARV discount +7.5/15.0
- Appreciation +5.0/10.0
- Schools +3.8/10.0
- Rent growth +2.5/5.0
- Livability +2.5/5.0
- Condition / age +2.5/5.0
$54,900
🖨 Deal sheet 📄 Offer letter ✓ Due diligence
Listing remarks MLS
2 story 2 Bedroom, 1 3/4 bath home on level corner lot. Eat-in kitchen, LR, DR, and 3/4 bath on first floor. 2 BR's and full bath on second floor. New furnace in December, 2025. Mini Split. 1 Car Attached garage & older storage garage at the rear of property. Side porch with ADA ramp for easy access. Priced to sell!
Key facts
- New furnace
- Eat-in kitchen
- Side porch
Tags
Property features AI
Finance
- Financial info: Annual tax amount reported
Exterior
- Parking: Attached garage (1 car)
- Utilities: Public water; Public sewer; Sewer available
- Home design: Single-family residence; Two-story home
- Construction: Aluminum siding exterior; Shingle roof
- Exterior features: Shingle roof; Aluminum siding; Residential zoning; Lot approximately 30 x 144 (0.09 acres)
Interior
- Bathrooms: 2 full bathrooms
- Heating & cooling: Baseboard heating; Hot water heating; Oil heating
- Interior features: Baseboard and hot water heating with oil fuel
Neighborhood map
What this means for you Summary
Snapshot
- This is a 2-bed/2.0-bath single-family listed at $55k.
Deal economics
- At list price, monthly cash flow is $469 ($6k/yr) — positive.
- The deal already cash-flows at list — no discount required.
- Meets the 1% rule at list price ($1k rent vs $55k).
Location & tenants
- Location reads: area grade B — affects rentability + tenant quality, not the cash-flow math above.
- Cambria Heights SD (rural): math 27% / reading 63% proficiency, ranked #280 of 539 in PA (top 52%) — families likely to look elsewhere, expect single-tenant / working-renter base with shorter leases.
- Market conditions: 3 active listings in the ZIP; 64 units permitted in Cambria County in 2024 (0 in 5+ unit buildings).
Forward outlook
- In year one you build about $2k of equity ($380 loan paydown + $2k appreciation (3.0% local appreciation)).
- Cambria County population projected at -28% by 2050 — secular population decline; favor cash flow + early exit over multi-decade hold.
- At projected returns (3.0% appreciation + 3.0% rent growth), your $15k cash investment doubles in ~2 years — after that, you're playing with house money.
Negotiation context
- Only 1 days on market — expect competitive offers; lowballing is unlikely to land.
- 2 sale attempts with the ask held roughly flat each time — persistent listings suggest the price (not the market) is what's stuck; bring a comps-based counter.
Questions for the listing agent
- Is there a deadline driving the sale (1031 exchange, divorce, estate, relocation)? That informs how much negotiation room exists.
- What's the average days-on-market for RENTAL listings here right now (not sales)? A rising rental-DOM trend means longer vacancies and softer asking-rent achievability than the comps imply.
- What's the recent tenant-quality profile in this submarket — average credit score on applications, eviction rate, late-payment / NSF rate, and stable-employment percentage? A property-management company in the area should have these aggregated.
- How much new for-sale + rental construction is in the pipeline within 1–3 miles? Heavy new supply typically softens prices + rents 12–24 months out; constrained supply supports both.
Investment metrics
- 1% rule
- 1.92% ✓
- Cap rate
- 16.54%
- Cash-on-cash
- 36.59%
- DSCR
- 2.63
- GRM
- 4.3
CMA / ARV
No comps found within radius.
Projected returns pro-forma
3.0% appreciation · 3.0% rent growth · sell at horizon
- IRR
- 42.2%
- Equity multiple
- 3.37×
- Total profit
- $36,474
- Equity at exit
- $24,685
- IRR
- 42.1%
- Equity multiple
- 6.73×
- Total profit
- $88,021
- Equity at exit
- $38,043
Cash invested: $15,372 (down + closing). Projections, not guarantees.
Landlord ↔ Tenant lean methodology
- Overall (STATE)
- 62 Landlord-Friendly
- State Pennsylvania
- 62 Landlord-Friendly · EVEN
- County
- — inherits STATE
- City
- — inherits STATE
ZIP-level market 15737
- Active inventory
- 3
- Price-to-rent
- 4.3×
Monthly cashflow live
- Estimated rent
- $1,054 medium interval (Pro) →
- Mortgage (P&I)
- −$288
- Tax from tax record
- −$53 /mo · $636/yr
- Insurance
- −$23
- HOA
- −$0
- Vacancy / Maint / Mgmt
- −$221
- Net cashflow
- $469
Break-even live
UW: 25.0% down · 7.5% · 30yr · 1.5% tax · 5.0% vac · 8.0% maint · 8.0% mgmt
Financing live
Cash to close
- Down payment
- $13,725
- Closing costs
- $1,647
- Reserves months
- —
- Total cash needed
- —
Loan-product check · same deal, 3 products live
Conventional
25% down · 7.5% · 30yr
- Down + closing
- —
- Monthly P&I
- —
- Monthly cashflow
- —
- DSCR
- —
- Eligible?
- —
Personal DTI + credit; lowest rate.
DSCR
20% down · 8.5% · 30yr
- Down + closing
- —
- Monthly P&I
- —
- Monthly cashflow
- —
- DSCR
- —
- Eligible?
- —
No personal income docs; deal must DSCR.
Hard money
10% down · 12.0% · 12mo
- Down + closing
- —
- Monthly P&I
- —
- Monthly cashflow
- —
- DSCR
- —
- Eligible?
- —
Short-term bridge; refi at stabilization.
Listing history 4 events
-
2026-05-22status Pending 324-char remark
Show marketing remark (324 chars)
2 story 2 Bedroom, 1 3/4 bath home on level corner lot. Eat-in kitchen, LR, DR, and 3/4 bath on first floor. 2 BR's and full bath on second floor. New furnace in December, 2025. Mini Split. 1 Car Attached garage & older storage garage at the rear of property. Side porch with ADA ramp for easy access. Priced to sell!
-
2026-05-22status Pending
Show marketing remark (324 chars)
2 story 2 Bedroom, 1 3/4 bath home on level corner lot. Eat-in kitchen, LR, DR, and 3/4 bath on first floor. 2 BR's and full bath on second floor. New furnace in December, 2025. Mini Split. 1 Car Attached garage & older storage garage at the rear of property. Side porch with ADA ramp for easy access. Priced to sell!
-
2026-05-19$54,900 Active
-
2026-05-18$54,900 Active 324-char remark
Show marketing remark (324 chars)
2 story 2 Bedroom, 1 3/4 bath home on level corner lot. Eat-in kitchen, LR, DR, and 3/4 bath on first floor. 2 BR's and full bath on second floor. New furnace in December, 2025. Mini Split. 1 Car Attached garage & older storage garage at the rear of property. Side porch with ADA ramp for easy access. Priced to sell!
ⓘ Source: listings_history table (triggers on properties + properties_extension) + one-shot
backfill from property_details.listing_events for pre-trigger history.
Tax reassessment forecast PA · Partial reset (capped growth)
- Current annual tax
- $636 · $53/mo
- Projected year-2 tax
- $752 · $63/mo
- Expected delta
- +$116/yr (+$10/mo · 18.2%)
ⓘ Screening estimate from a state-policy table — verify with the county assessor before closing.
Climate risk First Street
- Flood 1/10 Low FEMA zone X (unshaded) · 0% chance over 30 yrs
- Wildfire 3/10 Moderate
- Heat 3/10 Moderate 7 d/yr ≥89°F today · 19 d/yr by 30 yrs out
- Wind 2/10 Low
- Air quality 2/10 Low 1 unhealthy d/yr today · 3 by 30 yrs out
Nearby sold comps map
Loading sold comps map…
Walkable amenities ~0.75 mi
Loading nearby amenities…
Taxation est. · year 1
- Rental income
- $12,645
- − Mortgage interest
- −$3,075
- − Property taxes
- −$636
- − Insurance
- −$274
- − Repairs & maintenance
- −$1,012
- − Management
- −$1,012
- − Depreciation
- −$1,597
- Taxable income
- $5,040
- Est. tax owed @ 24.0%
- −$1,209
- After-tax cash flow
- $4,415/yr
For passive investors: Depreciation is non-cash, so a rental often shows a tax loss while cash-flowing — sheltering income. Rental losses are passive: they offset passive income freely, and up to $25,000/yr can offset ordinary (W-2) income if you actively participate and your MAGI is under $100k (phasing out to $0 by $150k); unused losses carry forward. On sale, claimed depreciation is recaptured at up to 25%, and gains may owe capital-gains tax (a 1031 exchange can defer both). Figures are a year-1 estimate at your 24.0% rate — not tax advice; consult a CPA.
Schools (NCES district)
- District
- Cambria Heights SD
- NCES district ID
- 4204740
- Math proficiency
- 27% ▼ -15.00%
- Reading proficiency
- 63% ▼ -11.00%
- Median HH income
- $44,855
- Composite
- 38.0/100
- National rank
- #4291
- State rank
- #280 of 539 in PA
Livability — Elmora
No livability data for this city. (Only ~50 U.S. cities are tracked.)
Census & demographics
- Census place
- Elmora, PA
- City population
- 110
- Population (ZIP)
- 110
Population outlook (Cambria County) Hauer SSP2
- Today (2025)
- 122,754 people
- By 2030
- 115,827 · -5.6%
- By 2040
- 101,309 · -17.5%
- By 2050
- 88,379 · -28.0%
- By 2075
- 65,237 · -46.9%
- By 2100
- 46,909 · -61.8%
Race, ethnicity, and origin ACS 2023
- Neighborhood character
- Predominantly White (100%)
- Race & ethnicity
- White 100%
- Common ancestry
- Romanian 23% Hungarian 1%
Political lean MEDSL · Cambria
- 2024 margin
- Solid R (+39.7) · D 29.8% · R 69.5%
- 2008→2024 swing
- -40.4pp toward R · 2008: 0.7pp · 2024: -39.7pp
- All cycles
- 2024: R+39.7 2020: R+37.3 2016: R+37.8 2012: R+17.8 2008: D+0.7
Not yet ingested
- Civics
- —
Market trends
- HPI YoY
- —
- Current HPI
- —
- Rent YoY
- —
- Metro
- —
- State GDP YoY
- ▲ 1.68%
- F500 in state
- 34
Industry mix (Fortune 500 HQ in PA)
| Industry | F500 HQs | Revenue |
|---|---|---|
| Healthcare | 2 | $309B |
|
||
| Insurance | 2 | $27B |
|
||
| Telecommunications / Media | 1 | $124B |
|
||
| Industrial Distribution | 1 | $22B |
|
||
| Financial Services | 1 | $20B |
|
||
| Chemicals / Materials | 1 | $18B |
|
||
Price history
+0.0% since first listed4 events — show timeline
- 2026-05-22 Pending — AHARMLS
- 2026-05-22 Pending — CSMLS
- 2026-05-19 Listed $54,900 CSMLS
- 2026-05-18 Listed $54,900 AHARMLS
Property tax history
+1.4%/yrLatest (2026): $636 · +3.7% YoY. Source: county tax records.
Cash-flow waterfall
monthlySold comps — $/sqft
last 12 mo · ≤1 miLoading sold comps…