78 Evans Ave · Trenton, NJ
Flood risk 1/10 · Minimal
- FEMA flood zone
- X (unshaded)
- Chance of flooding over 30 yrs
- 0.0%
- Est. flood insurance / yr
- $507 – $1,088
Fire risk 1/10 · Minimal
- Est. fire insurance / yr
- $526 – $976
Heat risk 7/10 · Major
- Hot days now (above 102°F)
- 7 days/yr
- Hot days in 30 yrs
- 15 days/yr
Wind risk 6/10 · Moderate
- Chance of severe wind over 30 yrs
- 27.0%
Air-quality risk 5/10 · Moderate
- Unhealthy air days now
- 6 days/yr
- Unhealthy air days in 30 yrs
- 8 days/yr
Risk factors via First Street. Map © Google.
Why this score? — see what drove the B- grade
The composite is a weighted blend of 9 inputs, each scored 0–100. Each bar is that input's sub-score; the figure is the points it added to the 100-point composite (weight × sub-score).
- Cash flow +25.2/30.0
- ARV discount +15.0/15.0
- DSCR +8.3/10.0
- 1% rule +6.3/10.0
- Livability +3.8/5.0
- Rent growth +3.3/5.0
- Condition / age +2.5/5.0
- Schools +0.7/10.0
- Appreciation +0.0/10.0
$200,000
🖨 Deal sheet 📄 Offer letter ✓ Due diligence
Listing remarks
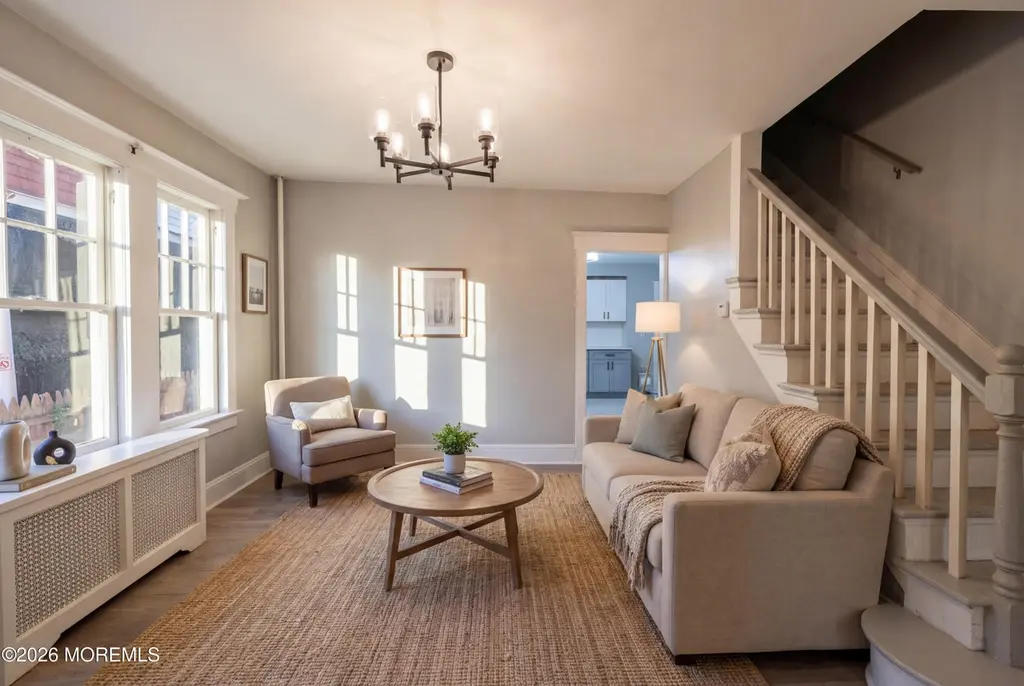
Welcome to 78 Evans Ave, a beautifully maintained 3-bedroom, 2-bath home located on a charming residential street in Trenton. This inviting property features a warm and welcoming front porch, perfect for relaxing and enjoying the neighborhood. Step inside to a bright and airy living space with abundant natural light, neutral tones, and a comfortable layout ideal for both everyday living and entertaining. The home offers a spacious living room, a well-appointed kitchen, and generously sized bedrooms. The property also features a private backyard and a well-kept exterior, along with great curb appeal highlighted by its distinctive red façade. Conveniently located near local amenities,
Key facts
- Well-kept exterior
- Private backyard
- 2,178 sq ft lot
Tags
Property features AI
Exterior
- Parking: No garage
- Utilities: Public sewer
- Home design: Single-family property (living area approximately 1328); Located in Chambersburg / Trenton area
- Exterior features: Shingle roof
Interior
- Bedrooms: 3 bedrooms
- Bathrooms: 2 full bathrooms
- Heating & cooling: Heating present; Cooling present (other type)
- Interior features: No fireplaces reported; Unfinished basement
Neighborhood map
What this means for you Summary
Snapshot
- This is a 3-bed/2.0-bath single-family listed at $200k.
Deal economics
- At list price, monthly cash flow is $446 ($5k/yr) — positive.
- The deal already cash-flows at list — no discount required.
- Meets the 1% rule at list price ($2k rent vs $200k).
- Recommended offer: $194k (3.0% below list) — sets the bar for market timing.
- Cap rate 9.0% vs local median 6.3% in Trenton — top-decile yield for the area; either an underpriced asset or a hidden risk that comps aren't pricing in. Stress-test before assuming the spread holds.
Location & tenants
- Location reads 76/100 on livability (#133 in NJ, #3,533 nationally) — a middle-class / working-renter tenant base. Strengths: amenities A+, commute A+, health & safety A+; Watch: schools F, crime F, employment F.
- Trenton Public School District (urban): math 2% / reading 16% proficiency, ranked #471 of 472 in NJ (top 100%) — low school quality limits family demand, transient renter base, plan for 1-2y turnover; 80% free/reduced lunch — lower-income household profile, screen leases tightly.
- Market conditions: Rents rising (+3.3%/yr); 83 active listings in the ZIP; 37 comparable units currently listed for rent nearby; rentals at typical pace (median 22d on market — plan ~3-4 weeks tenant-placement turnaround); 2,256 units permitted in Mercer County in 2024 (1,303 in 5+ unit buildings).
- This rent runs 40% of the median local income ($67k/yr) — at the standard rent-burdened threshold; future hikes will face affordability resistance.
Forward outlook
- Local home prices are declining (-3.0%/yr); year-one equity from $1k of loan paydown is wiped out by about $6k of value loss. Plan a longer hold.
- Mercer County population projected at +4% by 2050 — modest demand growth; plan on rents tracking national, not racing it.
Negotiation context
- It's been on market 56 days — a 3% lower offer ($194k) is reasonable based on typical stale-listing flexibility.
- 4 sale attempts with the ask held roughly flat each time — persistent listings suggest the price (not the market) is what's stuck; bring a comps-based counter.
- Current owner paid $9k; list at $200k implies a 2122% gain — meaningful room to come down on a strong offer.
Risks & watch-outs
- Watch-outs: built in 1920 — expect roof / HVAC / electrical / plumbing capex.
- Climate carrying-cost: major wind risk, 27% chance of damaging wind over 30y; extreme-heat days projected 7→15/yr by 2055 (HVAC capex compounding) — expect insurance premiums to compound above CPI over the hold.
Questions for the listing agent
- It's been on market 56 days. Have you received any prior offers? Is the seller open to a 3% concession, seller financing, or rate buy-down credit?
- Built in 1920 — when were the roof, HVAC, electrical panel, plumbing, and water heater last replaced?
- Is there a deadline driving the sale (1031 exchange, divorce, estate, relocation)? That informs how much negotiation room exists.
- Schools are F-rated, which usually means shorter tenancies and higher turnover. Who's the typical renter profile here, and what's been the actual vacancy rate?
- Crime grade is F in this area — have there been break-ins, vandalism, or insurance claims at this property in the last 3 years? What carrier currently insures it and at what premium?
- What's the average days-on-market for RENTAL listings here right now (not sales)? A rising rental-DOM trend means longer vacancies and softer asking-rent achievability than the comps imply.
- What's the recent tenant-quality profile in this submarket — average credit score on applications, eviction rate, late-payment / NSF rate, and stable-employment percentage? A property-management company in the area should have these aggregated.
- How much new for-sale + rental construction is in the pipeline within 1–3 miles? Heavy new supply typically softens prices + rents 12–24 months out; constrained supply supports both.
Investment metrics
- 1% rule
- 1.13% ✓
- Cap rate
- 8.97%
- Cash-on-cash
- 9.55%
- DSCR
- 1.43
- GRM
- 7.4
CMA / ARV
- ARV (on-the-fly)
- $253,648
- Comps found
- 8
Show comp detail 8 sales within ~0.75 mi
| Address | Dist | Beds/Ba | Sqft | Sold | Price | $/sf | Match |
|---|---|---|---|---|---|---|---|
| 18 Dexter St | 0.23mi | 3/1.0 | 1,200 (-10%) | 1mo | $139,000 | $116 | 69 |
| 42 E Paul Ave | 0.20mi | 4/1.5 (+1) | 1,443 (+9%) | 11mo | $275,000 | $191 | 60 |
| 417 N Montgomery St | 0.55mi | 4/2.0 (+1) | 1,401 (+6%) | 2mo | $250,000 | $178 | 58 |
| 27--29-31 Kelsey | 0.71mi | 4/1.0 (+1) | 1,365 (+3%) | 4mo | $150,000 | $110 | 49 |
| 118 Hazel | 0.66mi | 4/1.0 (+1) | 1,399 (+5%) | 8mo | $340,000 | $243 | 45 |
| 133 Robbins Ave | 0.65mi | 3/2.5 | 1,176 (-11%) | 6mo | $370,000 | $315 | 44 |
| 9 Borden Way | 0.64mi | 3/2.5 | 1,485 (+12%) | 19mo | $255,000 | $172 | 33 |
| 801 Spruce St | 0.69mi | 2/2.0 (-1) | 1,509 (+14%) | 10mo | $310,000 | $205 | 31 |
Match score weights: distance 35% · size 25% · config 20% · recency 20%. Top-matched comps best support the ARV.
Projected returns pro-forma
-3.0% appreciation · 3.31% rent growth · sell at horizon
- IRR
- -1.6%
- Equity multiple
- 0.94×
- Total profit
- $-3,299
- Equity at exit
- $29,821
- IRR
- 8.5%
- Equity multiple
- 1.65×
- Total profit
- $36,633
- Equity at exit
- $17,292
Cash invested: $56,000 (down + closing). Projections, not guarantees.
Landlord ↔ Tenant lean methodology
- Overall (STATE)
- 21 Tenant-Leaning
- State New Jersey
- 21 Tenant-Leaning · D+6
- County
- — inherits STATE
- City
- — inherits STATE
ZIP-level market 08638
- Rents YoY
- 3.3%
- Active inventory
- 83
- Price-to-rent
- 7.4×
Monthly cashflow live
- Estimated rent
- $2,256 high interval (Pro) →
- Mortgage (P&I)
- −$1,049
- Tax from tax record
- −$204 /mo · $2,450/yr
- Insurance
- −$83
- HOA
- −$0
- Vacancy / Maint / Mgmt
- −$474
- Net cashflow
- $446
Break-even live
UW: 25.0% down · 7.5% · 30yr · 1.5% tax · 5.0% vac · 8.0% maint · 8.0% mgmt
Financing live
Cash to close
- Down payment
- $50,000
- Closing costs
- $6,000
- Reserves months
- —
- Total cash needed
- —
Loan-product check · same deal, 3 products live
Conventional
25% down · 7.5% · 30yr
- Down + closing
- —
- Monthly P&I
- —
- Monthly cashflow
- —
- DSCR
- —
- Eligible?
- —
Personal DTI + credit; lowest rate.
DSCR
20% down · 8.5% · 30yr
- Down + closing
- —
- Monthly P&I
- —
- Monthly cashflow
- —
- DSCR
- —
- Eligible?
- —
No personal income docs; deal must DSCR.
Hard money
10% down · 12.0% · 12mo
- Down + closing
- —
- Monthly P&I
- —
- Monthly cashflow
- —
- DSCR
- —
- Eligible?
- —
Short-term bridge; refi at stabilization.
Rent comps 37 comps
| Address | Beds | Baths | Sqft | Rent | $/sqft | DOM | Units | Dist |
|---|---|---|---|---|---|---|---|---|
| 77 Race St Trenton, NJ | 2.0 | 1.0 | 950 | $1,700 | $1.79 | 21d | 1 | 0.04mi |
| 130 W Ingham Ave Trenton, NJ | 4.0 | 1.0 | 1126 | $2,000 | $1.78 | 14d | 1 | 0.29mi |
| 134 Old Rose St Trenton, NJ | 4.0 | 2.0 | 1212 | $2,300 | $1.90 | 21d | 1 | 0.34mi |
| 24 New Trent St Trenton, NJ | 3.0 | 2.0 | 1336 | $2,350 | $1.76 | 14d | 1 | 0.39mi |
| 1314 Princeton Ave Trenton, NJ | 4.0 | 1.0 | 1092 | $2,400 | $2.20 | 14d | 1 | 0.46mi |
| 42 Grant St Trenton, NJ | 4.0 | 1.0 | 1000 | $2,000 | $2.00 | 14d | 1 | 0.54mi |
| 34 Southard St #2 Trenton, NJ | 2.0 | 2.0 | 1808 | $2,150 | $1.19 | 21d | 1 | 0.59mi |
| 125 Olive St Trenton, NJ | 2.0–3.0 | 1.0–1.5 | 896 | $1,392 | $1.55 | 21d | 1 | 0.65mi |
| 901 Brunswick Ave #7 Trenton, NJ | 3.0 | 1.0 | 940 | $2,800 | $2.98 | 14d | 1 | 0.65mi |
| 331 Ellis Ave Trenton, NJ | 3.0 | 1.0 | 1190 | $2,275 | $1.91 | 21d | 1 | 0.69mi |
| 21 Bellevue Ave Trenton, NJ | 3.0 | 2.0 | 1740 | $2,400 | $1.38 | 44d | 1 | 0.72mi |
| 8 Belvidere St Trenton, NJ | 2.0 | 1.0 | 1260 | $1,900 | $1.51 | 21d | 1 | 0.76mi |
| 1100 Prospect St Unit 1 Ewing Township, NJ | 3.0 | 1.0 | 1100 | $2,000 | $1.82 | 21d | 1 | 0.76mi |
| 216 E State St Trenton, NJ | 1.0–2.0 | 1.0 | 811 | $1,895 | $2.34 | 14d | 2 | 0.79mi |
| 319 Rutherford Ave Trenton, NJ | 4.0 | 2.0 | 1100 | $2,200 | $2.00 | 21d | 1 | 0.88mi |
| 311 Calhoun St Trenton, NJ | 4.0 | 1.0 | 1516 | $2,400 | $1.58 | 44d | 1 | 0.89mi |
| 105 Walnut Ave Unit 1 Trenton, NJ | 2.0 | 1.0 | 1200 | $2,000 | $1.67 | 21d | 1 | 0.92mi |
| 234 Walnut Ave Trenton, NJ | 4.0 | 1.0 | 1480 | $2,200 | $1.49 | 21d | 1 | 0.92mi |
| 27 Passaic St Trenton, NJ | 2.0 | 1.0 | 900 | $1,700 | $1.89 | 21d | 1 | 0.94mi |
| 1040 Indiana Ave Trenton, NJ | 3.0 | 1.0 | 1232 | $2,950 | $2.39 | 14d | 1 | 1.00mi |
| 417 Walnut Ave Trenton, NJ | 3.0 | 1.0 | 992 | $2,050 | $2.07 | 21d | 1 | 1.02mi |
| 1165 E State St Trenton, NJ | 3.0 | 1.0 | 900 | $1,749 | $1.94 | 14d | 1 | 1.04mi |
| 307 Spring St Unit 1 Trenton, NJ | 2.0 | 1.0 | 1677 | $2,000 | $1.19 | 21d | 1 | 1.06mi |
| 307 Spring St Unit 3 Trenton, NJ | 2.0 | 1.0 | 1677 | $1,800 | $1.07 | 21d | 1 | 1.06mi |
| 307 Spring St Unit 2 Trenton, NJ | 2.0 | 1.0 | 1677 | $1,750 | $1.04 | 21d | 1 | 1.06mi |
| 186 Passaic St Trenton, NJ | 3.0 | 2.0 | 1064 | $2,400 | $2.26 | 4d | 1 | 1.06mi |
| 311 Spring St Trenton, NJ | 3.0 | 1.0 | 1200 | $2,200 | $1.83 | 14d | 1 | 1.06mi |
| 416 Klagg Ave Trenton, NJ | 3.0 | 1.0 | 1034 | $2,300 | $2.22 | 21d | 1 | 1.09mi |
| 720 Monmouth St Unit 204 Trenton, NJ | 2.0 | 1.0 | 1011 | $1,750 | $1.73 | 21d | 1 | 1.20mi |
| 600 Artisan St Trenton, NJ | 3.0 | 2.0 | 1392 | $2,650 | $1.90 | 13d | 3 | 1.21mi |
| 600 Artisan St Unit 126 Trenton, NJ | 3.0 | 2.0 | 1392 | $2,650 | $1.90 | 20d | 1 | 1.21mi |
| 239 Ardmore Ave Trenton, NJ | 4.0 | 2.0 | 1665 | $2,750 | $1.65 | 21d | 1 | 1.24mi |
| 219 Woodlawn Ave Trenton, NJ | 3.0 | 1.0 | 1456 | $2,355 | $1.62 | 14d | 1 | 1.29mi |
| 635 Chambers St Trenton, NJ | 4.0 | 2.0 | 1312 | $2,500 | $1.91 | 14d | 1 | 1.35mi |
| 71 Clark St Trenton, NJ | 1.0–2.0 | 1.0–2.0 | 975 | $2,350 | $2.41 | 14d | 4 | 1.38mi |
| 121 Columbus Ave Trenton, NJ | 3.0 | 1.0 | 1050 | $1,900 | $1.81 | 21d | 1 | 1.44mi |
| 20 N Overbrook Ave Unit B Trenton, NJ | 3.0 | 1.0 | 1518 | $2,300 | $1.52 | 13d | 1 | 1.47mi |
Listing history 24 events
-
2026-06-18days on market $200,000 Active 56 DOM
-
2026-06-17days on market $200,000 Active 55 DOM
-
2026-06-16days on market $200,000 Active 54 DOM
-
2026-06-15days on market $200,000 Active 53 DOM
-
2026-06-14days on market $200,000 Active 51 DOM
-
2026-06-10days on market $200,000 Active 48 DOM
-
2026-06-09days on market $200,000 Active 47 DOM
-
2026-06-08days on market $200,000 Active 46 DOM
-
2026-06-07days on market $200,000 Active 45 DOM
-
2026-06-03days on market $200,000 Active 41 DOM
-
2026-06-02days on market $200,000 Active 40 DOM
-
2026-06-01days on market $200,000 Active 39 DOM
-
2026-05-31days on market $200,000 Active 38 DOM
-
2026-05-30days on market $200,000 Active 37 DOM
-
2026-04-30status Active
-
2026-03-31historical
-
2026-03-24$200,000 Active
-
2026-02-28historical
-
2026-02-20price $249,990
-
2026-01-31status Active
-
2026-01-30historical
-
2026-01-26price $264,900
-
2026-01-06$274,900 Active
-
1981-02-01soldstatus $9,000
ⓘ Source: listings_history table (triggers on properties + properties_extension) + one-shot
backfill from property_details.listing_events for pre-trigger history.
Tax reassessment forecast NJ · Partial reset (capped growth)
- Current annual tax
- $2,450 · $204/mo
- Projected year-2 tax
- $3,715 · $310/mo
- Expected delta
- +$1,265/yr (+$105/mo · 51.6%)
ⓘ Screening estimate from a state-policy table — verify with the county assessor before closing.
Climate risk First Street
- Flood 1/10 Low FEMA zone X (unshaded) · 0% chance over 30 yrs
- Wildfire 1/10 Low
- Heat 7/10 Severe 7 d/yr ≥102°F today · 15 d/yr by 30 yrs out
- Wind 6/10 Major 27% chance of damaging wind over 30 yrs
- Air quality 5/10 Major 6 unhealthy d/yr today · 8 by 30 yrs out
Nearby sold comps map
Loading sold comps map…
Walkable amenities ~0.75 mi
Loading nearby amenities…
Taxation est. · year 1
- Rental income
- $27,072
- − Mortgage interest
- −$11,203
- − Property taxes
- −$2,450
- − Insurance
- −$1,000
- − Repairs & maintenance
- −$2,166
- − Management
- −$2,166
- − Depreciation
- −$5,818
- Taxable income
- $2,269
- Est. tax owed @ 24.0%
- −$544
- After-tax cash flow
- $4,806/yr
For passive investors: Depreciation is non-cash, so a rental often shows a tax loss while cash-flowing — sheltering income. Rental losses are passive: they offset passive income freely, and up to $25,000/yr can offset ordinary (W-2) income if you actively participate and your MAGI is under $100k (phasing out to $0 by $150k); unused losses carry forward. On sale, claimed depreciation is recaptured at up to 25%, and gains may owe capital-gains tax (a 1031 exchange can defer both). Figures are a year-1 estimate at your 24.0% rate — not tax advice; consult a CPA.
Schools (NCES district)
- District
- Trenton Public School District
- NCES district ID
- 3416290
- Math proficiency
- 2% ▼ -8.00%
- Reading proficiency
- 16% ▼ -4.00%
- Median HH income
- $35,078
- Composite
- 7.31/100
- National rank
- #9956
- State rank
- #471 of 472 in NJ
Livability — Trenton
- Score
- 76/100
- State rank
- #133
- US rank
- #3533
Category grades
Schools grade is shown separately in the Schools card above.
Census & demographics
- Census place
- Trenton, NJ
- County
- Mercer County · 327,655 people
- City population
- 177,819
- Metro
- Trenton-Princeton, NJ
- Population (ZIP)
- 22,816
- Household income
- $66,875
- Rent vs Own
- Severe rent burden
- 1185.0
Population outlook (Mercer County) Hauer SSP2
- Today (2025)
- 381,395 people
- By 2030
- 384,640 · +0.9%
- By 2040
- 391,431 · +2.6%
- By 2050
- 397,845 · +4.3%
- By 2075
- 417,281 · +9.4%
- By 2100
- 420,327 · +10.2%
Race, ethnicity, and origin ACS 2023
- Neighborhood character
- Diverse neighborhood (Simpson 0.68)
- Race & ethnicity
- Black 43% White 31% Hispanic / Latino 21% Two or more races 8% Asian 2%
- Hispanic origin (detail)
- Mexican 2% Puerto Rican 6% Dominican 3%
- Common ancestry
- Romanian 4% Hispanic 2% Iranian 1%
- Foreign-born
- 24% · Canada, Guatemala, China
- Languages at home
- 76% English-only · Spanish 17% Russian/Polish/Slavic 2% Other Indo-European 2%
Political lean MEDSL · Mercer
- 2024 margin
- Solid D (+33.9) · D 65.9% · R 32.0% · Other 2.1%
- 2008→2024 swing
- -2.2pp toward R · 2008: 36.1pp · 2024: 33.9pp
- All cycles
- 2024: D+33.9 2020: D+40.0 2016: D+36.2 2012: D+36.8 2008: D+36.1
Not yet ingested
- Civics
- —
Market trends
- HPI YoY
- ▼ -286.00%
- Current HPI
- 334.5143
- Rent YoY
- ▲ 3.31%
- Metro
- Trenton-Princeton, NJ
- State GDP YoY
- ▲ 2.05%
- F500 in state
- 34
Industry mix (Fortune 500 HQ in NJ)
| Industry | F500 HQs | Revenue |
|---|---|---|
| Consumer Goods | 3 | $31B |
|
||
| Pharmaceuticals | 2 | $153B |
|
||
| Technology | 2 | $21B |
|
||
| Insurance | 2 | $20B |
|
||
| Healthcare | 2 | $19B |
|
||
| Financial Services | 1 | $70B |
|
||
Price history
+2122.2% since first listed10 events — show timeline
- 2026-04-30 Relisted — MOMLS
- 2026-03-31 Delisted — MOMLS
- 2026-03-24 Listed $200,000 MOMLS
- 2026-02-28 Listing Removed — BRIGHT MLS
- 2026-02-20 Price Changed $249,990 BRIGHT MLS
- 2026-01-31 Relisted — BRIGHT MLS
- 2026-01-30 Listing Removed — BRIGHT MLS
- 2026-01-26 Price Changed $264,900 BRIGHT MLS
- 2026-01-06 Listed $274,900 BRIGHT MLS
- 1981-02-01 Sold (Public Records) $9,000 Public Records
Property tax history
+3.8%/yrLatest (2025): $2,450 · +1.5% YoY. Source: county tax records.
Cash-flow waterfall
monthlySold comps — $/sqft
last 12 mo · ≤1 miLoading sold comps…