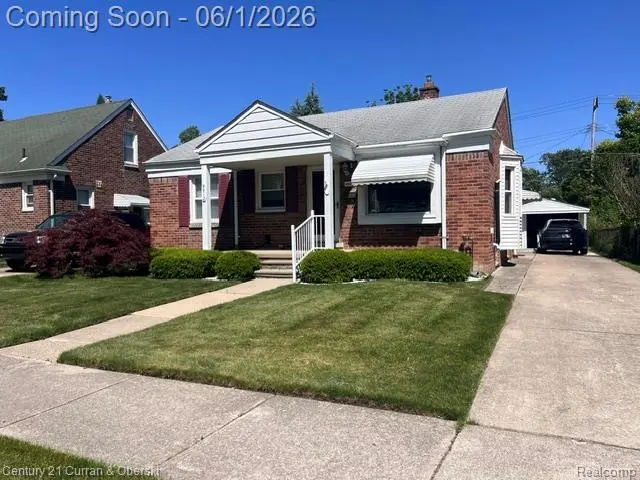
9912 Kinloch · Dearborn Heights, MI
Flood risk No data
- FEMA flood zone
- —
- Chance of flooding over 30 yrs
- —
- Est. flood insurance / yr
- —
Fire risk No data
- Est. fire insurance / yr
- —
Heat risk No data
- Hot days now (above threshold)
- —
- Hot days in 30 yrs
- —
Wind risk No data
- Chance of severe wind over 30 yrs
- —
Air-quality risk No data
- Unhealthy air days now
- —
- Unhealthy air days in 30 yrs
- —
Risk factors via First Street. Map © Google.
Why this score? — see what drove the D grade
The composite is a weighted blend of 9 inputs, each scored 0–100. Each bar is that input's sub-score; the figure is the points it added to the 100-point composite (weight × sub-score).
- Cash flow +18.9/30.0
- DSCR +6.0/10.0
- Livability +4.0/5.0
- 1% rule +3.9/10.0
- Rent growth +3.3/5.0
- Condition / age +2.5/5.0
- Schools +1.8/10.0
- ARV discount +0.0/15.0
- Appreciation +0.0/10.0
$199,000
🖨 Deal sheet 📄 Offer letter ✓ Due diligence
Listing remarks
This tenderly loved and maintained 3 bedroom BRICK RANCH in South Redford exudes the retro charm you love with a thoughtful, flexible floor plan you've been waiting for!! You will definitely appreciate its' "great bones". .. .from the classy curb appeal, to the ample living room with quaint dining alcove; to the updated kitchen, the RETRO ceramic bath, to the THREE good sized bedrooms (one of which was used previously as a FORMAL dining room). .. and, HEY! wait til you see the ADDITION. .. . it can be a PERFECT home office/music/tv/or family room and it also includes the OPTION of a first floor laundry area! The entire basement is squeaky-clean (partially finished) with VC
Key facts
- 6,098 sq ft lot
- Garage
- Built 1949
Property features AI
Finance
- Other: Pets allowed
Exterior
- Parking: Detached garage with garage door opener; Carport; Garage approximately 14 x 20; 1 space in garage
- Utilities: Public water; Natural gas; Forced air heating; Gas water heater
- Home design: Residential, 1-story home; Built in 1949; Basement present (below grade finished area noted)
- Construction: Brick and vinyl siding construction; Basement foundation
- Exterior features: Brick and vinyl siding exterior; Fenced yard; Patio; Shed; Paved street access
Interior
- Kitchen: Kitchen on entry level; Range/Oven included
- Bedrooms: Bedroom 1 (Entry level) with carpet; Bedroom 2 (Entry level) with carpet; Bedroom 3 (Entry level) with carpet
- Flooring: Carpet in living areas, family room, dining room, bedrooms, and laundry room; Vinyl in kitchen; Ceramic in bathroom
- Bathrooms: 1 full bathroom (Entry level) with ceramic floor
- Heating & cooling: Forced air heating; Natural gas heat source; Gas water heater
- Interior features: Fireplace in family room (electric); Partially finished basement
- Laundry & utility: Laundry room on entry level (9 x 7)
Neighborhood map
What this means for you Summary
Snapshot
- This is a 3-bed/1.0-bath single-family listed at $199k.
Deal economics
- At list price, monthly cash flow is $205 ($2k/yr) — positive.
- The deal already cash-flows at list — no discount required.
- To meet the 1% rule (rent ≥ 1% of price), the offer needs to be $177k (11.2% below list).
- Recommended offer: $177k (11.2% below list) — sets the bar for 1% rule.
- Cap rate 7.5% vs local median 5.5% in Dearborn Heights — top-decile yield for the area; either an underpriced asset or a hidden risk that comps aren't pricing in. Stress-test before assuming the spread holds.
Location & tenants
- Location reads 79/100 on livability (#82 in MI, #1,885 nationally) — a middle-class / working-renter tenant base. Strengths: commute A+, cost of living A+, housing A+; Watch: schools C-, crime D+, employment D+.
- South Redford School District (suburban): math 11% / reading 29% proficiency, ranked #455 of 540 in MI (top 84%) — low school quality limits family demand, transient renter base, plan for 1-2y turnover.
- Market conditions: Rents rising (+3.2%/yr); 188 active listings in the ZIP; 8 comparable units currently listed for rent nearby; rentals at typical pace (median 15d on market — plan ~3-4 weeks tenant-placement turnaround); 2,639 units permitted in Wayne County in 2024 (1,216 in 5+ unit buildings).
Forward outlook
- Local home prices are declining (-3.0%/yr); year-one equity from $1k of loan paydown is wiped out by about $6k of value loss. Plan a longer hold.
- Wayne County population projected at -17% by 2050 — secular population decline; favor cash flow + early exit over multi-decade hold.
Negotiation context
- Only 14 days on market — expect competitive offers; lowballing is unlikely to land.
Risks & watch-outs
- Watch-outs: built in 1949 — expect roof / HVAC / electrical / plumbing capex.
Questions for the listing agent
- Built in 1949 — when were the roof, HVAC, electrical panel, plumbing, and water heater last replaced?
- Is there a deadline driving the sale (1031 exchange, divorce, estate, relocation)? That informs how much negotiation room exists.
- Crime grade is D in this area — have there been break-ins, vandalism, or insurance claims at this property in the last 3 years? What carrier currently insures it and at what premium?
- The area grade is low — what's the realistic commute time and amenity access for the typical tenant pool here? Any planned neighborhood developments (good or bad) we should know about?
- What's the average days-on-market for RENTAL listings here right now (not sales)? A rising rental-DOM trend means longer vacancies and softer asking-rent achievability than the comps imply.
- What's the recent tenant-quality profile in this submarket — average credit score on applications, eviction rate, late-payment / NSF rate, and stable-employment percentage? A property-management company in the area should have these aggregated.
- How much new for-sale + rental construction is in the pipeline within 1–3 miles? Heavy new supply typically softens prices + rents 12–24 months out; constrained supply supports both.
Investment metrics
- 1% rule
- 0.89% ✗
- Cap rate
- 7.53%
- Cash-on-cash
- 4.41%
- DSCR
- 1.20
- GRM
- 9.4
CMA / ARV
- ARV (on-the-fly)
- $165,760
- Comps found
- 12
Show comp detail 12 sales within ~0.75 mi
| Address | Dist | Beds/Ba | Sqft | Sold | Price | $/sf | Match |
|---|---|---|---|---|---|---|---|
| 9636 Centralia | 0.19mi | 3/1.0 | 1,043 (+1%) | 4mo | $135,000 | $129 | 87 |
| 9983 Hemingway | 0.28mi | 3/1.0 | 1,059 (+2%) | 3mo | $149,000 | $141 | 81 |
| 9624 Nathaline | 0.37mi | 3/1.0 | 1,019 (-2%) | 3mo | $209,000 | $205 | 78 |
| 9960 Rockland | 0.07mi | 3/2.0 | 937 (-10%) | 2mo | $150,000 | $160 | 75 |
| 11757 Eileen | 0.52mi | 3/1.0 | 1,040 (+0%) | 0mo | $220,000 | $212 | 75 |
| 9010 Leverne | 0.58mi | 3/1.0 | 1,020 (-2%) | 2mo | $220,000 | $216 | 69 |
| 11748 Leverne | 0.49mi | 3/1.5 | 1,075 (+4%) | 4mo | $142,000 | $132 | 65 |
| 9560 Nathaline | 0.39mi | 4/1.5 (+1) | 1,125 (+9%) | 1mo | $142,500 | $127 | 60 |
| 9656 Sioux | 0.48mi | 4/1.0 (+1) | 1,116 (+8%) | 2mo | $147,500 | $132 | 58 |
| 9130 Kinloch | 0.43mi | 3/1.5 | 1,144 (+10%) | 3mo | $123,000 | $108 | 58 |
| 9648 Nathaline Ave | 0.36mi | 3/1.0 | 894 (-14%) | 4mo | $145,000 | $162 | 57 |
| 11756 Berwyn | 0.48mi | 2/1.5 (-1) | 930 (-10%) | 2mo | $167,500 | $180 | 52 |
Match score weights: distance 35% · size 25% · config 20% · recency 20%. Top-matched comps best support the ARV.
Projected returns pro-forma
-3.0% appreciation · 3.25% rent growth · sell at horizon
- IRR
- -9.2%
- Equity multiple
- 0.66×
- Total profit
- $-18,835
- Equity at exit
- $29,672
- IRR
- 0.5%
- Equity multiple
- 1.03×
- Total profit
- $1,892
- Equity at exit
- $17,206
Cash invested: $55,720 (down + closing). Projections, not guarantees.
Landlord ↔ Tenant lean methodology
- Overall (STATE)
- 62 Landlord-Friendly
- State Michigan
- 62 Landlord-Friendly · EVEN
- County
- — inherits STATE
- City
- — inherits STATE
ZIP-level market 48239
- Rents YoY
- 3.2%
- Active inventory
- 188
- Price-to-rent
- 9.4×
Monthly cashflow live
- Estimated rent
- $1,767 high interval (Pro) →
- Mortgage (P&I)
- −$1,044
- Tax from tax record
- −$64 /mo · $771/yr
- Insurance
- −$83
- HOA
- −$0
- Vacancy / Maint / Mgmt
- −$371
- Net cashflow
- $205
Break-even live
UW: 25.0% down · 7.5% · 30yr · 1.5% tax · 5.0% vac · 8.0% maint · 8.0% mgmt
Financing live
Cash to close
- Down payment
- $49,750
- Closing costs
- $5,970
- Reserves months
- —
- Total cash needed
- —
Loan-product check · same deal, 3 products live
Conventional
25% down · 7.5% · 30yr
- Down + closing
- —
- Monthly P&I
- —
- Monthly cashflow
- —
- DSCR
- —
- Eligible?
- —
Personal DTI + credit; lowest rate.
DSCR
20% down · 8.5% · 30yr
- Down + closing
- —
- Monthly P&I
- —
- Monthly cashflow
- —
- DSCR
- —
- Eligible?
- —
No personal income docs; deal must DSCR.
Hard money
10% down · 12.0% · 12mo
- Down + closing
- —
- Monthly P&I
- —
- Monthly cashflow
- —
- DSCR
- —
- Eligible?
- —
Short-term bridge; refi at stabilization.
Rent comps 8 comps
| Address | Beds | Baths | Sqft | Rent | $/sqft | DOM | Units | Dist |
|---|---|---|---|---|---|---|---|---|
| 12107 Centralia Redford, MI | 3.0 | 1.0 | 912 | $1,800 | $1.97 | 43d | 1 | 0.61mi |
| 12097 Cavell St Livonia, MI | 3.0 | 1.0 | 985 | $1,200 | $1.22 | 1d | 1 | 1.02mi |
| 11726 Deering St Livonia, MI | 4.0 | 1.5 | 1248 | $2,125 | $1.70 | 1d | 1 | 1.04mi |
| 8455 Robindale Ave Dearborn Heights, MI | 3.0 | 1.0 | 1100 | $1,750 | $1.59 | 4d | 1 | 1.09mi |
| 27201 Canfield St W Dearborn Heights, MI | 1.0–2.0 | 1.0–2.0 | 852 | $1,499 | $1.76 | 1d | 22 | 1.13mi |
| 8402 Robindale Ave Dearborn Heights, MI | 3.0 | 1.0 | 1190 | $1,600 | $1.34 | 15d | 1 | 1.15mi |
| 13231 Hemingway Redford, MI | 3.0 | 1.5 | 1074 | $1,700 | $1.58 | 16d | 1 | 1.26mi |
| 8187 Lenore St Dearborn Heights, MI | 2.0 | 1.0 | 768 | $1,550 | $2.02 | 43d | 1 | 1.49mi |
Listing history 12 events
-
2026-06-15statusdays on market $199,000 Pending 14 DOM
-
2026-06-13days on market $199,000 Active 13 DOM
-
2026-06-09days on market $199,000 Active 9 DOM
-
2026-06-08days on market $199,000 Active 8 DOM
-
2026-06-07days on market $199,000 Active 7 DOM
-
2026-06-04days on market $199,000 Active 4 DOM
-
2026-06-03days on market $199,000 Active 3 DOM
-
2026-06-02days on market $199,000 Active 2 DOM
-
2026-06-02remarks 689-char remark
-
2026-06-01status $199,000 Active 1 DOM
-
2026-05-31remarks 679-char remark
-
2026-05-31$199,000 Coming Soon 1 DOM
ⓘ Source: listings_history table (triggers on properties + properties_extension) + one-shot
backfill from property_details.listing_events for pre-trigger history.
Tax reassessment forecast MI · Partial reset (capped growth)
- Current annual tax
- $771 · $64/mo
- Projected year-2 tax
- $1,918 · $160/mo
- Expected delta
- +$1,147/yr (+$96/mo · 148.8%)
ⓘ Screening estimate from a state-policy table — verify with the county assessor before closing.
Nearby sold comps map
Loading sold comps map…
Walkable amenities ~0.75 mi
Loading nearby amenities…
Taxation est. · year 1
- Rental income
- $21,200
- − Mortgage interest
- −$11,147
- − Property taxes
- −$771
- − Insurance
- −$995
- − Repairs & maintenance
- −$1,696
- − Management
- −$1,696
- − Depreciation
- −$5,789
- Taxable loss
- −$894
- Est. tax savings @ 24.0%
- +$215
- After-tax cash flow
- $2,674/yr
For passive investors: Depreciation is non-cash, so a rental often shows a tax loss while cash-flowing — sheltering income. Rental losses are passive: they offset passive income freely, and up to $25,000/yr can offset ordinary (W-2) income if you actively participate and your MAGI is under $100k (phasing out to $0 by $150k); unused losses carry forward. On sale, claimed depreciation is recaptured at up to 25%, and gains may owe capital-gains tax (a 1031 exchange can defer both). Figures are a year-1 estimate at your 24.0% rate — not tax advice; consult a CPA.
Schools (NCES district)
- District
- South Redford School District
- NCES district ID
- 2632280
- Math proficiency
- 11% ▼ -9.00%
- Reading proficiency
- 29% ▼ -7.00%
- Median HH income
- $52,775
- Composite
- 18.1/100
- National rank
- #8972
- State rank
- #455 of 540 in MI
Livability — Dearborn Heights
- Score
- 79/100
- State rank
- #82
- US rank
- #1885
Category grades
Schools grade is shown separately in the Schools card above.
Census & demographics
- County
- Wayne County · 1,562,939 people
- City population
- 61,771
- Metro
- Detroit-Warren-Dearborn, MI
- Population (ZIP)
- 36,976
- Household income
- $71,151
- Rent vs Own
- Severe rent burden
- 1052.0
Population outlook (Wayne County) Hauer SSP2
- Today (2025)
- 1,675,273 people
- By 2030
- 1,620,300 · -3.3%
- By 2040
- 1,502,341 · -10.3%
- By 2050
- 1,384,039 · -17.4%
- By 2075
- 1,124,592 · -32.9%
- By 2100
- 881,193 · -47.4%
Race, ethnicity, and origin ACS 2023
- Neighborhood character
- Majority Black (58%)
- Race & ethnicity
- Black 58% White 34% Hispanic / Latino 4% Two or more races 4%
- Common ancestry
- Romanian 7% Slovak 2% Lithuanian 2%
- Foreign-born
- 2% · Canada
- Languages at home
- 96% English-only · Spanish 1% Other Indo-European 1% Arabic 1%
Political lean MEDSL · Wayne
- 2024 margin
- Strong D (+29.0) · D 62.7% · R 33.7% · Other 3.6%
- 2008→2024 swing
- -20.5pp toward R · 2008: 49.5pp · 2024: 29.0pp
- All cycles
- 2024: D+29.0 2020: D+38.1 2016: D+37.3 2012: D+46.9 2008: D+49.5
Not yet ingested
- Civics
- —
Market trends
- HPI YoY
- ▼ -202.97%
- Current HPI
- 236.1136
- Rent YoY
- ▲ 3.25%
- Metro
- Detroit-Warren-Dearborn, MI
- State GDP YoY
- ▲ 1.37%
- F500 in state
- 28
Industry mix (Fortune 500 HQ in MI)
| Industry | F500 HQs | Revenue |
|---|---|---|
| Automotive Parts | 3 | $48B |
|
||
| Automotive | 2 | $372B |
|
||
| Chemicals | 1 | $45B |
|
||
| Automotive Retail | 1 | $29B |
|
||
| Healthcare / Medical Devices | 1 | $23B |
|
||
| Automotive Technology | 1 | $20B |
|
||
Price history
1 event — show timeline
- 2026-05-31 Coming Soon $199,000 MiRealSource-MiMLS
Property tax history
-6.6%/yrLatest (2025): $771 · -66.2% YoY. Source: county tax records.
Cash-flow waterfall
monthlySold comps — $/sqft
last 12 mo · ≤1 miLoading sold comps…