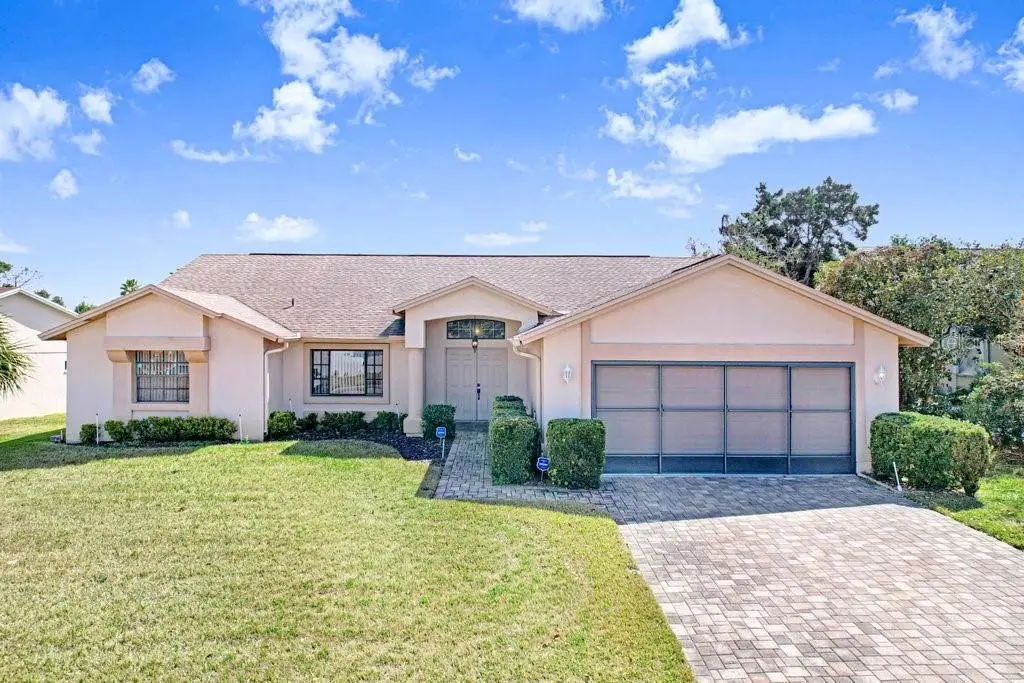
8320 Pavilion Dr · Hudson, FL
Flood risk 1/10 · Minimal
- FEMA flood zone
- X (unshaded)
- Chance of flooding over 30 yrs
- 0.0%
- Est. flood insurance / yr
- $507 – $1,088
Fire risk 2/10 · Minimal
- Est. fire insurance / yr
- $947 – $1,759
Heat risk 10/10 · Severe
- Hot days now (above 108°F)
- 7 days/yr
- Hot days in 30 yrs
- 24 days/yr
Wind risk 10/10 · Severe
- Chance of severe wind over 30 yrs
- 99.0%
Air-quality risk 2/10 · Minimal
- Unhealthy air days now
- 2 days/yr
- Unhealthy air days in 30 yrs
- 2 days/yr
Risk factors via First Street. Map © Google.
Why this score? — see what drove the D+ grade
The composite is a weighted blend of 9 inputs, each scored 0–100. Each bar is that input's sub-score; the figure is the points it added to the 100-point composite (weight × sub-score).
- ARV discount +15.0/15.0
- Cash flow +13.2/30.0
- Schools +4.3/10.0
- DSCR +4.0/10.0
- Livability +3.7/5.0
- 1% rule +3.6/10.0
- Condition / age +2.5/5.0
- Rent growth +1.9/5.0
- Appreciation +0.0/10.0
$275,000
🖨 Deal sheet 📄 Offer letter ✓ Due diligence
Listing remarks
Under contract-accepting backup offers. NEW PRICE!!!. .. Welcome to 8320 Pavilion Drive in The Estates of Beacon Woods, a well-established deed-restricted community offering comfort, convenience, and an exceptional lifestyle. This well-preserved 3-bedroom, 2-bath residence offers 2,065 square feet of thoughtfully designed living space with a split-bedroom layout and soaring vaulted ceilings that enhance the home’s open, airy feel. The spacious living room provides flexibility for both everyday living and entertaining, while the formal dining area and adjacent dinette create ideal gathering spaces. The kitchen features dual sinks, a breakfast bar, closet pantry, and seamless flow into
Key facts
- Split-bedroom layout
- Walk-in closet
- Private bath
Tags
Property features AI
Finance
- Other: Community features: association-owned recreation, deed restrictions, golf carts allowed, sidewalks, street lights, no truck/RV/motorcycle parking, special community restrictions; Pets allowed
- Financial info: Lease restrictions apply
- HOA & community: The Estates of Beacon Woods HOA (monthly fee $195 / quarterly fee $585); HOA amenities include clubhouse, fitness center, pool, tennis courts; Association fees cover cable TV, internet, pool, common area taxes, grounds maintenance, management, pest control, trash, escrow reserves
Exterior
- Parking: Attached 2-car garage (21 x 21) with garage door opener; Driveway
- Security: Smoke detectors
- Utilities: Public water; Public sewer; Electricity connected; Cable available; Fiber optics available; BB/HS internet available; Sewer connected; Water connected; Sprinkler well
- Home design: Single family residence; Residential property; One story; Northwest facing; PUD zoning; Homesteaded
- Construction: Block foundation; Block and stucco construction; Shingle roof; Built with durable exterior materials
- Exterior features: Covered, enclosed and screened patios/porches; Front porch; Rear porch; Patio; Sliding doors; Private mailbox; Rain gutters; Sidewalks; Landscaped yard with mature trees; Irrigation system
Interior
- Kitchen: Dishwasher; Range; Range hood; Refrigerator; Disposal; Electric water heater
- Bedrooms: 3 bedrooms
- Flooring: Tile; Carpet
- Bathrooms: 2 full bathrooms
- Heating & cooling: Central heating (electric); Central air conditioning
- Interior features: Cathedral ceilings; Vaulted ceilings; Ceiling fans; Open floorplan; High ceilings; Split bedroom plan; Eat-in kitchen; Thermostat; Walk-in closets; Window treatments (blinds)
- Laundry & utility: Inside laundry room; Washer; Dryer; Inside utility
Neighborhood map
What this means for you Summary
Snapshot
- This is a 3-bed/2.0-bath single-family listed at $275k.
Deal economics
- At list price, monthly cash flow is $-7 ($-84/yr) — negative.
- To cash-flow at today's rent, offer at most $274k (0.4% below list).
- To meet the 1% rule (rent ≥ 1% of price), the offer needs to be $238k (13.5% below list).
- Recommended offer: $238k (13.5% below list) — sets the bar for 1% rule.
- Cap rate 6.3% vs local median 3.4% in Hudson — top-decile yield for the area; either an underpriced asset or a hidden risk that comps aren't pricing in. Stress-test before assuming the spread holds.
Location & tenants
- Location reads 74/100 on livability (#289 in FL, #4,856 nationally) — a middle-class / working-renter tenant base. Strengths: cost of living A+, housing A+, health & safety A+; Watch: amenities D, employment D, commute F.
- Pasco (suburban): math 50% / reading 52% proficiency, ranked #32 of 73 in FL (top 44%) — acceptable for families but not a draw, mixed tenant base, ~2y average lease.
- Zoned schools: Hudson Primary Academy (math 29% / reading 31%, grade F, #1,882 of 2,144 statewide, top 88%, 647 students, 90% FRL); Hudson High School (math 45% / reading 40%, grade F, #264 of 667 statewide, top 41%, 1,387 students, 66% FRL) — zoned schools average 78% FRL vs 48% district-wide (30 pts higher); higher-poverty schools than district average — tighter screening recommended.
- Zoned-school proficiency averages 36% at this address vs 51% district-wide (-15 pts) — the specific schools serving this property underperform the Pasco average; the district grade overstates school quality for this exact location.
- Market conditions: Rents soft (-2.3%/yr); 790 active listings in the ZIP; 15 comparable units currently listed for rent nearby; rentals at typical pace (median 21d on market — plan ~3-4 weeks tenant-placement turnaround); 6,765 units permitted in Pasco County in 2024 (1,250 in 5+ unit buildings).
- At $2,378/mo this rent would consume 56% of the median local household income ($51k/yr) (locally 946% of renters already pay >50% of income on rent) — very limited rent-growth headroom before tenants either downsize or default.
Forward outlook
- Local home prices are declining (-3.0%/yr); year-one equity from $2k of loan paydown is wiped out by about $8k of value loss. Plan a longer hold.
- Pasco County population projected at +29% by 2050 — long-run rental-demand tailwind backs the buy-and-hold thesis.
Negotiation context
- It's been on market 66 days — a 6% lower offer ($258k) is reasonable based on typical stale-listing flexibility.
Risks & watch-outs
- Climate carrying-cost: severe wind risk, 99% chance of damaging wind over 30y; extreme-heat days projected 7→24/yr by 2055 (HVAC capex compounding) — expect insurance premiums to compound above CPI over the hold.
Questions for the listing agent
- What do current leases actually rent for vs. the listed asking? Can we see a recent rent roll and the last 12 months of T-12 income?
- It's been on market 66 days. Have you received any prior offers? Is the seller open to a 14% concession, seller financing, or rate buy-down credit?
- What does the HOA fee cover, when was the last increase, and are there any pending special assessments or reserve-fund shortfalls?
- Why hasn't it sold? Are there any deal-killer items the seller is aware of (foundation, flood, title, zoning, code violations)?
- Is there a deadline driving the sale (1031 exchange, divorce, estate, relocation)? That informs how much negotiation room exists.
- Schools are D-rated, which usually means shorter tenancies and higher turnover. Who's the typical renter profile here, and what's been the actual vacancy rate?
- The area grade is low — what's the realistic commute time and amenity access for the typical tenant pool here? Any planned neighborhood developments (good or bad) we should know about?
- What's the average days-on-market for RENTAL listings here right now (not sales)? A rising rental-DOM trend means longer vacancies and softer asking-rent achievability than the comps imply.
- What's the recent tenant-quality profile in this submarket — average credit score on applications, eviction rate, late-payment / NSF rate, and stable-employment percentage? A property-management company in the area should have these aggregated.
- How much new for-sale + rental construction is in the pipeline within 1–3 miles? Heavy new supply typically softens prices + rents 12–24 months out; constrained supply supports both.
Investment metrics
- 1% rule
- 0.86% ✗
- Cap rate
- 6.26%
- Cash-on-cash
- -0.11%
- DSCR
- 1.00
- GRM
- 9.6
CMA / ARV
- ARV (on-the-fly)
- $359,310
- Comps found
- 12
Show comp detail 12 sales within ~0.75 mi
| Address | Dist | Beds/Ba | Sqft | Sold | Price | $/sf | Match |
|---|---|---|---|---|---|---|---|
| 13944 Talmage Loop | 0.22mi | 3/2.0 | 2,090 (+1%) | 0mo | $406,000 | $194 | 88 |
| 8302 Danbury Ln | 0.06mi | 3/2.0 | 1,871 (-9%) | 3mo | $325,000 | $174 | 79 |
| 13615 Arden Dr | 0.61mi | 3/2.0 | 2,040 (-1%) | 2mo | $367,000 | $180 | 68 |
| 7934 Chandler Lake Ct | 0.49mi | 4/2.5 (+1) | 2,038 (-1%) | 3mo | $401,259 | $197 | 66 |
| 13111 Sumpter Cir | 0.61mi | 4/2.0 (+1) | 2,072 (+0%) | 1mo | $349,900 | $169 | 66 |
| 8912 Thoreau Pl | 0.65mi | 3/2.0 | 2,013 (-2%) | 0mo | $335,000 | $166 | 65 |
| 8319 Coral Creek Loop | 0.71mi | 3/2.0 | 2,049 (-1%) | 1mo | $430,000 | $210 | 65 |
| 8529 Regal Ln | 0.61mi | 3/2.0 | 1,962 (-5%) | 2mo | $291,000 | $148 | 62 |
| 8405 Reynolds Dr | 0.29mi | 3/2.0 | 1,771 (-14%) | 2mo | $289,000 | $163 | 61 |
| 8108 Rumford Ct | 0.35mi | 3/2.0 | 1,773 (-14%) | 0mo | $275,000 | $155 | 60 |
| 9020 Tournament Dr | 0.75mi | 4/3.0 (+1) | 2,124 (+3%) | 1mo | $399,000 | $188 | 50 |
| 13155 Clock Tower Pkwy | 0.67mi | 3/2.0 | 1,832 (-11%) | 3mo | $299,000 | $163 | 48 |
Match score weights: distance 35% · size 25% · config 20% · recency 20%. Top-matched comps best support the ARV.
Projected returns pro-forma
-3.0% appreciation · 0.0% rent growth · sell at horizon
- IRR
- -19.9%
- Equity multiple
- 0.33×
- Total profit
- $-51,948
- Equity at exit
- $41,003
- IRR
- -20.9%
- Equity multiple
- 0.06×
- Total profit
- $-72,629
- Equity at exit
- $23,777
Cash invested: $77,000 (down + closing). Projections, not guarantees.
Landlord ↔ Tenant lean methodology
- Overall (STATE)
- 87 Strongly Landlord-Friendly
- State Florida
- 87 Strongly Landlord-Friendly · R+3
- County
- — inherits STATE
- City
- — inherits STATE
ZIP-level market 34667
- Rents YoY
- -2.3%
- Active inventory
- 790
- Price-to-rent
- 9.6×
Monthly cashflow live
- Estimated rent
- $2,378 high interval (Pro) →
- Mortgage (P&I)
- −$1,442
- Tax from tax record
- −$134 /mo · $1,604/yr
- Insurance
- −$115
- HOA
- −$195
- Vacancy / Maint / Mgmt
- −$499
- Net cashflow
- $-7
Break-even live
UW: 25.0% down · 7.5% · 30yr · 1.5% tax · 5.0% vac · 8.0% maint · 8.0% mgmt
Financing live
Cash to close
- Down payment
- $68,750
- Closing costs
- $8,250
- Reserves months
- —
- Total cash needed
- —
Loan-product check · same deal, 3 products live
Conventional
25% down · 7.5% · 30yr
- Down + closing
- —
- Monthly P&I
- —
- Monthly cashflow
- —
- DSCR
- —
- Eligible?
- —
Personal DTI + credit; lowest rate.
DSCR
20% down · 8.5% · 30yr
- Down + closing
- —
- Monthly P&I
- —
- Monthly cashflow
- —
- DSCR
- —
- Eligible?
- —
No personal income docs; deal must DSCR.
Hard money
10% down · 12.0% · 12mo
- Down + closing
- —
- Monthly P&I
- —
- Monthly cashflow
- —
- DSCR
- —
- Eligible?
- —
Short-term bridge; refi at stabilization.
Rent comps 15 comps
| Address | Beds | Baths | Sqft | Rent | $/sqft | DOM | Units | Dist |
|---|---|---|---|---|---|---|---|---|
| 13642 Dunwoody Ct Hudson, FL | 3.0 | 2.0 | 1720 | $2,295 | $1.33 | 16d | 1 | 0.20mi |
| 8724 Ashbury Dr Hudson, FL | 3.0 | 2.0 | 2331 | $2,900 | $1.24 | 24d | 1 | 0.24mi |
| 13121 Shadberry Ln Hudson, FL | 3.0 | 2.0 | 1771 | $1,889 | $1.07 | 2d | 1 | 0.56mi |
| 8826 Medalist Ct Hudson, FL | 4.0 | 2.0 | 2055 | $2,900 | $1.41 | 17d | 1 | 0.57mi |
| 14144 Whitecap Ave Hudson, FL | 3.0 | 2.0 | 1594 | $2,450 | $1.54 | 20d | 1 | 0.62mi |
| 13220 Whaler Dr Hudson, FL | 3.0 | 2.0 | 1566 | $1,990 | $1.27 | 24d | 1 | 0.78mi |
| 8811 Seeley Ln Hudson, FL | 3.0 | 2.0 | 1981 | $1,895 | $0.96 | 17d | 1 | 0.80mi |
| 13013 Sawmill Way Hudson, FL | 2.0 | 2.0 | 1519 | $1,790 | $1.18 | 5d | 1 | 0.86mi |
| 14709 Shadowwood Blvd Hudson, FL | 2.0 | 2.0 | 1568 | $1,699 | $1.08 | 5d | 1 | 1.15mi |
| 14420 Pimberton Dr Hudson, FL | 3.0 | 2.0 | 1735 | $2,000 | $1.15 | 24d | 1 | 1.16mi |
| 7216 Gulf Breeze Cir Hudson, FL | 3.0 | 2.0 | 1520 | $1,781 | $1.17 | 5d | 1 | 1.19mi |
| 13847 Maria Dr Hudson beach34674, FL | 3.0 | 2.0 | 1448 | $3,000 | $2.07 | 24d | 1 | 1.22mi |
| 7708 Maryland Ave Hudson, FL | 3.0 | 2.0 | 1427 | $2,100 | $1.47 | 24d | 1 | 1.29mi |
| 6891 Clark St Hudson, FL | 3.0 | 3.0 | 1728 | $2,500 | $1.45 | 24d | 1 | 1.47mi |
| 12215 Meadowbrook Ln Hudson, FL | 2.0 | 2.0 | 1519 | $1,850 | $1.22 | 23d | 1 | 1.49mi |
HOA detail
- Monthly dues
- $195 · $2,340/yr
Listing history 3 events
-
2026-05-13status Pending
-
2026-04-20price $275,000
-
2026-03-08$299,900 Active
ⓘ Source: listings_history table (triggers on properties + properties_extension) + one-shot
backfill from property_details.listing_events for pre-trigger history.
Tax reassessment forecast FL · Resets to sale price
- Current annual tax
- $1,604 · $134/mo
- Projected year-2 tax
- $2,282 · $190/mo
- Expected delta
- +$678/yr (+$57/mo · 42.3%)
ⓘ Screening estimate from a state-policy table — verify with the county assessor before closing.
Climate risk First Street
- Flood 1/10 Low FEMA zone X (unshaded) · 0% chance over 30 yrs
- Wildfire 2/10 Low
- Heat 10/10 Extreme 7 d/yr ≥108°F today · 24 d/yr by 30 yrs out
- Wind 10/10 Extreme 99% chance of damaging wind over 30 yrs
- Air quality 2/10 Low 2 unhealthy d/yr today · 2 by 30 yrs out
Nearby sold comps map
Loading sold comps map…
Walkable amenities ~0.75 mi
Loading nearby amenities…
Taxation est. · year 1
- Rental income
- $28,533
- − Mortgage interest
- −$15,404
- − Property taxes
- −$1,604
- − Insurance
- −$1,375
- − Repairs & maintenance
- −$2,283
- − Management
- −$2,283
- − HOA
- −$2,340
- − Depreciation
- −$8,000
- Taxable loss
- −$4,756
- Est. tax savings @ 24.0%
- +$1,141
- After-tax cash flow
- $1,058/yr
For passive investors: Depreciation is non-cash, so a rental often shows a tax loss while cash-flowing — sheltering income. Rental losses are passive: they offset passive income freely, and up to $25,000/yr can offset ordinary (W-2) income if you actively participate and your MAGI is under $100k (phasing out to $0 by $150k); unused losses carry forward. On sale, claimed depreciation is recaptured at up to 25%, and gains may owe capital-gains tax (a 1031 exchange can defer both). Figures are a year-1 estimate at your 24.0% rate — not tax advice; consult a CPA.
Schools (NCES district)
- District
- Pasco
- NCES district ID
- 1201530
- Math proficiency
- 50% ▼ -10.00%
- Reading proficiency
- 52% ▼ -5.00%
- Median HH income
- $45,039
- Composite
- 43.14/100
- National rank
- #3074
- State rank
- #32 of 73 in FL
Livability — Hudson
- Score
- 74/100
- State rank
- #289
- US rank
- #4856
Category grades
Schools grade is shown separately in the Schools card above.
Census & demographics
- Census place
- Hudson, FL
- County
- Pasco County · 524,098 people
- Metro
- Tampa-St. Petersburg-Clearwater, FL
- Population (ZIP)
- 30,689
- Household income
- $51,280
- Rent vs Own
- Severe rent burden
- 946.0
Population outlook (Pasco County) Hauer SSP2
- Today (2025)
- 570,045 people
- By 2030
- 605,844 · +6.3%
- By 2040
- 674,806 · +18.4%
- By 2050
- 736,022 · +29.1%
- By 2075
- 862,900 · +51.4%
- By 2100
- 906,364 · +59.0%
Race, ethnicity, and origin ACS 2023
- Neighborhood character
- Predominantly White (86%)
- Race & ethnicity
- White 86% Hispanic / Latino 7% Two or more races 6% Black 2% Asian 2%
- Hispanic origin (detail)
- Mexican 1% Puerto Rican 2%
- Common ancestry
- Romanian 4% Lithuanian 3% Slovak 2%
- Foreign-born
- 7% · Canada, Jamaica, Vietnam
- Languages at home
- 91% English-only · Spanish 5% Other Indo-European 2% French/Haitian/Cajun 0%
Political lean MEDSL · Pasco
- 2024 margin
- Strong R (+25.2) · D 36.9% · R 62.1% · Other 1.0%
- 2008→2024 swing
- -21.6pp toward R · 2008: -3.6pp · 2024: -25.2pp
- All cycles
- 2024: R+25.2 2020: R+20.1 2016: R+21.6 2012: R+6.7 2008: R+3.6
Not yet ingested
- Civics
- —
Market trends
- HPI YoY
- ▼ -183.96%
- Current HPI
- 307.5552
- Rent YoY
- ▼ -2.26%
- Metro
- Tampa-St. Petersburg-Clearwater, FL
- State GDP YoY
- ▲ 3.28%
- F500 in state
- 36
Industry mix (Fortune 500 HQ in FL)
| Industry | F500 HQs | Revenue |
|---|---|---|
| Industrial Technology | 2 | $29B |
|
||
| Insurance | 2 | $17B |
|
||
| Retail | 1 | $60B |
|
||
| Technology Distribution | 1 | $58B |
|
||
| Homebuilding | 1 | $35B |
|
||
| Technology Manufacturing | 1 | $35B |
|
||
Price history
-8.3% since first listed3 events — show timeline
- 2026-05-13 Pending — Stellar MLS as Distributed by MLS Grid
- 2026-04-20 Price Changed $275,000 Stellar MLS as Distributed by MLS Grid
- 2026-03-08 Listed $299,900 Stellar MLS as Distributed by MLS Grid
Property tax history
+2.9%/yrLatest (2025): $1,604 · +3.2% YoY. Source: county tax records.
Cash-flow waterfall
monthlySold comps — $/sqft
last 12 mo · ≤1 miLoading sold comps…