 Multi-family
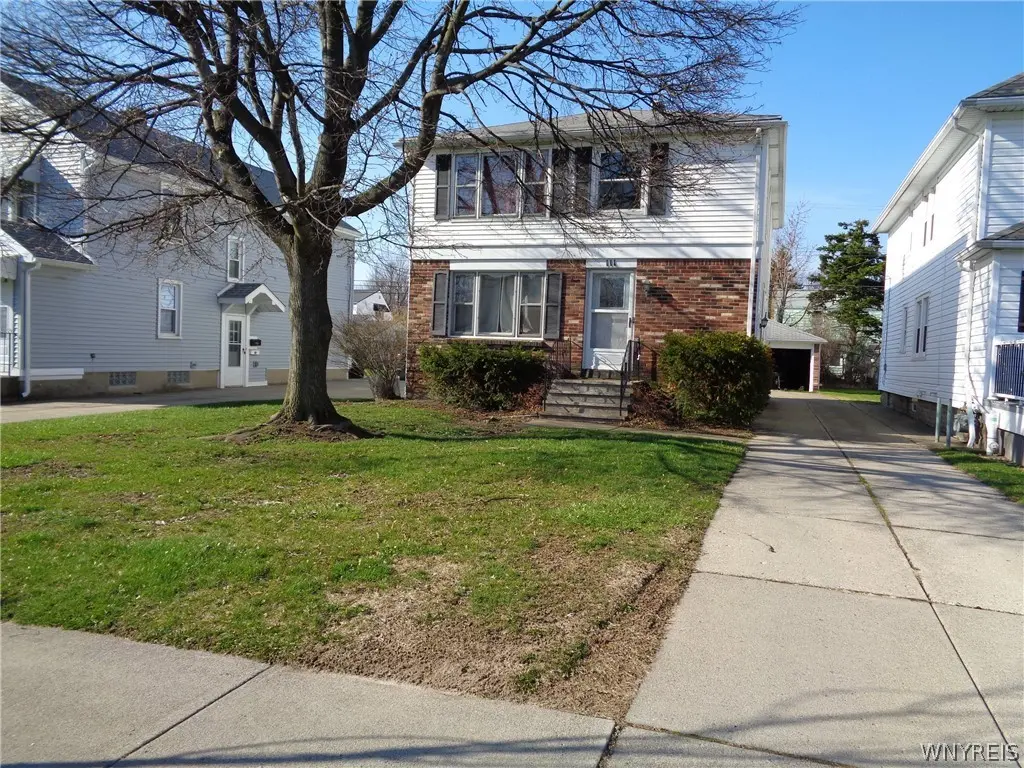
111 Tulane Rd · Tonawanda Town, NY
Flood risk 1/10 · Minimal
- FEMA flood zone
- X (unshaded)
- Chance of flooding over 30 yrs
- 0.0%
- Est. flood insurance / yr
- $473 – $860
Fire risk 1/10 · Minimal
- Est. fire insurance / yr
- $691 – $1,283
Heat risk 3/10 · Minor
- Hot days now (above 92°F)
- 7 days/yr
- Hot days in 30 yrs
- 15 days/yr
Wind risk 1/10 · Minimal
- Chance of severe wind over 30 yrs
- —
Air-quality risk 3/10 · Minor
- Unhealthy air days now
- 3 days/yr
- Unhealthy air days in 30 yrs
- 4 days/yr
Risk factors via First Street. Map © Google.
Why this score? — see what drove the C grade
The composite is a weighted blend of 9 inputs, each scored 0–100. Each bar is that input's sub-score; the figure is the points it added to the 100-point composite (weight × sub-score).
- Cash flow +20.4/30.0
- ARV discount +10.7/15.0
- DSCR +6.5/10.0
- 1% rule +6.4/10.0
- Rent growth +4.9/5.0
- Schools +3.9/10.0
- Livability +2.5/5.0
- Condition / age +2.5/5.0
- Appreciation +0.0/10.0
$249,900
🖨 Deal sheet 📄 Offer letter ✓ Due diligence
Multi-family units
County records classify this as Multi-Family (2-4 Unit). Listing-text estimate: 1 unit. estimate disagrees with records
Listing remarks
This well cared for 2/2 double in the Ken-Ton School District is a great opportunity for investors or owner occupants. Each apartment features an eat–in kitchen with white cabinets (stove and fridge included), 2 bedrooms and a full ceramic bath. The full, dry basement has a washer and dryer included plus hook-ups for a second set, 2 furnaces and hot water tanks all approximately 6 yrs old. Also included: 2 window a/c units, a 2 car garage with garage door opener and a brand new garage door, maintenance free vinyl siding and many replacement windows. Showings commence at noon on 4/10/26; showings by appointment only, as both units are currently occupied. Offers, if any, are due Monday,
Key facts
- 4,452 sq ft lot
- 2 garage spots
- Built 1973
Property features AI
Finance
- Financial info: Two total units with separate gas and electric meters (2 of each); Unit 1 rent: $900 (month-to-month); Unit 2 rent: $1,250 (month-to-month); Owner pays: garage and water; Rent includes: parking and water; Operating expenses include maintenance structure and water/sewer
Exterior
- Parking: Detached garage with 2 garage spaces; Concrete driveway; Garage door opener; Parking included with rent
- Utilities: Public water (connected); Sewer connected; Cable available; Circuit breaker electrical service
- Home design: Two-story multi-family (2-unit) property; Property condition: Resale
- Construction: Brick and vinyl siding exterior; Asphalt shingle roof; Built (existing structure)
- Exterior features: Near public transit; Rectangular residential lot; City street frontage
Interior
- Kitchen: Unit 1: Oven/range, refrigerator, eat-in kitchen; Unit 2: Oven/range, refrigerator, eat-in kitchen
- Bedrooms: Two 2-bedroom units (each unit has 2 bedrooms)
- Flooring: Carpet; Ceramic tile; Laminate; Varies
- Bathrooms: Each unit has 1 full bathroom (2 full bathrooms total)
- Heating & cooling: Gas forced-air heating; Window air conditioning units
- Interior features: Cedar closets; Full basement with sump pump
- Laundry & utility: Unit 2 includes washer and dryer; Gas water heater
Neighborhood map
What this means for you Summary
Snapshot
- This is a 4-bed/2.0-bath multifamily listed at $250k.
Deal economics
- At list price, monthly cash flow is $324 ($4k/yr) — positive.
- The deal already cash-flows at list — no discount required.
- Meets the 1% rule at list price ($3k rent vs $250k).
- Cap rate 7.9% vs local median 4.1% in Tonawanda Town — top-decile yield for the area; either an underpriced asset or a hidden risk that comps aren't pricing in. Stress-test before assuming the spread holds.
Location & tenants
- Location reads: area grade C — affects rentability + tenant quality, not the cash-flow math above.
- Kenmore-Tonawanda Union Free School District (suburban): math 44% / reading 47% proficiency, ranked #453 of 590 in NY (top 77%) — families likely to look elsewhere, expect single-tenant / working-renter base with shorter leases.
- Market conditions: Rents rising fast (+9.8%/yr); 99 active listings in the ZIP; 4 comparable units currently listed for rent nearby; rentals at typical pace (median 24d on market — plan ~3-4 weeks tenant-placement turnaround); 1,244 units permitted in Erie County in 2024 (563 in 5+ unit buildings).
- At $2,853/mo this rent would consume 46% of the median local household income ($74k/yr) (locally 727% of renters already pay >50% of income on rent) — very limited rent-growth headroom before tenants either downsize or default.
Forward outlook
- Local home prices are declining (-3.0%/yr); year-one equity from $2k of loan paydown is wiped out by about $7k of value loss. Plan a longer hold.
- At projected returns (-3.0% appreciation + 8.0% rent growth), your $70k cash investment doubles in ~9 years — after that, you're playing with house money.
Negotiation context
- Only 13 days on market — expect competitive offers; lowballing is unlikely to land.
- Current owner paid $95k; list at $250k implies a 163% gain — meaningful room to come down on a strong offer.
Questions for the listing agent
- Built in 1973 — when were the roof, HVAC, electrical panel, plumbing, and water heater last replaced?
- Is there a deadline driving the sale (1031 exchange, divorce, estate, relocation)? That informs how much negotiation room exists.
- What's the average days-on-market for RENTAL listings here right now (not sales)? A rising rental-DOM trend means longer vacancies and softer asking-rent achievability than the comps imply.
- What's the recent tenant-quality profile in this submarket — average credit score on applications, eviction rate, late-payment / NSF rate, and stable-employment percentage? A property-management company in the area should have these aggregated.
- How much new apartment / multifamily construction is in the pipeline within 1–3 miles? Heavy new supply (>2% of stock underway) typically softens rents 12–24 months out; light construction supports rent growth.
Investment metrics
- 1% rule
- 1.14% ✓
- Cap rate
- 7.85%
- Cash-on-cash
- 5.56%
- DSCR
- 1.25
- GRM
- 7.3
CMA / ARV
- ARV (on-the-fly)
- $269,280
- Comps found
- 12
Show comp detail 12 sales within ~0.75 mi
| Address | Dist | Beds/Ba | Sqft | Sold | Price | $/sf | Match |
|---|---|---|---|---|---|---|---|
| 129 Kenview Ave | 0.21mi | 4/2.0 | 1,620 (+2%) | 10mo | $275,000 | $170 | 78 |
| 68 Tulane Rd | 0.09mi | 4/2.0 | 1,687 (+6%) | 11mo | $306,000 | $181 | 76 |
| 170 Mayville Ave | 0.58mi | 4/2.0 | 1,612 (+2%) | 3mo | $199,000 | $123 | 67 |
| 104 Shepard Ave | 0.38mi | 3/2.0 (-1) | 1,633 (+3%) | 8mo | $278,000 | $170 | 65 |
| 145 N End Ave | 0.12mi | 5/2.0 (+1) | 1,728 (+9%) | 16mo | $140,000 | $81 | 61 |
| 161 Pullman Ave | 0.47mi | 4/2.0 | 1,612 (+2%) | 17mo | $280,000 | $174 | 61 |
| 151 Henderson Ave | 0.46mi | 4/2.0 | 1,664 (+5%) | 11mo | $280,000 | $168 | 60 |
| 174 Woodward Ave | 0.49mi | 4/2.0 | 1,612 (+2%) | 17mo | $285,000 | $177 | 60 |
| 175 Mayville Ave | 0.58mi | 4/2.0 | 1,674 (+6%) | 5mo | $225,000 | $134 | 59 |
| 86 Pullman Ave | 0.34mi | 4/2.0 | 1,792 (+13%) | 6mo | $315,000 | $176 | 57 |
| 365 Washington Ave | 0.70mi | 4/2.0 | 1,536 (-3%) | 10mo | $249,000 | $162 | 54 |
| 181 Shepard Ave | 0.37mi | 4/2.0 | 1,796 (+13%) | 17mo | $261,000 | $145 | 46 |
Match score weights: distance 35% · size 25% · config 20% · recency 20%. Top-matched comps best support the ARV.
Projected returns pro-forma
-3.0% appreciation · 8.0% rent growth · sell at horizon
- IRR
- -1.6%
- Equity multiple
- 0.93×
- Total profit
- $-4,591
- Equity at exit
- $37,261
- IRR
- 13.2%
- Equity multiple
- 2.31×
- Total profit
- $91,907
- Equity at exit
- $21,607
Cash invested: $69,972 (down + closing). Projections, not guarantees.
Landlord ↔ Tenant lean methodology
- Overall (STATE)
- 15 Strongly Tenant-Friendly
- State New York
- 15 Strongly Tenant-Friendly · D+10
- County
- — inherits STATE
- City
- — inherits STATE
ZIP-level market 14217
- Home prices YoY
- -34.3%
- Rents YoY
- 9.8%
- Active inventory
- 99
- Price-to-rent
- 14.6×
Monthly cashflow live
- Estimated rent
- $2,853 high interval (Pro) →
- Mortgage (P&I)
- −$1,311
- Tax from tax record
- −$515 /mo · $6,179/yr
- Insurance
- −$104
- HOA
- −$0
- Vacancy / Maint / Mgmt
- −$599
- Net cashflow
- $324
Break-even live
2-unit breakdown (identical units grouped — click to expand)
| Units | Beds | Baths | Est. rent |
|---|---|---|---|
| 2× units | 2 | 1 | $2,852 |
| #1 | 2 | 1 | $1,426 |
| #2 | 2 | 1 | $1,426 |
| Total (2 units) | $2,853 | ||
UW: 25.0% down · 7.5% · 30yr · 1.5% tax · 5.0% vac · 8.0% maint · 8.0% mgmt
Financing live
Cash to close
- Down payment
- $62,475
- Closing costs
- $7,497
- Reserves months
- —
- Total cash needed
- —
Loan-product check · same deal, 3 products live
Conventional
25% down · 7.5% · 30yr
- Down + closing
- —
- Monthly P&I
- —
- Monthly cashflow
- —
- DSCR
- —
- Eligible?
- —
Personal DTI + credit; lowest rate.
DSCR
20% down · 8.5% · 30yr
- Down + closing
- —
- Monthly P&I
- —
- Monthly cashflow
- —
- DSCR
- —
- Eligible?
- —
No personal income docs; deal must DSCR.
Hard money
10% down · 12.0% · 12mo
- Down + closing
- —
- Monthly P&I
- —
- Monthly cashflow
- —
- DSCR
- —
- Eligible?
- —
Short-term bridge; refi at stabilization.
Rent comps 4 comps
| Address | Beds | Baths | Sqft | Rent | $/sqft | DOM | Units | Dist |
|---|---|---|---|---|---|---|---|---|
| 237 W Girard Blvd Buffalo, NY | 4.0 | 1.5 | 1329 | $4,000 | $3.01 | 23d | 1 | 0.34mi |
| 148 Colonial Ave Buffalo, NY | 4.0 | 2.0 | 1240 | $2,900 | $2.34 | 23d | 1 | 0.55mi |
| 172 Tremont Ave Kenmore, NY | 3.0 | 1.5 | 1569 | $2,500 | $1.59 | 10d | 1 | 0.64mi |
| 62 Seabrook St Buffalo, NY | 4.0 | 1.0 | 1300 | $2,000 | $1.54 | 1d | 1 | 1.32mi |
Listing history 4 events
-
2026-04-23status Pending
-
2026-04-10$249,900 Active
-
2005-08-12soldstatus $95,000
-
2000-11-30soldstatus $91,400
ⓘ Source: listings_history table (triggers on properties + properties_extension) + one-shot
backfill from property_details.listing_events for pre-trigger history.
Tax reassessment forecast NY · Partial reset (capped growth)
- Current annual tax
- $6,179 · $515/mo
- Projected year-2 tax
- $6,179 · $515/mo
- Expected delta
- $0/yr ($0/mo · 0.0%)
ⓘ Screening estimate from a state-policy table — verify with the county assessor before closing.
Climate risk First Street
- Flood 1/10 Low FEMA zone X (unshaded) · 0% chance over 30 yrs
- Wildfire 1/10 Low
- Heat 3/10 Moderate 7 d/yr ≥92°F today · 15 d/yr by 30 yrs out
- Wind 1/10 Low
- Air quality 3/10 Moderate 3 unhealthy d/yr today · 4 by 30 yrs out
Nearby sold comps map
Loading sold comps map…
Walkable amenities ~0.75 mi
Loading nearby amenities…
Taxation est. · year 1
- Rental income
- $34,236
- − Mortgage interest
- −$13,998
- − Property taxes
- −$6,179
- − Insurance
- −$1,250
- − Repairs & maintenance
- −$2,739
- − Management
- −$2,739
- − Depreciation
- −$7,270
- Taxable income
- $62
- Est. tax owed @ 24.0%
- −$15
- After-tax cash flow
- $3,877/yr
For passive investors: Depreciation is non-cash, so a rental often shows a tax loss while cash-flowing — sheltering income. Rental losses are passive: they offset passive income freely, and up to $25,000/yr can offset ordinary (W-2) income if you actively participate and your MAGI is under $100k (phasing out to $0 by $150k); unused losses carry forward. On sale, claimed depreciation is recaptured at up to 25%, and gains may owe capital-gains tax (a 1031 exchange can defer both). Figures are a year-1 estimate at your 24.0% rate — not tax advice; consult a CPA.
Schools (NCES district)
- District
- Kenmore-Tonawanda Union Free School District
- NCES district ID
- 3616230
- Math proficiency
- 44% ▼ -12.00%
- Reading proficiency
- 47% ▼ -1.00%
- Median HH income
- $51,433
- Composite
- 39.18/100
- National rank
- #4024
- State rank
- #453 of 590 in NY
Livability — Tonawanda Town
No livability data for this city. (Only ~50 U.S. cities are tracked.)
Census & demographics
- Census place
- Tonawanda Town, NY
- County
- Erie County · 714,559 people
- City population
- 63,948
- Metro
- Buffalo-Cheektowaga, NY
- Population (ZIP)
- 22,471
- Household income
- $73,800
- Rent vs Own
- Severe rent burden
- 727.0
Population outlook (Erie County) Hauer SSP2
- Today (2025)
- 933,037 people
- By 2030
- 935,181 · +0.2%
- By 2040
- 928,531 · -0.5%
- By 2050
- 905,725 · -2.9%
- By 2075
- 834,037 · -10.6%
- By 2100
- 708,033 · -24.1%
Race, ethnicity, and origin ACS 2023
- Neighborhood character
- Predominantly White (82%)
- Race & ethnicity
- White 82% Two or more races 8% Hispanic / Latino 6% Black 5%
- Hispanic origin (detail)
- Puerto Rican 4%
- Common ancestry
- Romanian 13% Italian 2% Slovak 2%
- Foreign-born
- 4% · Canada
- Languages at home
- 94% English-only · Spanish 3% Arabic 1% Russian/Polish/Slavic 1%
Political lean MEDSL · Erie
- 2024 margin
- Lean D (+9.7) · D 54.8% · R 45.2%
- 2008→2024 swing
- -7.9pp toward R · 2008: 17.5pp · 2024: 9.7pp
- All cycles
- 2024: D+9.7 2020: D+14.7 2016: D+4.8 2012: D+15.6 2008: D+17.5
Not yet ingested
- Civics
- —
Market trends
- HPI YoY
- ▼ -172.52%
- Current HPI
- 330.7596
- Rent YoY
- ▲ 9.76%
- Metro
- Buffalo-Cheektowaga, NY
- State GDP YoY
- ▲ 2.60%
- F500 in state
- 92
Industry mix (Fortune 500 HQ in NY)
| Industry | F500 HQs | Revenue |
|---|---|---|
| Financial Services | 10 | $950B |
|
||
| Consumer Goods | 9 | $162B |
|
||
| Insurance | 4 | $225B |
|
||
| Telecommunications | 2 | $144B |
|
||
| Pharmaceuticals | 2 | $112B |
|
||
| Media / Entertainment | 2 | $69B |
|
||
Price history
+173.4% since first listed4 events — show timeline
- 2026-04-23 Pending — WNYREIS
- 2026-04-10 Listed $249,900 WNYREIS
- 2005-08-12 Sold (Public Records) $95,000 Public Records
- 2000-11-30 Sold (Public Records) $91,400 Public Records
Property tax history
+7.2%/yrLatest (2025): $6,179 · +1.1% YoY. Source: county tax records.
Cash-flow waterfall
monthlySold comps — $/sqft
last 12 mo · ≤1 miLoading sold comps…