 🏷️ Likely Rental
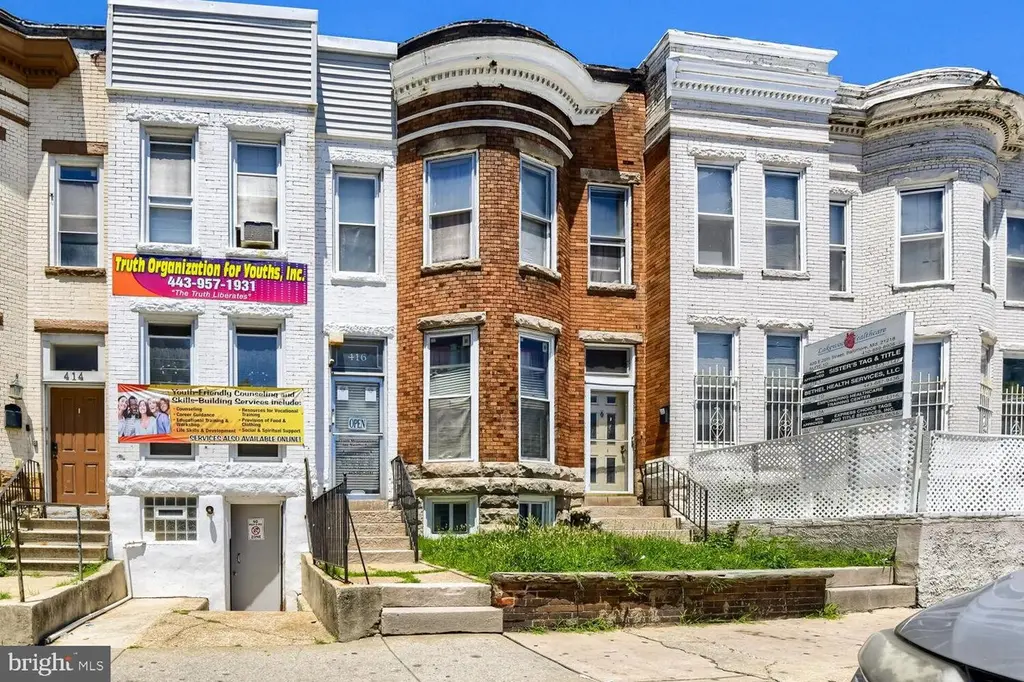
416 E 25th St · Baltimore, MD
Flood risk 1/10 · Minimal
- FEMA flood zone
- X (unshaded)
- Chance of flooding over 30 yrs
- 0.0%
- Est. flood insurance / yr
- $473 – $860
Fire risk 1/10 · Minimal
- Est. fire insurance / yr
- $755 – $1,403
Heat risk 7/10 · Major
- Hot days now (above 103°F)
- 7 days/yr
- Hot days in 30 yrs
- 15 days/yr
Wind risk 6/10 · Moderate
- Chance of severe wind over 30 yrs
- 27.0%
Air-quality risk 4/10 · Minor
- Unhealthy air days now
- 6 days/yr
- Unhealthy air days in 30 yrs
- 7 days/yr
Risk factors via First Street. Map © Google.
Why this score? — see what drove the B grade
The composite is a weighted blend of 9 inputs, each scored 0–100. Each bar is that input's sub-score; the figure is the points it added to the 100-point composite (weight × sub-score).
- Cash flow +27.4/30.0
- ARV discount +15.0/15.0
- DSCR +9.6/10.0
- 1% rule +7.8/10.0
- Livability +3.8/5.0
- Rent growth +2.9/5.0
- Condition / age +2.5/5.0
- Schools +1.0/10.0
- Appreciation +0.0/10.0
$149,900
🖨 Deal sheet (PDF) 📄 Offer letter ✓ Due diligence
Listing remarks
Priced to sell fast—this one won’t last, so schedule your showing today. Solid mixed-use investment opportunity just steps from Charles Village on a desirable 25th Street block. This residential/commercial property is currently leased to a stable, low-maintenance nonprofit tenant who has been in place for over 10 years and wishes to remain on a flexible month-to-month basis—turnkey income from day one. The full basement offers exceptional storage and has served the tenant well, and a coveted private parking pad sits at the rear. With its prime location and versatile zoning, the property also presents strong upside: convert to a single residence to capture higher long-term
Key facts
- Private parking pad
- Versatile zoning
- Full basement
Tags
Property features AI
Finance
- HOA & community: Ground rent paid annually
Exterior
- Parking: On-street parking
- Utilities: Electric with circuit breakers; Natural gas for heating and hot water; Public water; Public sewer
- Home design: Interior townhouse/rowhouse; Fee simple ownership; Property in good condition
- Construction: Brick construction; Brick/mortar foundation; Flat rubber roof; Built according to assessor records
- Exterior features: Public water and public sewer; Located within city limits; Bus stop within 1 mile; metro/subway 1–3 miles; commuter rail 1–5 miles; commuter lots within 5 miles
Interior
- Kitchen: Refrigerator; Microwave
- Bedrooms: Three bedrooms on the first upper level
- Flooring: Hardwood floors; Ceramic tile
- Bathrooms: One full bathroom (upper level); One half bathroom (main level)
- Heating & cooling: Forced air heating (natural gas); Central air conditioning (electric)
- Interior features: Drywall walls and ceilings; Basement with front and outside entrances; Basement partially finished (about half finished)
Neighborhood map
What this means for you Summary
Snapshot
- This is a 3-bed/2.0-bath townhouse listed at $150k.
Deal economics
- At list price, monthly cash flow is $441 ($5k/yr) — positive.
- The deal already cash-flows at list — no discount required.
- Meets the 1% rule at list price ($2k rent vs $150k).
- Cap rate 9.8% vs local median 6.0% in Baltimore — top-decile yield for the area; either an underpriced asset or a hidden risk that comps aren't pricing in. Stress-test before assuming the spread holds.
Location & tenants
- Location reads 76/100 on livability (#90 in MD, #3,396 nationally) — a middle-class / working-renter tenant base. Strengths: amenities A+, commute A+, housing A+; Watch: schools D, crime F.
- Baltimore City Public Schools (urban): math 7% / reading 16% proficiency, ranked #24 of 24 in MD (top 100%) — low school quality limits family demand, transient renter base, plan for 1-2y turnover; 79% free/reduced lunch — lower-income household profile, screen leases tightly.
- Market conditions: Rents rising (+1.6%/yr); 325 active listings in the ZIP; 40 comparable units currently listed for rent nearby; rentals at typical pace (median 24d on market — plan ~3-4 weeks tenant-placement turnaround); 1,273 units permitted in Baltimore city in 2024 (1,104 in 5+ unit buildings).
- This rent runs 37% of the median local income ($62k/yr) — at the standard rent-burdened threshold; future hikes will face affordability resistance.
Forward outlook
- Local home prices are declining (-3.0%/yr); year-one equity from $1k of loan paydown is wiped out by about $4k of value loss. Plan a longer hold.
- Baltimore County population projected to shrink 4% by 2050 — rents likely to lag national; underwrite the cash flow, not the appreciation.
Negotiation context
- Only 13 days on market — expect competitive offers; lowballing is unlikely to land.
- 9 sale attempts since 22y ago with the ask held roughly flat each time — persistent listings suggest the price (not the market) is what's stuck; bring a comps-based counter.
- Current owner paid $96k; list at $150k implies a 57% gain — meaningful room to come down on a strong offer.
Risks & watch-outs
- Watch-outs: built in 1900 — expect roof / HVAC / electrical / plumbing capex.
- Climate carrying-cost: major wind risk, 27% chance of damaging wind over 30y; extreme-heat days projected 7→15/yr by 2055 (HVAC capex compounding) — expect insurance premiums to compound above CPI over the hold.
Questions for the listing agent
- Built in 1900 — when were the roof, HVAC, electrical panel, plumbing, and water heater last replaced?
- Is there a deadline driving the sale (1031 exchange, divorce, estate, relocation)? That informs how much negotiation room exists.
- Schools are D-rated, which usually means shorter tenancies and higher turnover. Who's the typical renter profile here, and what's been the actual vacancy rate?
- Crime grade is F in this area — have there been break-ins, vandalism, or insurance claims at this property in the last 3 years? What carrier currently insures it and at what premium?
- What's the average days-on-market for RENTAL listings here right now (not sales)? A rising rental-DOM trend means longer vacancies and softer asking-rent achievability than the comps imply.
- What's the recent tenant-quality profile in this submarket — average credit score on applications, eviction rate, late-payment / NSF rate, and stable-employment percentage? A property-management company in the area should have these aggregated.
- How much new for-sale + rental construction is in the pipeline within 1–3 miles? Heavy new supply typically softens prices + rents 12–24 months out; constrained supply supports both.
Investment metrics
- 1% rule
- 1.28% ✓
- Cap rate
- 9.82%
- Cash-on-cash
- 12.60%
- DSCR
- 1.56
- GRM
- 6.5
CMA / ARV
- ARV (on-the-fly)
- $239,860
- Comps found
- 12
Show comp detail 12 sales within ~0.75 mi
| Address | Dist | Beds/Ba | Sqft | Sold | Price | $/sf | Match |
|---|---|---|---|---|---|---|---|
| 2540 Greenmount Ave | 0.07mi | 3/1.0 | 1,340 (0%) | 0mo | $79,000 | $59 | 92 |
| 326 E 26th St | 0.12mi | 3/2.0 | 1,496 (+12%) | 2mo | $170,000 | $114 | 73 |
| 2545 Cecil Ave | 0.61mi | 3/2.5 | 1,318 (-2%) | 1mo | $215,000 | $163 | 66 |
| 435 Ilchester Ave | 0.30mi | 3/2.0 | 1,531 (+14%) | 2mo | $123,000 | $80 | 61 |
| 1120 Montpelier St | 0.59mi | 3/2.0 | 1,260 (-6%) | 2mo | $70,000 | $56 | 61 |
| 3045 Guilford Ave | 0.53mi | 3/1.5 | 1,532 (+14%) | 0mo | $310,000 | $202 | 50 |
| 3043 Guilford Ave | 0.52mi | 3/1.5 | 1,532 (+14%) | 0mo | $275,000 | $180 | 49 |
| 1234 E Lafayette Ave E | 0.73mi | 3/2.5 | 1,225 (-9%) | 2mo | $219,000 | $179 | 48 |
| 2559 Garrett Ave | 0.69mi | 3/3.0 | 1,202 (-10%) | 2mo | $205,000 | $171 | 45 |
| 2821 Remington Ave | 0.64mi | 2/2.0 (-1) | 1,170 (-13%) | 1mo | $265,000 | $226 | 43 |
| 459 W 24th St | 0.71mi | 3/1.5 | 1,144 (-15%) | 1mo | $224,500 | $196 | 40 |
| 3201 Saint Paul St #310 | 0.70mi | 2/2.0 (-1) | 1,524 (+14%) | 2mo | $300,000 | $197 | 38 |
Match score weights: distance 35% · size 25% · config 20% · recency 20%. Top-matched comps best support the ARV.
Projected returns pro-forma
-3.0% appreciation · 1.63% rent growth · sell at horizon
- IRR
- 0.8%
- Equity multiple
- 1.03×
- Total profit
- $1,217
- Equity at exit
- $22,351
- IRR
- 9.0%
- Equity multiple
- 1.64×
- Total profit
- $27,005
- Equity at exit
- $12,961
Cash invested: $41,972 (down + closing). Projections, not guarantees.
Landlord ↔ Tenant lean methodology
- Overall (CITY)
- 12 Strongly Tenant-Friendly
- State Maryland
- 27 Tenant-Leaning · D+14
- County
- — inherits STATE
- City Baltimore
- 12 Strongly Tenant-Friendly · D+58
ZIP-level market 21218
- Rents YoY
- 1.6%
- Active inventory
- 325
- Price-to-rent
- 6.5×
Monthly cashflow live
- Estimated rent
- $1,915 high interval (Pro) →
- Mortgage (P&I)
- −$786
- Tax from tax record
- −$224 /mo · $2,683/yr
- Insurance
- −$62
- HOA
- −$0
- Vacancy / Maint / Mgmt
- −$402
- Net cashflow
- $441
Break-even live
Sensitivity live
| Price | -10% $525 | -5% $483 | +0% $441 | +5% $398 | +10% $356 |
|---|---|---|---|---|---|
| Rent | -10% $289 | -5% $365 | +0% $441 | +5% $516 | +10% $592 |
| Rate | -1.0pp $516 | -0.5pp $479 | base $441 | +0.5pp $402 | +1.0pp $362 |
UW: 25.0% down · 7.5% · 30yr · 1.5% tax · 5.0% vac · 8.0% maint · 8.0% mgmt
Financing live
Cash to close
- Down payment
- $37,475
- Closing costs
- $4,497
- Reserves months
- —
- Total cash needed
- —
Loan-product check · same deal, 3 products live
Conventional
25% down · 7.5% · 30yr
- Down + closing
- —
- Monthly P&I
- —
- Monthly cashflow
- —
- DSCR
- —
- Eligible?
- —
Personal DTI + credit; lowest rate.
DSCR
20% down · 8.5% · 30yr
- Down + closing
- —
- Monthly P&I
- —
- Monthly cashflow
- —
- DSCR
- —
- Eligible?
- —
No personal income docs; deal must DSCR.
Hard money
10% down · 12.0% · 12mo
- Down + closing
- —
- Monthly P&I
- —
- Monthly cashflow
- —
- DSCR
- —
- Eligible?
- —
Short-term bridge; refi at stabilization.
Rent comps 40 comps
| Address | Beds | Baths | Sqft | Rent | $/sqft | DOM | Units | Dist |
|---|---|---|---|---|---|---|---|---|
| 2516 Barclay St Baltimore, MD | 3.0 | 1.0 | 992 | $1,375 | $1.39 | 16d | 1 | 0.06mi |
| 411 E Lorraine Ave Baltimore, MD | 3.0 | 1.5 | 1344 | $2,200 | $1.64 | 24d | 1 | 0.13mi |
| 400 E Lorraine Ave Baltimore, MD | 3.0 | 1.0 | 1500 | $1,800 | $1.20 | 20d | 1 | 0.15mi |
| 428 E Lorraine Ave Baltimore, MD | 3.0 | 2.0 | 1344 | $1,875 | $1.40 | 24d | 1 | 0.16mi |
| 428 E Lorraine Ave Unit 1 Baltimore, MD | 3.0 | 1.5 | 1344 | $1,875 | $1.40 | 44d | 1 | 0.16mi |
| 450 E Lorraine Ave Baltimore, MD | 3.0 | 1.0 | 1344 | $1,695 | $1.26 | 44d | 1 | 0.16mi |
| 534 E 23rd St Baltimore, MD | 3.0 | 2.5 | 1700 | $2,350 | $1.38 | 44d | 1 | 0.21mi |
| 646 Cokesbury Ave Baltimore, MD | 2.0 | 1.5 | 1200 | $1,299 | $1.08 | 44d | 1 | 0.23mi |
| 2440 Saint Paul St Unit 4E Baltimore, MD | 2.0 | 2.0 | 891 | $1,625 | $1.82 | 44d | 1 | 0.25mi |
| 2300 N Calvert St Baltimore, MD | 1.0–2.0 | 1.0–2.0 | 1100 | $1,995 | $1.81 | 3d | 2 | 0.25mi |
| 402 E 28th St Baltimore, MD | 3.0 | 1.0 | 1436 | $2,200 | $1.53 | 44d | 1 | 0.30mi |
| 519 E 28th St Baltimore, MD | 3.0 | 2.0 | 1500 | $2,000 | $1.33 | 5d | 1 | 0.31mi |
| 436 Ilchester Ave Unit 1 Baltimore, MD | 2.0 | 2.0 | 1002 | $1,350 | $1.35 | 44d | 1 | 0.35mi |
| 2641 N Howard St Baltimore, MD | 4.0 | 3.5 | 1344 | $2,800 | $2.08 | 24d | 1 | 0.49mi |
| 2752 Maryland Ave Unit 2ND FLOOR Baltimore, MD | 2.0 | 1.0 | 900 | $1,500 | $1.67 | 18d | 1 | 0.50mi |
| 3012 Mathews St Baltimore, MD | 2.0 | 1.0 | 996 | $1,100 | $1.10 | 18d | 1 | 0.51mi |
| 3026 Mathews St Baltimore, MD | 2.0 | 1.0 | 996 | $1,350 | $1.36 | 15d | 1 | 0.54mi |
| 325 W Lorraine Ave Baltimore, MD | 3.0 | 1.0 | 1470 | $3,150 | $2.14 | 5d | 1 | 0.54mi |
| 1711 Latrobe St Baltimore, MD | 2.0 | 1.5 | 1000 | $1,700 | $1.70 | 24d | 1 | 0.59mi |
| 616 Montpelier St Baltimore, MD | 3.0 | 1.0 | 1150 | $1,750 | $1.52 | 11d | 1 | 0.60mi |
| 936 Montpelier St Baltimore, MD | 2.0 | 1.0 | 1260 | $1,450 | $1.15 | 24d | 1 | 0.61mi |
| 412 E Lanvale St Baltimore, MD | 3.0 | 2.0 | 1600 | $3,100 | $1.94 | 5d | 1 | 0.61mi |
| 2310 Aisquith St Baltimore, MD | 4.0 | 3.0 | 900 | $2,000 | $2.22 | 5d | 1 | 0.62mi |
| 448 Pitman Pl Baltimore, MD | 2.0 | 1.5 | 940 | $2,145 | $2.28 | 24d | 1 | 0.65mi |
| 1704 Saint Paul St Unit 1 Baltimore, MD | 2.0 | 1.0 | 1141 | $1,550 | $1.36 | 5d | 1 | 0.66mi |
| 437 Pitman Pl Baltimore, MD | 2.0 | 3.0 | 1520 | $1,650 | $1.09 | 5d | 1 | 0.67mi |
| 2606 Cecil Ave Baltimore, MD | 2.0 | 1.5 | 1200 | $1,500 | $1.25 | 44d | 1 | 0.68mi |
| 3221 Guilford Ave Apt A Baltimore, MD | 3.0 | 1.5 | 1025 | $2,925 | $2.85 | 18d | 1 | 0.68mi |
| 456 E Federal St Baltimore, MD | 2.0 | 2.0 | 1450 | $1,850 | $1.28 | 44d | 1 | 0.69mi |
| 458 E Federal St Baltimore, MD | 2.0 | 2.5 | 1300 | $1,850 | $1.42 | 4d | 1 | 0.69mi |
| 412 E Federal St Baltimore, MD | 2.0 | 2.5 | 1100 | $1,700 | $1.55 | 24d | 1 | 0.69mi |
| 3201 Saint Paul St Baltimore, MD | 1.0–2.0 | 1.5–2.0 | 1532 | $3,200 | $2.09 | 3d | 1 | 0.71mi |
| 210 Federal St Baltimore, MD | 3.0 | 1.0 | 900 | $1,350 | $1.50 | 20d | 1 | 0.72mi |
| 315 W 30th St Baltimore, MD | 3.0 | 3.0 | 1250 | $2,450 | $1.96 | 16d | 1 | 0.73mi |
| 315 W 30th St Baltimore, MD | 3.0 | 3.0 | 1200 | $2,450 | $2.04 | 18d | 1 | 0.73mi |
| 1333 E North Ave Baltimore, MD | 4.0 | 2.5 | 1860 | $2,200 | $1.18 | 24d | 1 | 0.74mi |
| 348 E University Pkwy Baltimore, MD | 4.0 | 2.0 | 1809 | $2,400 | $1.33 | 44d | 1 | 0.75mi |
| 3222 Ellerslie Ave Baltimore, MD | 4.0 | 1.5 | 1550 | $1,950 | $1.26 | 44d | 1 | 0.77mi |
| 304 W North Ave Baltimore, MD | 1.0–2.0 | 1.0 | 804 | $890 | $1.11 | 24d | 5 | 0.78mi |
| 305 W 31st St Baltimore, MD | 4.0 | 2.0 | 1500 | $2,499 | $1.67 | 44d | 1 | 0.80mi |
Listing history 9 events
-
2026-06-18days on market $149,900 Active 13 DOM
-
2026-06-17days on market $149,900 Active 12 DOM
-
2026-06-16days on market $149,900 Active 11 DOM
-
2026-06-15days on market $149,900 Active 10 DOM
-
2026-06-13days on market $149,900 Active 8 DOM
-
2026-06-09days on market $149,900 Active 4 DOM
-
2026-06-08days on market $149,900 Active 3 DOM
-
2026-06-07remarks 681-char remark
-
2026-06-07$149,900 Active 2 DOM
ⓘ Source: listings_history table (triggers on properties + properties_extension) + one-shot
backfill from property_details.listing_events for pre-trigger history.
Tax reassessment forecast MD · Partial reset (capped growth)
- Current annual tax
- $2,683 · $224/mo
- Projected year-2 tax
- $2,683 · $224/mo
- Expected delta
- $0/yr ($0/mo · 0.0%)
ⓘ Screening estimate from a state-policy table — verify with the county assessor before closing.
Climate risk First Street
- Flood 1/10 Low FEMA zone X (unshaded) · 0% chance over 30 yrs
- Wildfire 1/10 Low
- Heat 7/10 Severe 7 d/yr ≥103°F today · 15 d/yr by 30 yrs out
- Wind 6/10 Major 27% chance of damaging wind over 30 yrs
- Air quality 4/10 Moderate 6 unhealthy d/yr today · 7 by 30 yrs out
Nearby sold comps map
Loading sold comps map…
Walkable amenities ~0.75 mi
Loading nearby amenities…
Taxation est. · year 1
- Rental income
- $22,978
- − Mortgage interest
- −$8,397
- − Property taxes
- −$2,683
- − Insurance
- −$750
- − Repairs & maintenance
- −$1,838
- − Management
- −$1,838
- − Depreciation
- −$4,361
- Taxable income
- $3,112
- Est. tax owed @ 24.0%
- −$747
- After-tax cash flow
- $4,540/yr
For passive investors: Depreciation is non-cash, so a rental often shows a tax loss while cash-flowing — sheltering income. Rental losses are passive: they offset passive income freely, and up to $25,000/yr can offset ordinary (W-2) income if you actively participate and your MAGI is under $100k (phasing out to $0 by $150k); unused losses carry forward. On sale, claimed depreciation is recaptured at up to 25%, and gains may owe capital-gains tax (a 1031 exchange can defer both). Figures are a year-1 estimate at your 24.0% rate — not tax advice; consult a CPA.
Schools (NCES district)
- District
- Baltimore City Public Schools
- NCES district ID
- 2400090
- Math proficiency
- 7% ▼ -9.00%
- Reading proficiency
- 16% ▼ -5.00%
- Median HH income
- $42,108
- Composite
- 10.08/100
- National rank
- #9805
- State rank
- #24 of 24 in MD
Livability — Baltimore
- Score
- 76/100
- State rank
- #90
- US rank
- #3396
Category grades
Schools grade is shown separately in the Schools card above.
Census & demographics
- Census place
- Baltimore, MD
- County
- Baltimore City · 558,601 people
- City population
- 588,727
- Metro
- Baltimore-Columbia-Towson, MD
- Population (ZIP)
- 44,014
- Household income
- $62,488
- Rent vs Own
- Severe rent burden
- 2564.0
Population outlook (Baltimore County) Hauer SSP2
- Today (2025)
- 624,249 people
- By 2030
- 621,541 · -0.4%
- By 2040
- 609,756 · -2.3%
- By 2050
- 597,249 · -4.3%
- By 2075
- 552,236 · -11.5%
- By 2100
- 513,934 · -17.7%
Race, ethnicity, and origin ACS 2023
- Neighborhood character
- Diverse neighborhood (Simpson 0.58)
- Race & ethnicity
- Black 60% White 26% Two or more races 6% Hispanic / Latino 5% Asian 5%
- Hispanic origin (detail)
- Common ancestry
- Romanian 2% Italian 1% Scotch-Irish 1%
- Foreign-born
- 10% · Canada, China, South Korea
- Languages at home
- 87% English-only · Spanish 4% French/Haitian/Cajun 2% Chinese 2%
Political lean MEDSL · Baltimore
- 2024 margin
- Solid D (+73.0) · D 85.2% · R 12.2% · Other 2.6%
- 2008→2024 swing
- -2.5pp toward R · 2008: 75.5pp · 2024: 73.0pp
- All cycles
- 2024: D+73.0 2020: D+76.6 2016: D+74.6 2012: D+76.4 2008: D+75.5
Not yet ingested
- Civics
- —
Market trends
- HPI YoY
- ▼ -463.14%
- Current HPI
- 292.3986
- Rent YoY
- ▲ 1.63%
- Metro
- Baltimore-Columbia-Towson, MD
- State GDP YoY
- ▲ 2.97%
- F500 in state
- 12
Industry mix (Fortune 500 HQ in MD)
| Industry | F500 HQs | Revenue |
|---|---|---|
| Aerospace / Defense | 1 | $71B |
|
||
| Utilities | 1 | $25B |
|
||
| Hotels | 1 | $24B |
|
||
| Consumer Goods | 1 | $7B |
|
||
| Real Estate | 1 | $6B |
|
||
| Chemicals | 1 | $2B |
|
||
Price history
+808.5% since first listed24 events — show timeline
- 2026-06-05 Listed $149,900 BRIGHT MLS
- 2018-11-05 Sold (Public Records) $95,550 Public Records
- 2017-10-02 Delisted — MRIS
- 2017-08-09 Price Changed — MRIS
- 2017-06-22 Price Changed — MRIS
- 2017-05-09 Listed — MRIS
- 2017-05-09 Listed $119,500 BRIGHT MLS
- 2007-08-13 Delisted — MRIS
- 2007-08-10 Listed — MRIS
- 2007-07-17 Delisted — MRIS
- 2007-03-28 Listed — MRIS
- 2007-03-24 Delisted — MRIS
- 2006-11-28 Listed — MRIS
- 2006-11-15 Delisted — MRIS
- 2006-09-23 Listed — MRIS
- 2006-07-01 Delisted — MRIS
- 2006-03-03 Listed — MRIS
- 2005-02-17 Sold (Public Records) $58,000 Public Records
- 2005-02-14 Sold (MLS) $58,900 MRIS
- 2004-12-15 Delisted — MRIS
- 2004-08-30 Sold (Public Records) $51,200 Public Records
- 2004-08-14 Listed $59,900 MRIS
- 1987-01-20 Sold (Public Records) $25,000 Public Records
- 1984-04-03 Sold (Public Records) $16,500 Public Records
Property tax history
-2.6%/yrLatest (2020): $2,683 · +1.3% YoY. Source: county tax records.
Cash-flow waterfall
monthlySold comps — $/sqft
last 12 mo · ≤1 miLoading sold comps…