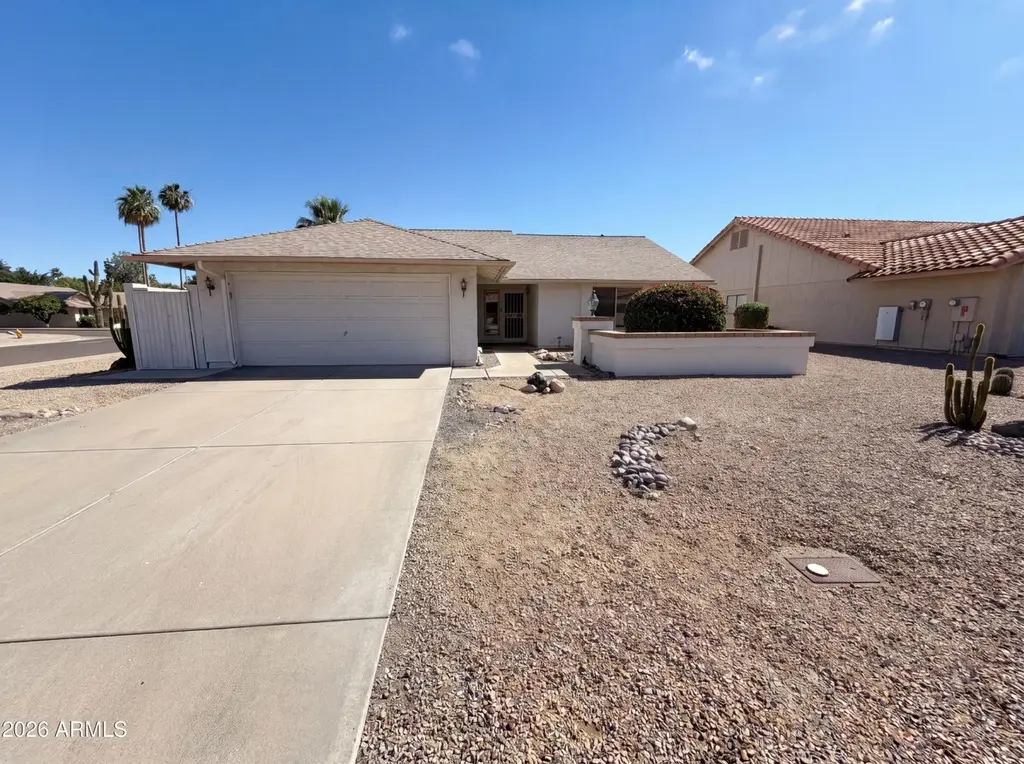
9207 W Kerry Ln · Peoria, AZ
Flood risk 1/10 · Minimal
- FEMA flood zone
- X (shaded)
- Chance of flooding over 30 yrs
- 0.0%
- Est. flood insurance / yr
- $507 – $1,088
Fire risk 2/10 · Minimal
- Est. fire insurance / yr
- $610 – $1,132
Heat risk 9/10 · Severe
- Hot days now (above 113°F)
- 7 days/yr
- Hot days in 30 yrs
- 18 days/yr
Wind risk 1/10 · Minimal
- Chance of severe wind over 30 yrs
- —
Air-quality risk 2/10 · Minimal
- Unhealthy air days now
- 1 days/yr
- Unhealthy air days in 30 yrs
- 1 days/yr
Risk factors via First Street. Map © Google.
Why this score? — see what drove the D grade
The composite is a weighted blend of 9 inputs, each scored 0–100. Each bar is that input's sub-score; the figure is the points it added to the 100-point composite (weight × sub-score).
- ARV discount +15.0/15.0
- Cash flow +8.8/30.0
- Livability +3.8/5.0
- Schools +3.5/10.0
- Condition / age +2.5/5.0
- DSCR +2.4/10.0
- Rent growth +2.3/5.0
- 1% rule +1.8/10.0
- Appreciation +0.0/10.0
$329,000
🖨 Deal sheet 📄 Offer letter ✓ Due diligence
Listing remarks
Imagine 9207 W Kerry Ln, a great home in 55+ community in Westbrook Village featuring fresh interior paint and all stainless steel appliances for contemporary functionality. A comforting fireplace enhances the interior, complemented by a spacious walk in closet in the primary bedroom for organized storage. An exterior patio extends opportunities for outdoor enjoyment. Come experience this wonderful community with golf, community centers and close to Arrowhead amenities. This property is 55+ age restricted. Included 100-Day Home Warranty with buyer activation
Key facts
- Arrowhead amenities
- Walk-in closet
- Exterior patio
Tags
Property features AI
Finance
- Other: Lot size listed as 9,151 (source: Assessor)
- HOA & community: Homeowners association with an annual fee of $819; Association fee includes grounds maintenance
Exterior
- Parking: Covered parking for 2 vehicles; 2 garage spaces
- Security: Owned security system
- Utilities: City water; Public sewer
- Home design: Single family residence; Fee simple ownership
- Construction: Wood frame construction; Painted exterior; Tile roof
- Exterior features: Gravel/stone front and back landscaping; Block fencing
Interior
- Bedrooms: 2 possible bedrooms
- Bathrooms: 2 full bathrooms
- Heating & cooling: Natural gas heating; Cooling system (other)
- Interior features: Full bathroom in the master bedroom; Fireplace; Has heating (natural gas); Has cooling (other)
Neighborhood map
What this means for you Summary
Snapshot
- This is a 2-bed/2.0-bath single-family listed at $329k.
Deal economics
- At list price, monthly cash flow is $-270 ($-3k/yr) — negative.
- To cash-flow at today's rent, offer at most $281k (14.5% below list).
- To meet the 1% rule (rent ≥ 1% of price), the offer needs to be $225k (31.7% below list).
- Recommended offer: $225k (31.7% below list) — sets the bar for 1% rule.
- Cap rate 5.3% vs local median 3.3% in Peoria — top-decile yield for the area; either an underpriced asset or a hidden risk that comps aren't pricing in. Stress-test before assuming the spread holds.
Location & tenants
- Location reads 76/100 on livability (#14 in AZ, #3,603 nationally) — a middle-class / working-renter tenant base. Strengths: housing A+, commute A, employment A; Watch: cost of living C-, amenities D, health & safety F.
- Peoria Unified School District (4237) (suburban): math 36% / reading 42% proficiency, ranked #64 of 249 in AZ (top 26%) — families likely to look elsewhere, expect single-tenant / working-renter base with shorter leases.
- Market conditions: Rents soft (-0.8%/yr); 281 active listings in the ZIP; 40 comparable units currently listed for rent nearby; rentals at typical pace (median 24d on market — plan ~3-4 weeks tenant-placement turnaround); solid renter incomes; 36,011 units permitted in Maricopa County in 2024 (12,801 in 5+ unit buildings).
Forward outlook
- Local home prices are declining (-3.0%/yr); year-one equity from $2k of loan paydown is wiped out by about $10k of value loss. Plan a longer hold.
- Maricopa County population projected at +38% by 2050 — long-run rental-demand tailwind backs the buy-and-hold thesis.
Negotiation context
- It's been on market 42 days — a 3% lower offer ($319k) is reasonable based on typical stale-listing flexibility.
Risks & watch-outs
- Climate carrying-cost: extreme-heat days projected 7→18/yr by 2055 (HVAC capex compounding) — expect insurance premiums to compound above CPI over the hold.
Questions for the listing agent
- What do current leases actually rent for vs. the listed asking? Can we see a recent rent roll and the last 12 months of T-12 income?
- It's been on market 42 days. Have you received any prior offers? Is the seller open to a 32% concession, seller financing, or rate buy-down credit?
- What does the HOA fee cover, when was the last increase, and are there any pending special assessments or reserve-fund shortfalls?
- Is there a deadline driving the sale (1031 exchange, divorce, estate, relocation)? That informs how much negotiation room exists.
- Schools are B-rated — typically a magnet for longer-tenancy family renters. What's the average tenant stay here, and is there a school-zone premium baked into asking?
- The area grade is low — what's the realistic commute time and amenity access for the typical tenant pool here? Any planned neighborhood developments (good or bad) we should know about?
- What's the average days-on-market for RENTAL listings here right now (not sales)? A rising rental-DOM trend means longer vacancies and softer asking-rent achievability than the comps imply.
- What's the recent tenant-quality profile in this submarket — average credit score on applications, eviction rate, late-payment / NSF rate, and stable-employment percentage? A property-management company in the area should have these aggregated.
- How much new for-sale + rental construction is in the pipeline within 1–3 miles? Heavy new supply typically softens prices + rents 12–24 months out; constrained supply supports both.
Investment metrics
- 1% rule
- 0.68% ✗
- Cap rate
- 5.31%
- Cash-on-cash
- -3.52%
- DSCR
- 0.84
- GRM
- 12.2
CMA / ARV
- ARV (median comp)
- $423,311
- List price
- $329,000
- Delta
- -22.28%
- Verdict
- UNDERPRICED
- Comps
- 20 within 1.0 mi
Show comp detail 12 sales within ~0.75 mi
| Address | Dist | Beds/Ba | Sqft | Sold | Price | $/sf | Match |
|---|---|---|---|---|---|---|---|
| 9152 W Oraibi Dr | 0.15mi | 2/2.0 | 1,461 (+12%) | 3mo | $445,000 | $305 | 70 |
| 19929 N 91st Ln | 0.50mi | 2/2.0 | 1,351 (+4%) | 2mo | $422,000 | $312 | 69 |
| 9232 W Behrend Dr | 0.39mi | 2/2.0 | 1,428 (+10%) | 1mo | $285,000 | $200 | 65 |
| 9235 W John Cabot Rd | 0.74mi | 3/2.0 (+1) | 1,307 (+0%) | 0mo | $435,000 | $333 | 60 |
| 9032 W Sierra Pinta Dr | 0.62mi | 2/2.0 | 1,351 (+4%) | 7mo | $418,000 | $309 | 59 |
| 9140 W Behrend Dr | 0.41mi | 2/2.0 | 1,455 (+12%) | 4mo | $420,000 | $289 | 58 |
| 9238 W Behrend Dr | 0.39mi | 2/2.0 | 1,461 (+12%) | 6mo | $320,000 | $219 | 57 |
| 20132 N 92nd Ave | 0.50mi | 2/2.0 | 1,461 (+12%) | 2mo | $430,000 | $294 | 55 |
| 9041 W Escuda Dr | 0.53mi | 2/2.0 | 1,439 (+10%) | 4mo | $385,000 | $268 | 55 |
| 9759 W Taro Ln | 0.70mi | 2/2.0 | 1,202 (-8%) | 4mo | $325,000 | $270 | 51 |
| 19835 N 90th Ln | 0.50mi | 2/2.0 | 1,463 (+12%) | 7mo | $385,000 | $263 | 50 |
| 9013 W Villa Maria Dr | 0.66mi | 3/2.0 (+1) | 1,485 (+14%) | 1mo | $425,000 | $286 | 40 |
Match score weights: distance 35% · size 25% · config 20% · recency 20%. Top-matched comps best support the ARV.
Projected returns pro-forma
-3.0% appreciation · 0.0% rent growth · sell at horizon
- IRR
- -25.3%
- Equity multiple
- 0.16×
- Total profit
- $-77,205
- Equity at exit
- $49,055
- IRR
- -32.4%
- Equity multiple
- -0.25×
- Total profit
- $-115,262
- Equity at exit
- $28,446
Cash invested: $92,120 (down + closing). Projections, not guarantees.
Landlord ↔ Tenant lean methodology
- Overall (STATE)
- 87 Strongly Landlord-Friendly
- State Arizona
- 87 Strongly Landlord-Friendly · R+3
- County
- — inherits STATE
- City
- — inherits STATE
ZIP-level market 85382
- Home prices YoY
- -23.6%
- Rents YoY
- -0.8%
- Active inventory
- 281
- Price-to-rent
- 12.2×
Monthly cashflow live
- Estimated rent
- $2,247 high interval (Pro) →
- Mortgage (P&I)
- −$1,725
- Tax from tax record
- −$115 /mo · $1,382/yr
- Insurance
- −$137
- HOA
- −$68
- Vacancy / Maint / Mgmt
- −$472
- Net cashflow
- $-270
Break-even live
UW: 25.0% down · 7.5% · 30yr · 1.5% tax · 5.0% vac · 8.0% maint · 8.0% mgmt
Financing live
Cash to close
- Down payment
- $82,250
- Closing costs
- $9,870
- Reserves months
- —
- Total cash needed
- —
Loan-product check · same deal, 3 products live
Conventional
25% down · 7.5% · 30yr
- Down + closing
- —
- Monthly P&I
- —
- Monthly cashflow
- —
- DSCR
- —
- Eligible?
- —
Personal DTI + credit; lowest rate.
DSCR
20% down · 8.5% · 30yr
- Down + closing
- —
- Monthly P&I
- —
- Monthly cashflow
- —
- DSCR
- —
- Eligible?
- —
No personal income docs; deal must DSCR.
Hard money
10% down · 12.0% · 12mo
- Down + closing
- —
- Monthly P&I
- —
- Monthly cashflow
- —
- DSCR
- —
- Eligible?
- —
Short-term bridge; refi at stabilization.
Rent comps 40 comps
| Address | Beds | Baths | Sqft | Rent | $/sqft | DOM | Units | Dist |
|---|---|---|---|---|---|---|---|---|
| 9126 W Kimberly Way Peoria, AZ | 2.0 | 2.0 | 1326 | $2,695 | $2.03 | 43d | 1 | 0.23mi |
| 9126 W Kimberly Way Peoria, AZ | 2.0 | 2.0 | 1325 | $2,595 | $1.96 | 24d | 1 | 0.23mi |
| 9264 W Morrow Dr Peoria, AZ | 2.0 | 2.0 | 1001 | $2,350 | $2.35 | 43d | 1 | 0.29mi |
| 9315 W Morrow Dr Peoria, AZ | 2.0 | 2.0 | 909 | $1,695 | $1.86 | 24d | 1 | 0.36mi |
| 19518 N 89th Dr Peoria, AZ | 2.0 | 2.0 | 1574 | $4,000 | $2.54 | 43d | 1 | 0.40mi |
| 18624 N 93rd Ave Peoria, AZ | 2.0 | 2.0 | 1001 | $1,795 | $1.79 | 14d | 1 | 0.42mi |
| 9619 W Taro Ln Peoria, AZ | 2.0 | 2.0 | 1524 | $1,750 | $1.15 | 43d | 1 | 0.45mi |
| 9343 W Escuda Dr Peoria, AZ | 2.0 | 2.0 | 1858 | $3,500 | $1.88 | 24d | 1 | 0.46mi |
| 18942 N 96th Ln Peoria, AZ | 2.0 | 2.0 | 1520 | $1,945 | $1.28 | 5d | 1 | 0.55mi |
| 8818 W Piute Ave Peoria, AZ | 2.0 | 2.0 | 1462 | $3,800 | $2.60 | 43d | 1 | 0.59mi |
| 9029 W Villa Maria Dr Peoria, AZ | 3.0 | 2.0 | 1746 | $2,105 | $1.21 | 3d | 1 | 0.68mi |
| 19609 N 98th Dr Peoria, AZ | 2.0 | 2.0 | 1653 | $2,895 | $1.75 | 43d | 1 | 0.75mi |
| 8731 W McRae Way Peoria, AZ | 3.0 | 2.0 | 1574 | $3,300 | $2.10 | 43d | 1 | 0.76mi |
| 9803 W Kimberly Way Peoria, AZ | 2.0 | 2.0 | 1655 | $1,800 | $1.09 | 24d | 1 | 0.77mi |
| 8646 W Rockwood Dr Peoria, AZ | 2.0 | 1.0 | 1451 | $2,100 | $1.45 | 5d | 1 | 0.79mi |
| 20456 N 94th Ln Peoria, AZ | 3.0 | 2.0 | 1436 | $2,200 | $1.53 | 5d | 1 | 0.82mi |
| 19702 N 98th Ln Peoria, AZ | 2.0 | 2.0 | 1417 | $2,300 | $1.62 | 24d | 1 | 0.86mi |
| 18205 N 87th Dr Peoria, AZ | 3.0 | 3.0 | 1632 | $1,845 | $1.13 | 5d | 1 | 0.92mi |
| 17906 N 92nd Ln Peoria, AZ | 3.0 | 2.0 | 1307 | $2,095 | $1.60 | 5d | 1 | 0.93mi |
| 9833 W Yukon Dr Peoria, AZ | 3.0 | 2.0 | 1667 | $2,100 | $1.26 | 3d | 1 | 0.98mi |
| 9825 W Runion Dr Peoria, AZ | 3.0 | 2.0 | 1667 | $2,400 | $1.44 | 20d | 1 | 1.05mi |
| 9668 W Irma Ln Peoria, AZ | 3.0 | 2.0 | 1400 | $1,895 | $1.35 | 43d | 1 | 1.05mi |
| 9723 W Mohawk Ln Peoria, AZ | 3.0 | 2.0 | 1649 | $1,999 | $1.21 | 43d | 1 | 1.06mi |
| 8810 W Grovers Ave Peoria, AZ | 3.0 | 2.0 | 1308 | $2,060 | $1.57 | 5d | 1 | 1.08mi |
| 9830 W Runion Dr Peoria, AZ | 3.0 | 2.0 | 1283 | $1,985 | $1.55 | 1d | 1 | 1.08mi |
| 9160 W Meadow Dr Peoria, AZ | 3.0 | 2.5 | 1788 | $2,100 | $1.17 | 12d | 1 | 1.08mi |
| 9136 W Meadow Dr Peoria, AZ | 3.0 | 2.5 | 1558 | $2,100 | $1.35 | 24d | 1 | 1.09mi |
| 8374 W Oraibi Dr Peoria, AZ | 2.0 | 1.5 | 1495 | $3,200 | $2.14 | 43d | 1 | 1.09mi |
| 17374 N 89th Ave Unit C1 Peoria, AZ | 3.0 | 2.0 | 1147 | $1,745 | $1.52 | 24d | 1 | 1.14mi |
| 17374 N 89th Ave Unit B2 Peoria, AZ | 2.0 | 2.0 | 1114 | $1,476 | $1.32 | 20d | 1 | 1.14mi |
| 8363 W Audrey Ln Peoria, AZ | 3.0 | 2.0 | 1615 | $2,009 | $1.24 | 43d | 1 | 1.15mi |
| 17374 N 89th Ave Peoria, AZ | 2.0 | 2.0 | 1067 | $1,586 | $1.49 | 24d | 1 | 1.23mi |
| 17374 N 89th Ave Peoria, AZ | 3.0 | 2.0 | 1147 | $1,914 | $1.67 | 21d | 1 | 1.23mi |
| 21234 N 94th Ln Peoria, AZ | 3.0 | 2.0 | 1867 | $2,205 | $1.18 | 14d | 1 | 1.25mi |
| 21234 N 94th Ln Peoria, AZ | 3.0 | 2.0 | 1867 | $2,420 | $1.30 | 43d | 1 | 1.25mi |
| 9477 W Frank Ave Peoria, AZ | 3.0 | 2.0 | 1250 | $2,100 | $1.68 | 43d | 1 | 1.25mi |
| 8820 W Bell Rd Peoria, AZ | 1.0–2.0 | 1.5–2.0 | 1038 | $1,701 | $1.64 | 1d | 16 | 1.38mi |
| 8201 W Beardsley Rd Peoria, AZ | 1.0–2.0 | 1.0–2.0 | 930 | $1,550 | $1.67 | 5d | 19 | 1.38mi |
| 10134 W Mohawk Ln Peoria, AZ | 2.0 | 1.0–2.0 | 827 | $1,299 | $1.57 | 43d | 1 | 1.38mi |
| 10134 W Mohawk Ln Peoria, AZ | 1.0–2.0 | 1.0–2.0 | 992 | $1,400 | $1.41 | 12d | 5 | 1.40mi |
HOA detail
- Monthly dues
- $68 · $816/yr
Listing history 20 events
-
2026-06-18days on market $329,000 Active 42 DOM
-
2026-06-18price $329,000 Active 41 DOM
-
2026-06-17days on market $339,000 Active 41 DOM
-
2026-06-16days on market $339,000 Active 40 DOM
-
2026-06-15days on market $339,000 Active 39 DOM
-
2026-06-13days on market $339,000 Active 37 DOM
-
2026-06-13days on market $339,000 Active 36 DOM
-
2026-06-09days on market $339,000 Active 33 DOM
-
2026-06-08days on market $339,000 Active 32 DOM
-
2026-06-07days on market $339,000 Active 31 DOM
-
2026-06-04pricedays on market $339,000 Active 28 DOM
-
2026-06-03days on market $349,000 Active 27 DOM
-
2026-06-02days on market $349,000 Active 26 DOM
-
2026-06-01days on market $349,000 Active 25 DOM
-
2026-05-31days on market $349,000 Active 24 DOM
-
2026-05-07$360,000 Active 565-char remark
-
2026-04-27soldstatus $326,100
-
1993-10-19soldstatus $87,900
-
1990-10-16soldstatus $82,500
-
1986-06-17soldstatus $80,540
ⓘ Source: listings_history table (triggers on properties + properties_extension) + one-shot
backfill from property_details.listing_events for pre-trigger history.
Tax reassessment forecast AZ · Resets to sale price
- Current annual tax
- $1,382 · $115/mo
- Projected year-2 tax
- $2,171 · $181/mo
- Expected delta
- +$789/yr (+$66/mo · 57.1%)
ⓘ Screening estimate from a state-policy table — verify with the county assessor before closing.
Climate risk First Street
- Flood 1/10 Low FEMA zone X (shaded) · 0% chance over 30 yrs
- Wildfire 2/10 Low
- Heat 9/10 Extreme 7 d/yr ≥113°F today · 18 d/yr by 30 yrs out
- Wind 1/10 Low
- Air quality 2/10 Low 1 unhealthy d/yr today · 1 by 30 yrs out
Nearby sold comps map
Loading sold comps map…
Walkable amenities ~0.75 mi
Loading nearby amenities…
Taxation est. · year 1
- Rental income
- $26,970
- − Mortgage interest
- −$18,429
- − Property taxes
- −$1,382
- − Insurance
- −$1,645
- − Repairs & maintenance
- −$2,158
- − Management
- −$2,158
- − HOA
- −$816
- − Depreciation
- −$9,571
- Taxable loss
- −$9,188
- Est. tax savings @ 24.0%
- +$2,205
- After-tax cash flow
- $-1,035/yr
For passive investors: Depreciation is non-cash, so a rental often shows a tax loss while cash-flowing — sheltering income. Rental losses are passive: they offset passive income freely, and up to $25,000/yr can offset ordinary (W-2) income if you actively participate and your MAGI is under $100k (phasing out to $0 by $150k); unused losses carry forward. On sale, claimed depreciation is recaptured at up to 25%, and gains may owe capital-gains tax (a 1031 exchange can defer both). Figures are a year-1 estimate at your 24.0% rate — not tax advice; consult a CPA.
Schools (NCES district)
- District
- Peoria Unified School District (4237)
- NCES district ID
- 0406250
- Math proficiency
- 36% ▼ -14.00%
- Reading proficiency
- 42% ▼ -8.00%
- Median HH income
- $60,171
- Composite
- 34.62/100
- National rank
- #5152
- State rank
- #64 of 249 in AZ
Livability — Peoria
- Score
- 76/100
- State rank
- #14
- US rank
- #3603
Category grades
Schools grade is shown separately in the Schools card above.
Census & demographics
- Census place
- Peoria, AZ
- County
- Maricopa County · 4,537,380 people
- City population
- 206,687
- Metro
- Phoenix-Mesa-Chandler, AZ
- Population (ZIP)
- 43,729
- Household income
- $91,525
- Rent vs Own
- Severe rent burden
- 1350.0
Population outlook (Maricopa County) Hauer SSP2
- Today (2025)
- 4,979,203 people
- By 2030
- 5,378,229 · +8.0%
- By 2040
- 6,156,598 · +23.6%
- By 2050
- 6,872,376 · +38.0%
- By 2075
- 8,401,270 · +68.7%
- By 2100
- 9,247,439 · +85.7%
Race, ethnicity, and origin ACS 2023
- Neighborhood character
- Predominantly White (72%)
- Race & ethnicity
- White 72% Hispanic / Latino 15% Two or more races 12% Asian 5% Black 2%
- Hispanic origin (detail)
- Mexican 11%
- Common ancestry
- Romanian 4% Italian 2% Lithuanian 2%
- Foreign-born
- 12% · Canada, China, Vietnam
- Languages at home
- 83% English-only · Spanish 7% Arabic 2% Other Indo-European 2%
Political lean MEDSL · Maricopa
- 2024 margin
- Toss-up / Even · D 47.7% · R 51.2% · Other 1.1%
- 2008→2024 swing
- +7.1pp toward D · 2008: -10.6pp · 2024: -3.5pp
- All cycles
- 2024: R+3.5 2020: D+2.2 2016: R+3.5 2012: R+12.0 2008: R+10.6
Not yet ingested
- Civics
- —
Market trends
- HPI YoY
- ▼ -86.44%
- Current HPI
- 280.5805
- Rent YoY
- ▼ -0.80%
- Metro
- Phoenix-Mesa-Chandler, AZ
- State GDP YoY
- ▲ 4.54%
- F500 in state
- 20
Industry mix (Fortune 500 HQ in AZ)
| Industry | F500 HQs | Revenue |
|---|---|---|
| Technology | 2 | $13B |
|
||
| Mining / Metals | 1 | $23B |
|
||
| Environmental Services | 1 | $16B |
|
||
| Metals / Steel | 1 | $14B |
|
||
| Technology Distribution | 1 | $9B |
|
||
| Homebuilding | 1 | $8B |
|
||
Price history
+308.5% since first listed8 events — show timeline
- 2026-06-18 Price Changed $329,000 ARMLS
- 2026-06-04 Price Changed $339,000 ARMLS
- 2026-05-21 Price Changed $349,000 ARMLS
- 2026-05-07 Listed $360,000 ARMLS
- 2026-04-27 Sold (Public Records) $326,100 Public Records
- 1993-10-19 Sold (Public Records) $87,900 Public Records
- 1990-10-16 Sold (Public Records) $82,500 Public Records
- 1986-06-17 Sold (Public Records) $80,540 Public Records
Property tax history
+0.4%/yrLatest (2025): $1,382 · +2.8% YoY. Source: county tax records.
Cash-flow waterfall
monthlySold comps — $/sqft
last 12 mo · ≤1 miLoading sold comps…