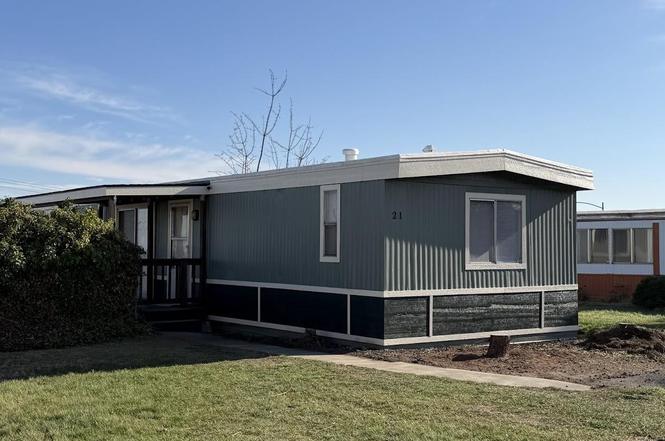
2917 W 19th Ave #21 · Kennewick, WA
Flood risk 1/10 · Minimal
- FEMA flood zone
- X
- Chance of flooding over 30 yrs
- 0.0%
- Est. flood insurance / yr
- $507 – $1,088
Fire risk 4/10 · Minor
- Est. fire insurance / yr
- $604 – $1,122
Heat risk 4/10 · Minor
- Hot days now (above 97°F)
- 7 days/yr
- Hot days in 30 yrs
- 14 days/yr
Wind risk 1/10 · Minimal
- Chance of severe wind over 30 yrs
- —
Air-quality risk 8/10 · Major
- Unhealthy air days now
- 14 days/yr
- Unhealthy air days in 30 yrs
- 15 days/yr
Risk factors via First Street. Map © Google.
Why this score? — see what drove the C+ grade
The composite is a weighted blend of 9 inputs, each scored 0–100. Each bar is that input's sub-score; the figure is the points it added to the 100-point composite (weight × sub-score).
- Cash flow +30.0/30.0
- 1% rule +10.0/10.0
- DSCR +10.0/10.0
- Schools +4.6/10.0
- Livability +3.9/5.0
- Rent growth +2.5/5.0
- Condition / age +2.5/5.0
- ARV discount +0.0/15.0
- Appreciation +0.0/10.0
$99,500
🖨 Deal sheet (PDF) 📄 Offer letter ✓ Due diligence
Listing remarks
MLS# 290132 Offered here is a beautifully remodeled 3bed/2ba home located in the desirable Cherry Hill MFH Park in Kennewick. This home has been thoughtfully updated throughout by a licensed contractor and is truly move-in-ready! Recent improvements include a new Snow Cap roof system with a 10 yr material warranty, new exterior paint, trim and a new deck with overhang- perfect for outdoor enjoyment. Inside you'll find fresh interior paint, all new trim, baseboards, casings, along with new carpet and pad and waterproof luxury vinyl plank flooring. The kitchen shines with solid slab granite countertops, custom painted cabinetry with new hardware, a new stainless steel sink, faucet and garbage
Key facts
- New exterior paint
- New carpet and pad
- Remodeled home
Tags
Neighborhood map
What this means for you Summary
Snapshot
- This is a 3-bed/2.0-bath manufactured listed at $100k.
Deal economics
- At list price, monthly cash flow is $644 ($8k/yr) — positive.
- The deal already cash-flows at list — no discount required.
- Meets the 1% rule at list price ($2k rent vs $100k).
- Recommended offer: $94k (6.0% below list) — sets the bar for market timing.
- Cap rate 14.1% vs local median 3.3% in Kennewick — top-decile yield for the area; either an underpriced asset or a hidden risk that comps aren't pricing in. Stress-test before assuming the spread holds.
Location & tenants
- Location reads 78/100 on livability (#131 in WA, #2,599 nationally) — a middle-class / working-renter tenant base. Strengths: commute A+, housing A+, health & safety A; Watch: amenities D+, crime F.
- Kennewick School District (urban): math 43% / reading 58% proficiency, ranked #141 of 291 in WA (top 48%) — acceptable for families but not a draw, mixed tenant base, ~2y average lease.
- Zoned schools: Southgate Elementary School (440 students, 67% FRL); Highlands Middle School (750 students, 84% FRL); Southridge High School (1,641 students, 55% FRL) — zoned schools average 68% FRL vs 48% district-wide (21 pts higher); higher-poverty schools than district average — tighter screening recommended.
- Market conditions: 249 active listings in the ZIP; 29 comparable units currently listed for rent nearby; rentals at typical pace (median 23d on market — plan ~3-4 weeks tenant-placement turnaround); solid renter incomes; 1,532 units permitted in Benton County in 2024 (389 in 5+ unit buildings).
Forward outlook
- Local home prices are declining (-3.0%/yr); year-one equity from $688 of loan paydown is wiped out by about $3k of value loss. Plan a longer hold.
- Benton County population projected at +32% by 2050 — long-run rental-demand tailwind backs the buy-and-hold thesis.
- At projected returns (-3.0% appreciation + 3.0% rent growth), your $28k cash investment doubles in ~5 years — after that, you're playing with house money.
Negotiation context
- It's been on market 72 days — a 6% lower offer ($94k) is reasonable based on typical stale-listing flexibility.
Questions for the listing agent
- It's been on market 72 days. Have you received any prior offers? Is the seller open to a 6% concession, seller financing, or rate buy-down credit?
- Why hasn't it sold? Are there any deal-killer items the seller is aware of (foundation, flood, title, zoning, code violations)?
- Is there a deadline driving the sale (1031 exchange, divorce, estate, relocation)? That informs how much negotiation room exists.
- Schools are D-rated, which usually means shorter tenancies and higher turnover. Who's the typical renter profile here, and what's been the actual vacancy rate?
- Crime grade is F in this area — have there been break-ins, vandalism, or insurance claims at this property in the last 3 years? What carrier currently insures it and at what premium?
- What's the average days-on-market for RENTAL listings here right now (not sales)? A rising rental-DOM trend means longer vacancies and softer asking-rent achievability than the comps imply.
- What's the recent tenant-quality profile in this submarket — average credit score on applications, eviction rate, late-payment / NSF rate, and stable-employment percentage? A property-management company in the area should have these aggregated.
- How much new for-sale + rental construction is in the pipeline within 1–3 miles? Heavy new supply typically softens prices + rents 12–24 months out; constrained supply supports both.
Investment metrics
- 1% rule
- 1.69% ✓
- Cap rate
- 14.07%
- Cash-on-cash
- 27.76%
- DSCR
- 2.24
- GRM
- 4.9
CMA / ARV
- ARV (on-the-fly)
- $70,224
- Comps found
- 9
Show comp detail 9 sales within ~0.75 mi
| Address | Dist | Beds/Ba | Sqft | Sold | Price | $/sf | Match |
|---|---|---|---|---|---|---|---|
| 2917 W 19th Ave #22 | 0.01mi | 2/2.0 (-1) | 1,002 (+8%) | 1mo | $95,000 | $95 | 80 |
| 2917 W 19th Ave, #17 Ave #17 | 0.05mi | 2/2.0 (-1) | 924 (0%) | 21mo | $20,000 | $22 | 76 |
| 2917 W 19th Avenue, #1 Ave #1 | 0.20mi | 2/1.0 (-1) | 840 (-9%) | 2mo | $75,000 | $89 | 65 |
| 3324 W 19th Ave #191 | 0.58mi | 2/2.0 (-1) | 924 (0%) | 4mo | $67,000 | $73 | 65 |
| 3324 19th Ave #88 Ave #88 | 0.59mi | 2/2.0 (-1) | 924 (0%) | 6mo | $15,000 | $16 | 63 |
| 3324 W 19th Ave #81 | 0.55mi | 2/1.0 (-1) | 924 (0%) | 13mo | $70,000 | $76 | 55 |
| 3324 W 19th Ave #109 | 0.54mi | 2/2.0 (-1) | 980 (+6%) | 12mo | $78,000 | $80 | 50 |
| 3324 W 19th Ave #146 | 0.49mi | 2/1.0 (-1) | 924 (0%) | 23mo | $68,000 | $74 | 49 |
| 3324 W 19th Ave #45 | 0.60mi | 2/1.0 (-1) | 896 (-3%) | 20mo | $71,000 | $79 | 42 |
Match score weights: distance 35% · size 25% · config 20% · recency 20%. Top-matched comps best support the ARV.
Projected returns pro-forma
-3.0% appreciation · 3.0% rent growth · sell at horizon
- IRR
- 21.9%
- Equity multiple
- 1.90×
- Total profit
- $24,950
- Equity at exit
- $14,836
- IRR
- 29.9%
- Equity multiple
- 3.68×
- Total profit
- $74,685
- Equity at exit
- $8,603
Cash invested: $27,860 (down + closing). Projections, not guarantees.
Landlord ↔ Tenant lean methodology
- Overall (STATE)
- 28 Tenant-Leaning
- State Washington
- 28 Tenant-Leaning · D+8
- County
- — inherits STATE
- City
- — inherits STATE
ZIP-level market 99337
- Active inventory
- 249
- Price-to-rent
- 4.9×
Monthly cashflow live
- Estimated rent
- $1,686 high interval (Pro) →
- Mortgage (P&I)
- −$522
- Tax est. 1.5%
- −$124 /mo · $1,492/yr
- Insurance
- −$41
- HOA
- −$0
- Vacancy / Maint / Mgmt
- −$354
- Net cashflow
- $644
Break-even live
Sensitivity live
| Price | -10% $713 | -5% $679 | +0% $644 | +5% $610 | +10% $576 |
|---|---|---|---|---|---|
| Rent | -10% $511 | -5% $578 | +0% $644 | +5% $711 | +10% $778 |
| Rate | -1.0pp $695 | -0.5pp $670 | base $644 | +0.5pp $619 | +1.0pp $592 |
UW: 25.0% down · 7.5% · 30yr · 1.5% tax · 5.0% vac · 8.0% maint · 8.0% mgmt
Financing live
Cash to close
- Down payment
- $24,875
- Closing costs
- $2,985
- Reserves months
- —
- Total cash needed
- —
Loan-product check · same deal, 3 products live
Conventional
25% down · 7.5% · 30yr
- Down + closing
- —
- Monthly P&I
- —
- Monthly cashflow
- —
- DSCR
- —
- Eligible?
- —
Personal DTI + credit; lowest rate.
DSCR
20% down · 8.5% · 30yr
- Down + closing
- —
- Monthly P&I
- —
- Monthly cashflow
- —
- DSCR
- —
- Eligible?
- —
No personal income docs; deal must DSCR.
Hard money
10% down · 12.0% · 12mo
- Down + closing
- —
- Monthly P&I
- —
- Monthly cashflow
- —
- DSCR
- —
- Eligible?
- —
Short-term bridge; refi at stabilization.
Rent comps 29 comps
| Address | Beds | Baths | Sqft | Rent | $/sqft | DOM | Units | Dist |
|---|---|---|---|---|---|---|---|---|
| 2652 W 15th Ave Kennewick, WA | 2.0–3.0 | 2.0 | 1152 | $1,899 | $1.65 | 15d | 5 | 0.52mi |
| 3611 W 17th Pl Unit A Kennewick, WA | 2.0 | 1.0 | 970 | $1,495 | $1.54 | 22d | 1 | 0.63mi |
| 1816 W 21st Ave Unit C Kennewick, WA | 3.0 | 2.0 | 1120 | $1,495 | $1.33 | 15d | 1 | 0.66mi |
| 4112 W 24th Ave Kennewick, WA | 1.0–2.0 | 1.0–2.0 | 681 | $1,875 | $2.75 | 22d | 4 | 0.82mi |
| 3113 W 7th Ave Unit D110 Kennewick, WA | 2.0 | 2.5 | 1000 | $1,750 | $1.75 | 15d | 1 | 1.01mi |
| 1608 W 14th Ave Unit 1614 Kennewick, WA | 2.0 | 1.0 | 750 | $995 | $1.33 | 22d | 1 | 1.02mi |
| 3426 W 7th Ave Kennewick, WA | 2.0 | 2.0 | 1000 | $1,600 | $1.60 | 22d | 1 | 1.11mi |
| 3426 W 7th Ave Unit A130 Kennewick, WA | 2.0 | 2.0 | 1000 | $1,650 | $1.65 | 45d | 1 | 1.11mi |
| 513 S Anderson St Kennewick, WA | 2.0 | 1.0 | 720 | $1,495 | $2.08 | 22d | 1 | 1.12mi |
| 500 S Conway Pl Unit 500 Kennewick, WA | 2.0 | 1.0 | 950 | $1,500 | $1.58 | 45d | 1 | 1.13mi |
| 3708 W 6th Ave Unit B Kennewick, WA | 2.0 | 1.0 | 918 | $1,325 | $1.44 | 45d | 1 | 1.23mi |
| 1110 S Newport St Unit 1110ne B Kennewick, WA | 2.0 | 2.0 | 995 | $1,300 | $1.31 | 45d | 1 | 1.26mi |
| 455 S Morain St Kennewick, WA | 2.0 | 1.0 | 775 | $1,950 | $2.52 | 45d | 1 | 1.26mi |
| 1702 W 7th Pl Unit B Kennewick, WA | 2.0 | 1.0 | 950 | $1,050 | $1.11 | 45d | 1 | 1.27mi |
| 1618 W 7th Pl Unit A Kennewick, WA | 2.0 | 1.0 | 920 | $1,050 | $1.14 | 45d | 1 | 1.27mi |
| 3120 W 4th Ave Kennewick, WA | 2.0 | 1.0 | 963 | $1,550 | $1.61 | 15d | 1 | 1.30mi |
| 3120 W 4th Ave Unit 360 Kennewick, WA | 2.0 | 1.0 | 963 | $1,550 | $1.61 | 45d | 1 | 1.31mi |
| 3120 W 4th Ave Apt 120 Kennewick, WA | 2.0 | 1.0 | 963 | $1,625 | $1.69 | 15d | 1 | 1.31mi |
| 325 S Johnson St Kennewick, WA | 2.0 | 1.5 | 1100 | $1,495 | $1.36 | 45d | 1 | 1.33mi |
| 400 S Morain St #7 Kennewick, WA | 3.0 | 2.5 | 1100 | $1,500 | $1.36 | 22d | 1 | 1.33mi |
| 130 S Conway Pl Kennewick, WA | 2.0 | 1.0 | 852 | $1,299 | $1.52 | 15d | 1 | 1.35mi |
| 1105 W 10th Ave Kennewick, WA | 1.0–2.0 | 1.0 | 687 | $1,306 | $1.90 | 15d | 8 | 1.37mi |
| 1619 W 5th Ave Unit A Kennewick, WA | 2.0 | 1.0 | 981 | $1,450 | $1.48 | 22d | 1 | 1.37mi |
| 119 S Conway Pl Kennewick, WA | 2.0 | 1.0 | 711 | $1,200 | $1.69 | 22d | 1 | 1.44mi |
| 505 S Olympia St Kennewick, WA | 2.0 | 1.0 | 695 | $1,525 | $2.19 | 45d | 1 | 1.46mi |
| 1114 W 10th Ave Kennewick, WA | 3.0 | 1.0–2.0 | 829 | $1,551 | $1.87 | 15d | 41 | 1.47mi |
| 505 S Olympia St Apt H1 Kennewick, WA | 3.0 | 1.0 | 890 | $1,675 | $1.88 | 45d | 1 | 1.49mi |
| 505 S Olympia St Unit 1326 K3 Kennewick, WA | 3.0 | 1.0 | 945 | $1,650 | $1.75 | 22d | 1 | 1.49mi |
| 505 S Olympia St Apt E4 Kennewick, WA | 2.0 | 1.0 | 695 | $1,285 | $1.85 | 15d | 1 | 1.49mi |
Listing history 2 events
-
2026-04-11status Pending
-
2026-01-29$99,500 Active
ⓘ Source: listings_history table (triggers on properties + properties_extension) + one-shot
backfill from property_details.listing_events for pre-trigger history.
Climate risk First Street
- Flood 1/10 Low FEMA zone X · 0% chance over 30 yrs
- Wildfire 4/10 Moderate
- Heat 4/10 Moderate 7 d/yr ≥97°F today · 14 d/yr by 30 yrs out
- Wind 1/10 Low
- Air quality 8/10 Severe 14 unhealthy d/yr today · 15 by 30 yrs out
Nearby sold comps map
Loading sold comps map…
Walkable amenities ~0.75 mi
Loading nearby amenities…
Taxation est. · year 1
- Rental income
- $20,235
- − Mortgage interest
- −$5,574
- − Property taxes
- −$1,492
- − Insurance
- −$498
- − Repairs & maintenance
- −$1,619
- − Management
- −$1,619
- − Depreciation
- −$2,895
- Taxable income
- $6,539
- Est. tax owed @ 24.0%
- −$1,569
- After-tax cash flow
- $6,165/yr
For passive investors: Depreciation is non-cash, so a rental often shows a tax loss while cash-flowing — sheltering income. Rental losses are passive: they offset passive income freely, and up to $25,000/yr can offset ordinary (W-2) income if you actively participate and your MAGI is under $100k (phasing out to $0 by $150k); unused losses carry forward. On sale, claimed depreciation is recaptured at up to 25%, and gains may owe capital-gains tax (a 1031 exchange can defer both). Figures are a year-1 estimate at your 24.0% rate — not tax advice; consult a CPA.
Schools (NCES district)
- District
- Kennewick School District
- NCES district ID
- 5303930
- Math proficiency
- 43% ▼ -1.00%
- Reading proficiency
- 58% ▬ 0.00%
- Median HH income
- $54,191
- Composite
- 45.56/100
- National rank
- #5667
- State rank
- #141 of 291 in WA
Livability — Kennewick
- Score
- 78/100
- State rank
- #131
- US rank
- #2599
Category grades
Schools grade is shown separately in the Schools card above.
Census & demographics
- Census place
- Kennewick, WA
- County
- Benton County · 186,895 people
- City population
- 104,655
- Metro
- Kennewick-Richland, WA
- Population (ZIP)
- 33,287
- Household income
- $98,848
- Rent vs Own
- Severe rent burden
- 430.0
Population outlook (Benton County) Hauer SSP2
- Today (2025)
- 219,421 people
- By 2030
- 233,813 · +6.6%
- By 2040
- 262,134 · +19.5%
- By 2050
- 290,100 · +32.2%
- By 2075
- 363,525 · +65.7%
- By 2100
- 418,667 · +90.8%
Race, ethnicity, and origin ACS 2023
- Neighborhood character
- Predominantly White (67%)
- Race & ethnicity
- White 67% Hispanic / Latino 26% Two or more races 13% Asian 1% Black 1%
- Hispanic origin (detail)
- Mexican 24%
- Common ancestry
- Lithuanian 4% Portuguese 3% Iranian 2%
- Foreign-born
- 12% · Canada, Vietnam
- Languages at home
- 76% English-only · Spanish 20% Russian/Polish/Slavic 2%
Political lean MEDSL · Benton
- 2024 margin
- Strong R (+21.9) · D 37.7% · R 59.6% · Other 2.7%
- 2008→2024 swing
- +4.2pp toward D · 2008: -26.1pp · 2024: -21.9pp
- All cycles
- 2024: R+21.9 2020: R+21.0 2016: R+26.6 2012: R+27.0 2008: R+26.1
Not yet ingested
- Civics
- —
Market trends
- HPI YoY
- ▼ -260.38%
- Current HPI
- 245.5375
- Rent YoY
- —
- Metro
- Kennewick-Richland, WA
- State GDP YoY
- ▲ 4.65%
- F500 in state
- 22
Industry mix (Fortune 500 HQ in WA)
| Industry | F500 HQs | Revenue |
|---|---|---|
| Retail | 2 | $269B |
|
||
| Technology / Retail | 1 | $638B |
|
||
| Technology | 1 | $245B |
|
||
| Telecommunications | 1 | $38B |
|
||
| Food / Beverage | 1 | $36B |
|
||
| Automotive / Trucks | 1 | $34B |
|
||
Price history
2 events — show timeline
- 2026-04-11 Pending — PACMLS
- 2026-01-29 Listed $99,500 PACMLS
Property tax history
+1.0%/yrLatest (2026): $148 · -5.7% YoY. Source: county tax records.
Cash-flow waterfall
monthlySold comps — $/sqft
last 12 mo · ≤1 miLoading sold comps…