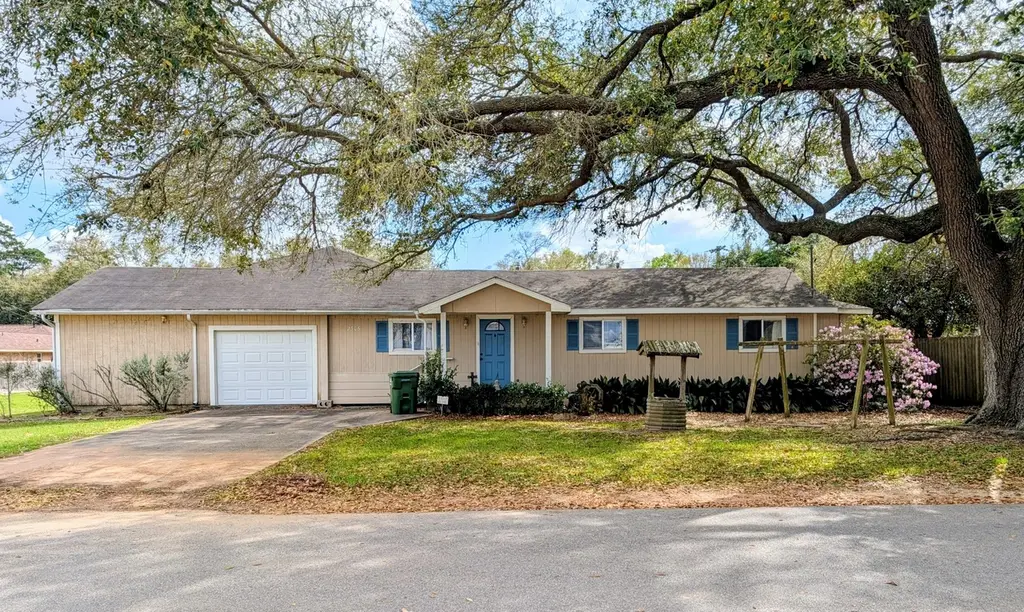
2506 Heights St · Liberty, TX
Flood risk 1/10 · Minimal
- FEMA flood zone
- X (shaded)
- Chance of flooding over 30 yrs
- 0.0%
- Est. flood insurance / yr
- $507 – $1,088
Fire risk 2/10 · Minimal
- Est. fire insurance / yr
- $1,222 – $2,270
Heat risk 9/10 · Severe
- Hot days now (above 113°F)
- 7 days/yr
- Hot days in 30 yrs
- 25 days/yr
Wind risk 9/10 · Severe
- Chance of severe wind over 30 yrs
- 99.0%
Air-quality risk 2/10 · Minimal
- Unhealthy air days now
- 1 days/yr
- Unhealthy air days in 30 yrs
- 1 days/yr
Risk factors via First Street. Map © Google.
Why this score? — see what drove the C grade
The composite is a weighted blend of 9 inputs, each scored 0–100. Each bar is that input's sub-score; the figure is the points it added to the 100-point composite (weight × sub-score).
- Cash flow +19.4/30.0
- ARV discount +15.0/15.0
- 1% rule +6.1/10.0
- DSCR +6.1/10.0
- Livability +3.4/5.0
- Schools +3.2/10.0
- Rent growth +2.5/5.0
- Condition / age +2.5/5.0
- Appreciation +0.0/10.0
$162,500
🖨 Deal sheet (PDF) 📄 Offer letter ✓ Due diligence
Listing remarks MLS
Opportunity awaits with this spacious 3-bedroom, 2-bath home full of potential! Inside, you’ll find a functional layout with comfortable living spaces and an extra-large bonus living area at the rear of the house—perfect for a family room, game room, or entertaining space. The attached garage offers added convenience and includes two large storage closets for all your tools and seasonal items. While some repairs and updates are needed, this property is a great chance to add your personal touch and build equity. As an added bonus, the sale includes an extra lot next to the home, providing additional space for expansion, recreation, or investment potential. Don’t miss this value-packed property with room to grow!
Key facts
- Extra lot
- Attached garage
- Functional layout
Tags
Neighborhood map
What this means for you Summary
Snapshot
- This is a 3-bed/2.0-bath single-family listed at $162k.
Deal economics
- At list price, monthly cash flow is $183 ($2k/yr) — positive.
- The deal already cash-flows at list — no discount required.
- Meets the 1% rule at list price ($2k rent vs $162k).
- Recommended offer: $148k (9.0% below list) — sets the bar for market timing.
- Cap rate 7.6% vs local median 4.6% in Liberty — top-decile yield for the area; either an underpriced asset or a hidden risk that comps aren't pricing in. Stress-test before assuming the spread holds.
Location & tenants
- Location reads 68/100 on livability (#489 in TX) — a middle-class / working-renter tenant base. Strengths: cost of living A+, housing A+, health & safety A; Watch: employment D+, schools F, amenities F.
- Liberty ISD (town): math 34% / reading 41% proficiency, ranked #464 of 826 in TX (top 56%) — families likely to look elsewhere, expect single-tenant / working-renter base with shorter leases.
- Market conditions: 224 active listings in the ZIP; 3 comparable units currently listed for rent nearby; rentals leasing fast (median 13d on market — plan ~1-2 weeks tenant-placement turnaround); 1,321 units permitted in Liberty County in 2024 (0 in 5+ unit buildings).
Forward outlook
- Local home prices are declining (-3.0%/yr); year-one equity from $1k of loan paydown is wiped out by about $5k of value loss. Plan a longer hold.
- Liberty County population projected at +24% by 2050 — long-run rental-demand tailwind backs the buy-and-hold thesis.
Negotiation context
- It's been on market 107 days — a 9% lower offer ($148k) is reasonable based on typical stale-listing flexibility.
- 2 sale attempts with the ask held roughly flat each time — persistent listings suggest the price (not the market) is what's stuck; bring a comps-based counter.
Risks & watch-outs
- Watch-outs: built in 1950 — expect roof / HVAC / electrical / plumbing capex.
- Climate carrying-cost: severe wind risk, 99% chance of damaging wind over 30y; extreme-heat days projected 7→25/yr by 2055 (HVAC capex compounding) — expect insurance premiums to compound above CPI over the hold.
Questions for the listing agent
- It's been on market 107 days. Have you received any prior offers? Is the seller open to a 9% concession, seller financing, or rate buy-down credit?
- Built in 1950 — when were the roof, HVAC, electrical panel, plumbing, and water heater last replaced?
- Why hasn't it sold? Are there any deal-killer items the seller is aware of (foundation, flood, title, zoning, code violations)?
- Is there a deadline driving the sale (1031 exchange, divorce, estate, relocation)? That informs how much negotiation room exists.
- Schools are F-rated, which usually means shorter tenancies and higher turnover. Who's the typical renter profile here, and what's been the actual vacancy rate?
- What's the average days-on-market for RENTAL listings here right now (not sales)? A rising rental-DOM trend means longer vacancies and softer asking-rent achievability than the comps imply.
- What's the recent tenant-quality profile in this submarket — average credit score on applications, eviction rate, late-payment / NSF rate, and stable-employment percentage? A property-management company in the area should have these aggregated.
- How much new for-sale + rental construction is in the pipeline within 1–3 miles? Heavy new supply typically softens prices + rents 12–24 months out; constrained supply supports both.
Investment metrics
- 1% rule
- 1.11% ✓
- Cap rate
- 7.64%
- Cash-on-cash
- 4.82%
- DSCR
- 1.21
- GRM
- 7.5
CMA / ARV
- ARV (median comp)
- $200,460
- List price
- $162,500
- Delta
- -18.94%
- Verdict
- UNDERPRICED
- Comps
- 20 within 1.0 mi
Show comp detail 12 sales within ~0.75 mi
| Address | Dist | Beds/Ba | Sqft | Sold | Price | $/sf | Match |
|---|---|---|---|---|---|---|---|
| 1610 Texas St | 0.14mi | 4/2.0 (+1) | 1,816 (+2%) | 15mo | $194,900 | $107 | 74 |
| 2418 Hollywood Ave | 0.36mi | 3/2.0 | 1,690 (-6%) | 2mo | $255,000 | $151 | 72 |
| 1827 N San Jacinto | 0.23mi | 3/2.0 | 1,708 (-5%) | 11mo | $289,000 | $169 | 72 |
| 2000 Adams St | 0.32mi | 3/2.0 | 1,695 (-5%) | 13mo | $210,000 | $124 | 65 |
| 1805 Willow St | 0.49mi | 3/2.0 | 1,616 (-10%) | 2mo | $214,999 | $133 | 59 |
| 1814 Magnolia St | 0.46mi | 3/3.0 | 1,867 (+4%) | 10mo | $289,900 | $155 | 59 |
| 2422 Hollywood Ave | 0.37mi | 3/2.0 | 1,620 (-10%) | 9mo | $250,000 | $154 | 59 |
| 2306 Hollywood Ave | 0.37mi | 4/2.0 (+1) | 2,001 (+12%) | 5mo | $245,000 | $122 | 54 |
| 916 Woods Dr | 0.65mi | 4/3.0 (+1) | 1,786 (-0%) | 8mo | $235,000 | $132 | 53 |
| 1609 Bowie St | 0.75mi | 4/2.0 (+1) | 1,885 (+5%) | 2mo | $248,000 | $132 | 50 |
| 121 Regal Ln | 0.70mi | 3/2.0 | 1,928 (+8%) | 9mo | $325,000 | $169 | 47 |
| 125 Hillside Dr | 0.66mi | 3/2.0 | 1,632 (-9%) | 13mo | $299,000 | $183 | 43 |
Match score weights: distance 35% · size 25% · config 20% · recency 20%. Top-matched comps best support the ARV.
Projected returns pro-forma
-3.0% appreciation · 3.0% rent growth · sell at horizon
- IRR
- -8.7%
- Equity multiple
- 0.68×
- Total profit
- $-14,591
- Equity at exit
- $24,229
- IRR
- 0.8%
- Equity multiple
- 1.06×
- Total profit
- $2,685
- Equity at exit
- $14,050
Cash invested: $45,500 (down + closing). Projections, not guarantees.
Landlord ↔ Tenant lean methodology
- Overall (STATE)
- 87 Strongly Landlord-Friendly
- State Texas
- 87 Strongly Landlord-Friendly · R+5
- County
- — inherits STATE
- City
- — inherits STATE
ZIP-level market 77575
- Home prices YoY
- -26.6%
- Active inventory
- 224
- Price-to-rent
- 7.5×
Monthly cashflow live
- Estimated rent
- $1,798 medium interval (Pro) →
- Mortgage (P&I)
- −$852
- Tax from tax record
- −$318 /mo · $3,814/yr
- Insurance
- −$68
- HOA
- −$0
- Vacancy / Maint / Mgmt
- −$378
- Net cashflow
- $183
Break-even live
Sensitivity live
| Price | -10% $275 | -5% $229 | +0% $183 | +5% $137 | +10% $91 |
|---|---|---|---|---|---|
| Rent | -10% $41 | -5% $112 | +0% $183 | +5% $254 | +10% $325 |
| Rate | -1.0pp $265 | -0.5pp $224 | base $183 | +0.5pp $141 | +1.0pp $98 |
UW: 25.0% down · 7.5% · 30yr · 1.5% tax · 5.0% vac · 8.0% maint · 8.0% mgmt
Financing live
Cash to close
- Down payment
- $40,625
- Closing costs
- $4,875
- Reserves months
- —
- Total cash needed
- —
Loan-product check · same deal, 3 products live
Conventional
25% down · 7.5% · 30yr
- Down + closing
- —
- Monthly P&I
- —
- Monthly cashflow
- —
- DSCR
- —
- Eligible?
- —
Personal DTI + credit; lowest rate.
DSCR
20% down · 8.5% · 30yr
- Down + closing
- —
- Monthly P&I
- —
- Monthly cashflow
- —
- DSCR
- —
- Eligible?
- —
No personal income docs; deal must DSCR.
Hard money
10% down · 12.0% · 12mo
- Down + closing
- —
- Monthly P&I
- —
- Monthly cashflow
- —
- DSCR
- —
- Eligible?
- —
Short-term bridge; refi at stabilization.
Rent comps 3 comps
| Address | Beds | Baths | Sqft | Rent | $/sqft | DOM | Units | Dist |
|---|---|---|---|---|---|---|---|---|
| 1110 Woods Dr Liberty, TX | 2.0 | 2.0 | 1236 | $1,575 | $1.27 | 13d | 1 | 0.55mi |
| 1709 Richardson Rd Liberty, TX | 4.0 | 2.5 | 2251 | $2,024 | $0.90 | 13d | 1 | 0.74mi |
| 3304 Lincoln St Liberty, TX | 3.0 | 2.0 | 1735 | $1,850 | $1.07 | 44d | 1 | 1.35mi |
Listing history 19 events
-
2026-06-21days on market $162,500 Active 107 DOM
-
2026-06-18days on market $162,500 Active 104 DOM
-
2026-06-17days on market $162,500 Active 103 DOM
-
2026-06-16days on market $162,500 Active 102 DOM
-
2026-06-15days on market $162,500 Active 101 DOM
-
2026-06-13days on market $162,500 Active 99 DOM
-
2026-06-13days on market $162,500 Active 98 DOM
-
2026-06-09days on market $162,500 Active 95 DOM
-
2026-06-08days on market $162,500 Active 94 DOM
-
2026-06-07days on market $162,500 Active 93 DOM
-
2026-06-04days on market $162,500 Active 90 DOM
-
2026-06-03days on market $162,500 Active 89 DOM
-
2026-06-02days on market $162,500 Active 88 DOM
-
2026-06-01days on market $162,500 Active 87 DOM
-
2026-05-31days on market $162,500 Active 86 DOM
-
2026-04-09price $162,500 738-char remark
Show marketing remark (738 chars)
Opportunity awaits with this spacious 3-bedroom, 2-bath home full of potential! Inside, you’ll find a functional layout with comfortable living spaces and an extra-large bonus living area at the rear of the house—perfect for a family room, game room, or entertaining space. The attached garage offers added convenience and includes two large storage closets for all your tools and seasonal items. While some repairs and updates are needed, this property is a great chance to add your personal touch and build equity. As an added bonus, the sale includes an extra lot next to the home, providing additional space for expansion, recreation, or investment potential. Don’t miss this value-packed property with room to grow!
-
2026-04-02status Active 738-char remark
Show marketing remark (738 chars)
Opportunity awaits with this spacious 3-bedroom, 2-bath home full of potential! Inside, you’ll find a functional layout with comfortable living spaces and an extra-large bonus living area at the rear of the house—perfect for a family room, game room, or entertaining space. The attached garage offers added convenience and includes two large storage closets for all your tools and seasonal items. While some repairs and updates are needed, this property is a great chance to add your personal touch and build equity. As an added bonus, the sale includes an extra lot next to the home, providing additional space for expansion, recreation, or investment potential. Don’t miss this value-packed property with room to grow!
-
2026-03-30status Pending 738-char remark
Show marketing remark (738 chars)
Opportunity awaits with this spacious 3-bedroom, 2-bath home full of potential! Inside, you’ll find a functional layout with comfortable living spaces and an extra-large bonus living area at the rear of the house—perfect for a family room, game room, or entertaining space. The attached garage offers added convenience and includes two large storage closets for all your tools and seasonal items. While some repairs and updates are needed, this property is a great chance to add your personal touch and build equity. As an added bonus, the sale includes an extra lot next to the home, providing additional space for expansion, recreation, or investment potential. Don’t miss this value-packed property with room to grow!
-
2026-03-06$165,000 Active 738-char remark
Show marketing remark (738 chars)
Opportunity awaits with this spacious 3-bedroom, 2-bath home full of potential! Inside, you’ll find a functional layout with comfortable living spaces and an extra-large bonus living area at the rear of the house—perfect for a family room, game room, or entertaining space. The attached garage offers added convenience and includes two large storage closets for all your tools and seasonal items. While some repairs and updates are needed, this property is a great chance to add your personal touch and build equity. As an added bonus, the sale includes an extra lot next to the home, providing additional space for expansion, recreation, or investment potential. Don’t miss this value-packed property with room to grow!
ⓘ Source: listings_history table (triggers on properties + properties_extension) + one-shot
backfill from property_details.listing_events for pre-trigger history.
Tax reassessment forecast TX · Resets to sale price
- Current annual tax
- $3,814 · $318/mo
- Projected year-2 tax
- $3,814 · $318/mo
- Expected delta
- $0/yr ($0/mo · -0.0%)
ⓘ Screening estimate from a state-policy table — verify with the county assessor before closing.
Climate risk First Street
- Flood 1/10 Low FEMA zone X (shaded) · 0% chance over 30 yrs
- Wildfire 2/10 Low
- Heat 9/10 Extreme 7 d/yr ≥113°F today · 25 d/yr by 30 yrs out
- Wind 9/10 Extreme 99% chance of damaging wind over 30 yrs
- Air quality 2/10 Low 1 unhealthy d/yr today · 1 by 30 yrs out
Nearby sold comps map
Loading sold comps map…
Walkable amenities ~0.75 mi
Loading nearby amenities…
Taxation est. · year 1
- Rental income
- $21,578
- − Mortgage interest
- −$9,103
- − Property taxes
- −$3,814
- − Insurance
- −$812
- − Repairs & maintenance
- −$1,726
- − Management
- −$1,726
- − Depreciation
- −$4,727
- Taxable loss
- −$331
- Est. tax savings @ 24.0%
- +$79
- After-tax cash flow
- $2,273/yr
For passive investors: Depreciation is non-cash, so a rental often shows a tax loss while cash-flowing — sheltering income. Rental losses are passive: they offset passive income freely, and up to $25,000/yr can offset ordinary (W-2) income if you actively participate and your MAGI is under $100k (phasing out to $0 by $150k); unused losses carry forward. On sale, claimed depreciation is recaptured at up to 25%, and gains may owe capital-gains tax (a 1031 exchange can defer both). Figures are a year-1 estimate at your 24.0% rate — not tax advice; consult a CPA.
Schools (NCES district)
- District
- Liberty ISD
- NCES district ID
- 4827450
- Math proficiency
- 34% ▼ -7.00%
- Reading proficiency
- 41% ▼ -1.00%
- Median HH income
- $46,931
- Composite
- 32.11/100
- National rank
- #5803
- State rank
- #464 of 826 in TX
Livability — Liberty
- Score
- 68/100
- State rank
- #489
- US rank
- #9688
Category grades
Schools grade is shown separately in the Schools card above.
Census & demographics
- Census place
- Liberty, TX
- City population
- 16,617
- Population (ZIP)
- 16,617
Population outlook (Liberty County) Hauer SSP2
- Today (2025)
- 87,956 people
- By 2030
- 92,161 · +4.8%
- By 2040
- 100,784 · +14.6%
- By 2050
- 109,471 · +24.5%
- By 2075
- 133,470 · +51.7%
- By 2100
- 147,372 · +67.6%
Race, ethnicity, and origin ACS 2023
- Neighborhood character
- Diverse neighborhood (Simpson 0.61)
- Race & ethnicity
- White 56% Hispanic / Latino 25% Black 12% Two or more races 11%
- Hispanic origin (detail)
- Mexican 24%
- Common ancestry
- Lithuanian 4% Serbian 2% Slovak 2%
- Foreign-born
- 12% · Canada
- Languages at home
- 80% English-only · Spanish 19% Other Asian/Pacific 1%
Political lean MEDSL · Liberty
- 2024 margin
- Solid R (+61.6) · D 19.0% · R 80.6%
- 2008→2024 swing
- -17.9pp toward R · 2008: -43.7pp · 2024: -61.6pp
- All cycles
- 2024: R+61.6 2020: R+59.7 2016: R+58.0 2012: R+53.3 2008: R+43.7
Not yet ingested
- Civics
- —
Market trends
- HPI YoY
- ▼ -74.17%
- Current HPI
- 204.9372
- Rent YoY
- —
- Metro
- —
- State GDP YoY
- ▲ 3.95%
- F500 in state
- 110
Industry mix (Fortune 500 HQ in TX)
| Industry | F500 HQs | Revenue |
|---|---|---|
| Energy | 16 | $1,198B |
|
||
| Technology | 5 | $198B |
|
||
| Engineering / Construction | 4 | $72B |
|
||
| Energy Services | 3 | $60B |
|
||
| Utilities | 3 | $41B |
|
||
| Healthcare | 2 | $330B |
|
||
Price history
-1.5% since first listed4 events — show timeline
- 2026-04-09 Price Changed $162,500 HARMLS
- 2026-04-02 Relisted — HARMLS
- 2026-03-30 Pending — HARMLS
- 2026-03-06 Listed $165,000 HARMLS
Property tax history
+5.3%/yrLatest (2025): $3,814 · +5.6% YoY. Source: county tax records.
Cash-flow waterfall
monthlySold comps — $/sqft
last 12 mo · ≤1 miLoading sold comps…