 Duplex
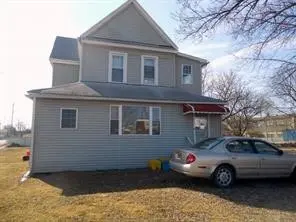
306 Booth Avenue Ave · Endicott, NY
Flood risk 7/10 · Major
- FEMA flood zone
- X (shaded)
- Chance of flooding over 30 yrs
- 0.72%
- Est. flood insurance / yr
- $473 – $860
Fire risk 1/10 · Minimal
- Est. fire insurance / yr
- $691 – $1,283
Heat risk 3/10 · Minor
- Hot days now (above 93°F)
- 7 days/yr
- Hot days in 30 yrs
- 16 days/yr
Wind risk 2/10 · Minimal
- Chance of severe wind over 30 yrs
- 2.0%
Air-quality risk 2/10 · Minimal
- Unhealthy air days now
- 0 days/yr
- Unhealthy air days in 30 yrs
- 1 days/yr
Risk factors via First Street. Map © Google.
Why this score? — see what drove the B grade
The composite is a weighted blend of 9 inputs, each scored 0–100. Each bar is that input's sub-score; the figure is the points it added to the 100-point composite (weight × sub-score).
- Cash flow +30.0/30.0
- DSCR +10.0/10.0
- 1% rule +9.7/10.0
- ARV discount +9.5/15.0
- Rent growth +4.3/5.0
- Schools +4.3/10.0
- Livability +3.5/5.0
- Condition / age +2.5/5.0
- Appreciation +0.0/10.0
$179,000
🖨 Deal sheet 📄 Offer letter ✓ Due diligence
Multi-family units
County records classify this as Multi-Family (2-4 Unit). Listing-text estimate: 2 units. confirmed
Listing remarks MLS
Welcome to this lovely two-family, perfect for an owner occupying one unit and renting the second, or for the new or seasoned investor who wishes to rent both units. The covered front porch has been newly converted into an enclosed front porch, and a half bath has been added to the first floor for convenience. New heating system. Call your favorite real estate professional to take a look.
Key facts
- Covered front porch
- Half bath
- New heating system
Tags
Neighborhood map
What this means for you Summary
Snapshot
- This is a 2 × 2-bed/1.8-bath units multifamily listed at $179k.
Deal economics
- At list price, monthly cash flow is $737 ($9k/yr) — positive. Per door: $368/mo.
- The deal already cash-flows at list — no discount required.
- Meets the 1% rule at list price ($3k rent vs $179k).
- Recommended offer: $158k (12.0% below list) — sets the bar for market timing.
- Cap rate 11.6% vs local median 5.5% in Endicott — top-decile yield for the area; either an underpriced asset or a hidden risk that comps aren't pricing in. Stress-test before assuming the spread holds.
Location & tenants
- Location reads 70/100 on livability (#438 in NY) — a middle-class / working-renter tenant base. Strengths: cost of living A+, health & safety A+, housing A; Watch: schools D+, amenities D, crime F.
- Union-Endicott Central School District (suburban): math 43% / reading 57% proficiency, ranked #387 of 590 in NY (top 66%) — acceptable for families but not a draw, mixed tenant base, ~2y average lease.
- Market conditions: Rents rising fast (+7.1%/yr); 213 active listings in the ZIP; 3 comparable units currently listed for rent nearby; rentals at typical pace (median 21d on market — plan ~3-4 weeks tenant-placement turnaround); 340 units permitted in Broome County in 2024 (269 in 5+ unit buildings).
- At $2,628/mo this rent would consume 48% of the median local household income ($66k/yr) (locally 1480% of renters already pay >50% of income on rent) — very limited rent-growth headroom before tenants either downsize or default.
Forward outlook
- Local home prices are declining (-3.0%/yr); year-one equity from $1k of loan paydown is wiped out by about $5k of value loss. Plan a longer hold.
- Broome County population projected at -13% by 2050 — secular population decline; favor cash flow + early exit over multi-decade hold.
- At projected returns (-3.0% appreciation + 7.1% rent growth), your $50k cash investment doubles in ~6 years — after that, you're playing with house money.
Negotiation context
- It's been on market 155 days — a 12% lower offer ($158k) is reasonable based on typical stale-listing flexibility.
- 5 sale attempts since 7y ago with the ask held roughly flat each time — persistent listings suggest the price (not the market) is what's stuck; bring a comps-based counter.
- Current owner paid $20k; list at $179k implies a 795% gain — meaningful room to come down on a strong offer.
Risks & watch-outs
- Watch-outs: flood insurance adds $56/mo; built in 1920 — expect roof / HVAC / electrical / plumbing capex.
- Climate carrying-cost: major flood risk — expect insurance premiums to compound above CPI over the hold.
Questions for the listing agent
- It's been on market 155 days. Have you received any prior offers? Is the seller open to a 12% concession, seller financing, or rate buy-down credit?
- Can we see the unit-by-unit rent roll, current vacancy, and any below-market leases? What's the average tenancy length?
- What capital expenditures (roof, boiler, parking lot, exteriors) have been made in the last 5 years, and what's planned in the next 2?
- Built in 1920 — when were the roof, HVAC, electrical panel, plumbing, and water heater last replaced?
- What's the actual annual flood-insurance premium (NFIP or private), and is the property in a SFHA with mandatory coverage?
- Why hasn't it sold? Are there any deal-killer items the seller is aware of (foundation, flood, title, zoning, code violations)?
- Is there a deadline driving the sale (1031 exchange, divorce, estate, relocation)? That informs how much negotiation room exists.
- Schools are D-rated, which usually means shorter tenancies and higher turnover. Who's the typical renter profile here, and what's been the actual vacancy rate?
- Crime grade is F in this area — have there been break-ins, vandalism, or insurance claims at this property in the last 3 years? What carrier currently insures it and at what premium?
- What's the average days-on-market for RENTAL listings here right now (not sales)? A rising rental-DOM trend means longer vacancies and softer asking-rent achievability than the comps imply.
- What's the recent tenant-quality profile in this submarket — average credit score on applications, eviction rate, late-payment / NSF rate, and stable-employment percentage? A property-management company in the area should have these aggregated.
- How much new apartment / multifamily construction is in the pipeline within 1–3 miles? Heavy new supply (>2% of stock underway) typically softens rents 12–24 months out; light construction supports rent growth.
Investment metrics
- 1% rule
- 1.47% ✓
- Cap rate
- 11.60%
- Cash-on-cash
- 18.97%
- DSCR
- 1.84
- GRM
- 5.7
CMA / ARV
- ARV (median comp)
- $187,187
- List price
- $179,000
- Delta
- -4.37%
- Verdict
- FAIR
- Comps
- 20 within 1.0 mi
Show comp detail 8 sales within ~0.75 mi
| Address | Dist | Beds/Ba | Sqft | Sold | Price | $/sf | Match |
|---|---|---|---|---|---|---|---|
| 106 Fillmore Ave | 0.42mi | 4/2.0 | 2,020 (-1%) | 0mo | $74,000 | $37 | 79 |
| 203 Parsons Ave | 0.33mi | 5/2.0 (+1) | 1,873 (-8%) | 3mo | $155,000 | $83 | 64 |
| 710 Monroe St | 0.43mi | 4/2.0 | 2,164 (+6%) | 14mo | $110,000 | $51 | 58 |
| 304 E Edwards St | 0.55mi | 4/2.0 | 1,952 (-4%) | 13mo | $192,000 | $98 | 57 |
| 206 E Edwards St | 0.60mi | 4/2.0 | 2,200 (+8%) | 6mo | $235,000 | $107 | 54 |
| 3 Parsons Ave | 0.47mi | 5/2.0 (+1) | 1,872 (-8%) | 11mo | $125,000 | $67 | 50 |
| 1707 Tracy St Unit - 2 bldgs | 0.61mi | 4/2.0 | 2,247 (+10%) | 8mo | $243,900 | $109 | 48 |
| 401 E Franklin St | 0.59mi | 4/2.0 | 1,832 (-10%) | 20mo | $99,900 | $55 | 39 |
Match score weights: distance 35% · size 25% · config 20% · recency 20%. Top-matched comps best support the ARV.
Projected returns pro-forma
-3.0% appreciation · 7.09% rent growth · sell at horizon
- IRR
- 13.9%
- Equity multiple
- 1.58×
- Total profit
- $29,275
- Equity at exit
- $26,689
- IRR
- 25.8%
- Equity multiple
- 3.73×
- Total profit
- $136,598
- Equity at exit
- $15,477
Cash invested: $50,120 (down + closing). Projections, not guarantees.
Landlord ↔ Tenant lean methodology
- Overall (STATE)
- 15 Strongly Tenant-Friendly
- State New York
- 15 Strongly Tenant-Friendly · D+10
- County
- — inherits STATE
- City
- — inherits STATE
ZIP-level market 13760
- Home prices YoY
- -32.7%
- Rents YoY
- 7.1%
- Active inventory
- 213
- Price-to-rent
- 11.4×
Monthly cashflow live
- Estimated rent
- $2,628 high interval (Pro) →
- Mortgage (P&I)
- −$939
- Tax from tax record
- −$271 /mo · $3,248/yr
- Insurance
- −$75
- Flood insurance flood zone
- −$56 /mo · $666/yr
- HOA
- −$0
- Vacancy / Maint / Mgmt
- −$552
- Net cashflow
- $737
Break-even live
2-unit breakdown (identical units grouped — click to expand)
| Units | Beds | Baths | Est. rent |
|---|---|---|---|
| 2× units | 2 | 1.8 | $2,628 |
| #1 | 2 | 1.8 | $1,314 |
| #2 | 2 | 1.8 | $1,314 |
| Total (2 units) | $2,628 | ||
UW: 25.0% down · 7.5% · 30yr · 1.5% tax · 5.0% vac · 8.0% maint · 8.0% mgmt
Financing live
Cash to close
- Down payment
- $44,750
- Closing costs
- $5,370
- Reserves months
- —
- Total cash needed
- —
Loan-product check · same deal, 3 products live
Conventional
25% down · 7.5% · 30yr
- Down + closing
- —
- Monthly P&I
- —
- Monthly cashflow
- —
- DSCR
- —
- Eligible?
- —
Personal DTI + credit; lowest rate.
DSCR
20% down · 8.5% · 30yr
- Down + closing
- —
- Monthly P&I
- —
- Monthly cashflow
- —
- DSCR
- —
- Eligible?
- —
No personal income docs; deal must DSCR.
Hard money
10% down · 12.0% · 12mo
- Down + closing
- —
- Monthly P&I
- —
- Monthly cashflow
- —
- DSCR
- —
- Eligible?
- —
Short-term bridge; refi at stabilization.
Rent comps 3 comps
| Address | Beds | Baths | Sqft | Rent | $/sqft | DOM | Units | Dist |
|---|---|---|---|---|---|---|---|---|
| 208 S Liberty Ave Unit 2 Endicott, NY | 3.0 | 1.0 | 2376 | $1,700 | $0.72 | 21d | 1 | 0.63mi |
| 9 S Seward Ave Endicott, NY | 3.0 | 1.5 | 1800 | $2,000 | $1.11 | 21d | 1 | 1.34mi |
| 409 Milan Ave Endicott, NY | 5.0 | 2.0 | 2240 | $2,350 | $1.05 | 43d | 1 | 1.34mi |
Listing history 26 events
-
2026-06-19days on market $179,000 Active 155 DOM
-
2026-06-18days on market $179,000 Active 154 DOM
-
2026-06-17days on market $179,000 Active 153 DOM
-
2026-06-16days on market $179,000 Active 152 DOM
-
2026-06-15days on market $179,000 Active 151 DOM
-
2026-06-14days on market $179,000 Active 149 DOM
-
2026-06-13days on market $179,000 Active 148 DOM
-
2026-06-10days on market $179,000 Active 146 DOM
-
2026-06-09days on market $179,000 Active 145 DOM
-
2026-06-08days on market $179,000 Active 144 DOM
-
2026-06-07days on market $179,000 Active 143 DOM
-
2026-06-05days on market $179,000 Active 140 DOM
-
2026-06-03days on market $179,000 Active 139 DOM
-
2026-06-02days on market $179,000 Active 138 DOM
-
2026-06-01days on market $179,000 Active 137 DOM
-
2026-05-31days on market $179,000 Active 136 DOM
-
2026-05-30days on market $179,000 Active 135 DOM
-
2026-01-15$179,000 Active 391-char remark
Show marketing remark (391 chars)
Welcome to this lovely two-family, perfect for an owner occupying one unit and renting the second, or for the new or seasoned investor who wishes to rent both units. The covered front porch has been newly converted into an enclosed front porch, and a half bath has been added to the first floor for convenience. New heating system. Call your favorite real estate professional to take a look.
-
2024-12-19$199,000 Active
-
2024-07-23status Active
-
2023-08-25status Pending
-
2023-08-12historical
-
2020-09-15historical
-
2020-06-09$95,500
-
2019-03-22$95,500
-
2000-05-11soldstatus $20,000
ⓘ Source: listings_history table (triggers on properties + properties_extension) + one-shot
backfill from property_details.listing_events for pre-trigger history.
Tax reassessment forecast NY · Partial reset (capped growth)
- Current annual tax
- $3,248 · $271/mo
- Projected year-2 tax
- $3,248 · $271/mo
- Expected delta
- $0/yr ($0/mo · 0.0%)
ⓘ Screening estimate from a state-policy table — verify with the county assessor before closing.
Climate risk First Street
- Flood 7/10 Severe FEMA zone X (shaded) · 72% chance over 30 yrs
- Wildfire 1/10 Low
- Heat 3/10 Moderate 7 d/yr ≥93°F today · 16 d/yr by 30 yrs out
- Wind 2/10 Low 2% chance of damaging wind over 30 yrs
- Air quality 2/10 Low 0 unhealthy d/yr today · 1 by 30 yrs out
Nearby sold comps map
Loading sold comps map…
Walkable amenities ~0.75 mi
Loading nearby amenities…
Taxation est. · year 1
- Rental income
- $31,536
- − Mortgage interest
- −$10,027
- − Property taxes
- −$3,248
- − Insurance
- −$1,562
- − Repairs & maintenance
- −$2,523
- − Management
- −$2,523
- − Depreciation
- −$5,207
- Taxable income
- $6,447
- Est. tax owed @ 24.0%
- −$1,547
- After-tax cash flow
- $7,293/yr
For passive investors: Depreciation is non-cash, so a rental often shows a tax loss while cash-flowing — sheltering income. Rental losses are passive: they offset passive income freely, and up to $25,000/yr can offset ordinary (W-2) income if you actively participate and your MAGI is under $100k (phasing out to $0 by $150k); unused losses carry forward. On sale, claimed depreciation is recaptured at up to 25%, and gains may owe capital-gains tax (a 1031 exchange can defer both). Figures are a year-1 estimate at your 24.0% rate — not tax advice; consult a CPA.
Schools (NCES district)
- District
- Union-Endicott Central School District
- NCES district ID
- 3610710
- Math proficiency
- 43% ▼ -9.00%
- Reading proficiency
- 57% ▲ 11.00%
- Median HH income
- $49,265
- Composite
- 42.66/100
- National rank
- #3176
- State rank
- #387 of 590 in NY
Livability — Endicott
- Score
- 70/100
- State rank
- #438
- US rank
- #7657
Category grades
Schools grade is shown separately in the Schools card above.
Census & demographics
- Census place
- Endicott, NY
- County
- Broome County · 126,805 people
- City population
- 42,896
- Metro
- Binghamton, NY
- Population (ZIP)
- 42,896
- Household income
- $66,095
- Rent vs Own
- Severe rent burden
- 1480.0
Population outlook (Broome County) Hauer SSP2
- Today (2025)
- 187,989 people
- By 2030
- 183,066 · -2.6%
- By 2040
- 172,228 · -8.4%
- By 2050
- 163,161 · -13.2%
- By 2075
- 153,641 · -18.3%
- By 2100
- 140,851 · -25.1%
Race, ethnicity, and origin ACS 2023
- Neighborhood character
- Predominantly White (84%)
- Race & ethnicity
- White 84% Two or more races 7% Hispanic / Latino 6% Black 4% Asian 2%
- Hispanic origin (detail)
- Puerto Rican 2%
- Common ancestry
- Romanian 6% Lithuanian 2% Slovak 2%
- Foreign-born
- 5% · Canada, China
- Languages at home
- 94% English-only · Spanish 2% Other Indo-European 1% Russian/Polish/Slavic 1%
Political lean MEDSL · Broome
- 2024 margin
- Toss-up / Even · D 50.2% · R 49.8%
- 2008→2024 swing
- -7.6pp toward R · 2008: 8.0pp · 2024: 0.4pp
- All cycles
- 2024: D+0.4 2020: D+3.5 2016: R+3.7 2012: D+4.6 2008: D+8.0
Not yet ingested
- Civics
- —
Market trends
- HPI YoY
- ▼ -131.29%
- Current HPI
- 270.2661
- Rent YoY
- ▲ 7.09%
- Metro
- Binghamton, NY
- State GDP YoY
- ▲ 2.60%
- F500 in state
- 92
Industry mix (Fortune 500 HQ in NY)
| Industry | F500 HQs | Revenue |
|---|---|---|
| Financial Services | 10 | $950B |
|
||
| Consumer Goods | 9 | $162B |
|
||
| Insurance | 4 | $225B |
|
||
| Telecommunications | 2 | $144B |
|
||
| Pharmaceuticals | 2 | $112B |
|
||
| Media / Entertainment | 2 | $69B |
|
||
Price history
+795.0% since first listed9 events — show timeline
- 2026-01-15 Listed $179,000 GBAOR
- 2024-12-19 Listed $199,000 GBAOR
- 2024-07-23 Relisted — GBAOR
- 2023-08-25 Pending — GBAOR
- 2023-08-12 Delisted — GBAOR
- 2020-09-15 Delisted — GBAOR
- 2020-06-09 Listed $95,500 GBAOR
- 2019-03-22 Listed $95,500 GBAOR
- 2000-05-11 Sold (Public Records) $20,000 Public Records
Property tax history
+4.7%/yrLatest (2025): $3,248 · +3.4% YoY. Source: county tax records.
Cash-flow waterfall
monthlySold comps — $/sqft
last 12 mo · ≤1 miLoading sold comps…