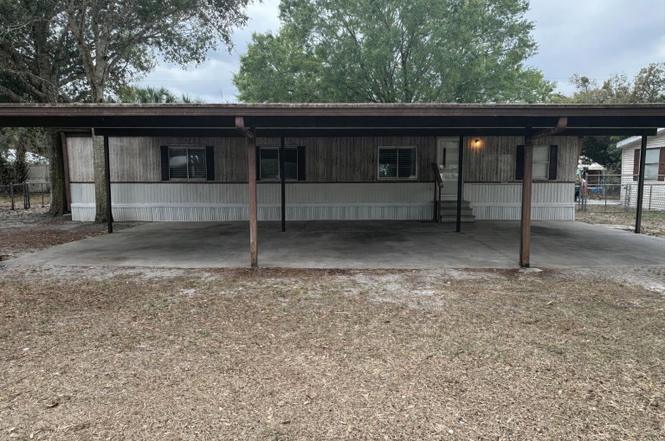
4254 SE 22nd Ct · Taylor Creek, FL
Flood risk 1/10 · Minimal
- FEMA flood zone
- X (unshaded)
- Chance of flooding over 30 yrs
- 0.0%
- Est. flood insurance / yr
- $507 – $1,088
Fire risk 4/10 · Minor
- Est. fire insurance / yr
- $947 – $1,759
Heat risk 9/10 · Severe
- Hot days now (above 108°F)
- 7 days/yr
- Hot days in 30 yrs
- 24 days/yr
Wind risk 10/10 · Severe
- Chance of severe wind over 30 yrs
- 99.0%
Air-quality risk 2/10 · Minimal
- Unhealthy air days now
- 1 days/yr
- Unhealthy air days in 30 yrs
- 2 days/yr
Risk factors via First Street. Map © Google.
Why this score? — see what drove the C- grade
The composite is a weighted blend of 9 inputs, each scored 0–100. Each bar is that input's sub-score; the figure is the points it added to the 100-point composite (weight × sub-score).
- Cash flow +24.2/30.0
- DSCR +7.8/10.0
- 1% rule +5.8/10.0
- ARV discount +4.9/15.0
- Schools +3.6/10.0
- Livability +2.8/5.0
- Rent growth +2.5/5.0
- Condition / age +2.5/5.0
- Appreciation +0.0/10.0
$169,000
🖨 Deal sheet (PDF) 📄 Offer letter ✓ Due diligence
Listing remarks MLS
NICE DOUBLE WIDE MOBILE IN TREASURE ISLAND, LARGE COVERED FRONT PORCH, COVERED PARKING.
Key facts
- Large family room
- Brand new kitchen
- Huge adjacent shed
Tags
Property features AI
Finance
- Other: Pets allowed with no restrictions; Property recorded as resale
Exterior
- Parking: Covered carport with 3 spaces
- Utilities: Public water available; Septic tank; Three-phase electric
- Home design: Manufactured home; Single-story
- Construction: Aluminum siding
- Exterior features: Entry-level living area; Not waterfront
Interior
- Kitchen: Disposal; Electric range; Refrigerator
- Bedrooms: 3 bedrooms on the main level
- Flooring: Carpet; Laminate; Vinyl
- Bathrooms: 2 full bathrooms on the main level
- Heating & cooling: Central heating; Central air; Ceiling fans; Electric cooling
- Interior features: Built-in features; Walk-in closet(s); Unfurnished
- Laundry & utility: Indoor laundry; Washer hookup; Laundry tub
Neighborhood map
What this means for you Summary
Snapshot
- This is a 3-bed/2.0-bath manufactured listed at $169k.
Deal economics
- At list price, monthly cash flow is $336 ($4k/yr) — positive.
- The deal already cash-flows at list — no discount required.
- Meets the 1% rule at list price ($2k rent vs $169k).
- Recommended offer: $154k (9.0% below list) — sets the bar for market timing.
- Cap rate 8.7% vs local median 4.1% in Taylor Creek — top-decile yield for the area; either an underpriced asset or a hidden risk that comps aren't pricing in. Stress-test before assuming the spread holds.
Location & tenants
- Location reads 56/100 on livability (#874 in FL) — a working-class tenant base; expect higher turnover. Strengths: cost of living A+, housing A+, crime B+; Watch: schools F, amenities F, commute F.
- Okeechobee (town): math 44% / reading 42% proficiency, ranked #58 of 73 in FL (top 80%) — families likely to look elsewhere, expect single-tenant / working-renter base with shorter leases; 72% free/reduced lunch — lower-income household profile, screen leases tightly.
- Market conditions: 402 active listings in the ZIP; 18 units permitted in Okeechobee County in 2024 (0 in 5+ unit buildings).
- This rent runs 41% of the median local income ($53k/yr) — at the standard rent-burdened threshold; future hikes will face affordability resistance.
Forward outlook
- Local home prices are declining (-3.0%/yr); year-one equity from $1k of loan paydown is wiped out by about $5k of value loss. Plan a longer hold.
- Okeechobee County population projected at -21% by 2050 — secular population decline; favor cash flow + early exit over multi-decade hold.
Negotiation context
- It's been on market 118 days — a 9% lower offer ($154k) is reasonable based on typical stale-listing flexibility.
- 2 sale attempts since 13y ago; this cycle's ask has dropped $10k (6%) from the opening price — seller is motivated, your offer sets the floor, not the list.
- Current owner paid $15k; list at $169k implies a 1027% gain — meaningful room to come down on a strong offer.
Risks & watch-outs
- Climate carrying-cost: severe wind risk, 99% chance of damaging wind over 30y; extreme-heat days projected 7→24/yr by 2055 (HVAC capex compounding) — expect insurance premiums to compound above CPI over the hold.
Questions for the listing agent
- It's been on market 118 days. Have you received any prior offers? Is the seller open to a 9% concession, seller financing, or rate buy-down credit?
- Why hasn't it sold? Are there any deal-killer items the seller is aware of (foundation, flood, title, zoning, code violations)?
- Is there a deadline driving the sale (1031 exchange, divorce, estate, relocation)? That informs how much negotiation room exists.
- Schools are F-rated, which usually means shorter tenancies and higher turnover. Who's the typical renter profile here, and what's been the actual vacancy rate?
- What's the average days-on-market for RENTAL listings here right now (not sales)? A rising rental-DOM trend means longer vacancies and softer asking-rent achievability than the comps imply.
- What's the recent tenant-quality profile in this submarket — average credit score on applications, eviction rate, late-payment / NSF rate, and stable-employment percentage? A property-management company in the area should have these aggregated.
- How much new for-sale + rental construction is in the pipeline within 1–3 miles? Heavy new supply typically softens prices + rents 12–24 months out; constrained supply supports both.
Investment metrics
- 1% rule
- 1.08% ✓
- Cap rate
- 8.68%
- Cash-on-cash
- 8.52%
- DSCR
- 1.38
- GRM
- 7.8
CMA / ARV
- ARV (on-the-fly)
- $159,744
- Comps found
- 7
Show comp detail 7 sales within ~0.75 mi
| Address | Dist | Beds/Ba | Sqft | Sold | Price | $/sf | Match |
|---|---|---|---|---|---|---|---|
| 4254 SE 22nd Ct | 0.00mi | 3/2.0 | 1,664 (0%) | 0mo | $160,000 | $96 | 100 |
| 4323 SE 22nd Ct | 0.06mi | 3/2.0 | 1,748 (+5%) | 11mo | $75,000 | $43 | 80 |
| 2702 SE 47th Ter | 0.42mi | 2/2.0 (-1) | 1,621 (-3%) | 5mo | $50,000 | $31 | 67 |
| 3832 SE 25th St | 0.29mi | 3/2.0 | 1,539 (-8%) | 9mo | $160,000 | $104 | 66 |
| 4360 SE 26th St | 0.21mi | 4/3.0 (+1) | 1,747 (+5%) | 12mo | $82,000 | $47 | 63 |
| 3045 SE 36th Ave | 0.67mi | 3/2.0 | 1,512 (-9%) | 2mo | $160,000 | $106 | 52 |
| 3401 SE 28th St | 0.62mi | 3/2.0 | 1,488 (-11%) | 15mo | $152,000 | $102 | 41 |
Match score weights: distance 35% · size 25% · config 20% · recency 20%. Top-matched comps best support the ARV.
Projected returns pro-forma
-3.0% appreciation · 3.0% rent growth · sell at horizon
- IRR
- -3.4%
- Equity multiple
- 0.87×
- Total profit
- $-6,004
- Equity at exit
- $25,198
- IRR
- 6.3%
- Equity multiple
- 1.47×
- Total profit
- $22,262
- Equity at exit
- $14,612
Cash invested: $47,320 (down + closing). Projections, not guarantees.
Landlord ↔ Tenant lean methodology
- Overall (STATE)
- 87 Strongly Landlord-Friendly
- State Florida
- 87 Strongly Landlord-Friendly · R+3
- County
- — inherits STATE
- City
- — inherits STATE
ZIP-level market 34974
- Home prices YoY
- -15.6%
- Active inventory
- 402
- Price-to-rent
- 7.8×
Monthly cashflow live
- Estimated rent
- $1,817 medium interval (Pro) →
- Mortgage (P&I)
- −$886
- Tax from tax record
- −$143 /mo · $1,712/yr
- Insurance
- −$70
- HOA
- −$0
- Vacancy / Maint / Mgmt
- −$382
- Net cashflow
- $336
Break-even live
Sensitivity live
| Price | -10% $432 | -5% $384 | +0% $336 | +5% $288 | +10% $240 |
|---|---|---|---|---|---|
| Rent | -10% $192 | -5% $264 | +0% $336 | +5% $408 | +10% $479 |
| Rate | -1.0pp $421 | -0.5pp $379 | base $336 | +0.5pp $292 | +1.0pp $248 |
UW: 25.0% down · 7.5% · 30yr · 1.5% tax · 5.0% vac · 8.0% maint · 8.0% mgmt
Financing live
Cash to close
- Down payment
- $42,250
- Closing costs
- $5,070
- Reserves months
- —
- Total cash needed
- —
Loan-product check · same deal, 3 products live
Conventional
25% down · 7.5% · 30yr
- Down + closing
- —
- Monthly P&I
- —
- Monthly cashflow
- —
- DSCR
- —
- Eligible?
- —
Personal DTI + credit; lowest rate.
DSCR
20% down · 8.5% · 30yr
- Down + closing
- —
- Monthly P&I
- —
- Monthly cashflow
- —
- DSCR
- —
- Eligible?
- —
No personal income docs; deal must DSCR.
Hard money
10% down · 12.0% · 12mo
- Down + closing
- —
- Monthly P&I
- —
- Monthly cashflow
- —
- DSCR
- —
- Eligible?
- —
Short-term bridge; refi at stabilization.
Listing history 8 events
-
2026-03-22price $169,000
-
2026-01-29$179,000 Active
-
2014-06-26soldstatus $15,000 87-char remark
Show marketing remark (87 chars)
NICE DOUBLE WIDE MOBILE IN TREASURE ISLAND, LARGE COVERED FRONT PORCH, COVERED PARKING.
-
2013-11-15$29,900 87-char remark
Show marketing remark (87 chars)
NICE DOUBLE WIDE MOBILE IN TREASURE ISLAND, LARGE COVERED FRONT PORCH, COVERED PARKING.
-
2004-02-13soldstatus $46,000
-
2003-06-16soldstatus $50,000
-
1996-03-01soldstatus $45,000
-
1991-10-01soldstatus $35,900
ⓘ Source: listings_history table (triggers on properties + properties_extension) + one-shot
backfill from property_details.listing_events for pre-trigger history.
Tax reassessment forecast FL · Resets to sale price
- Current annual tax
- $1,712 · $143/mo
- Projected year-2 tax
- $1,712 · $143/mo
- Expected delta
- $0/yr ($0/mo · 0.0%)
ⓘ Screening estimate from a state-policy table — verify with the county assessor before closing.
Climate risk First Street
- Flood 1/10 Low FEMA zone X (unshaded) · 0% chance over 30 yrs
- Wildfire 4/10 Moderate
- Heat 9/10 Extreme 7 d/yr ≥108°F today · 24 d/yr by 30 yrs out
- Wind 10/10 Extreme 99% chance of damaging wind over 30 yrs
- Air quality 2/10 Low 1 unhealthy d/yr today · 2 by 30 yrs out
Nearby sold comps map
Loading sold comps map…
Walkable amenities ~0.75 mi
Loading nearby amenities…
Taxation est. · year 1
- Rental income
- $21,802
- − Mortgage interest
- −$9,467
- − Property taxes
- −$1,712
- − Insurance
- −$845
- − Repairs & maintenance
- −$1,744
- − Management
- −$1,744
- − Depreciation
- −$4,916
- Taxable income
- $1,373
- Est. tax owed @ 24.0%
- −$330
- After-tax cash flow
- $3,702/yr
For passive investors: Depreciation is non-cash, so a rental often shows a tax loss while cash-flowing — sheltering income. Rental losses are passive: they offset passive income freely, and up to $25,000/yr can offset ordinary (W-2) income if you actively participate and your MAGI is under $100k (phasing out to $0 by $150k); unused losses carry forward. On sale, claimed depreciation is recaptured at up to 25%, and gains may owe capital-gains tax (a 1031 exchange can defer both). Figures are a year-1 estimate at your 24.0% rate — not tax advice; consult a CPA.
Schools (NCES district)
- District
- Okeechobee
- NCES district ID
- 1201410
- Math proficiency
- 44% ▼ -12.00%
- Reading proficiency
- 42% ▼ -4.00%
- Median HH income
- $36,710
- Composite
- 35.73/100
- National rank
- #4855
- State rank
- #58 of 73 in FL
Livability — Taylor Creek
- Score
- 56/100
- State rank
- #874
- US rank
- #23017
Category grades
Schools grade is shown separately in the Schools card above.
Census & demographics
- Census place
- Taylor Creek, FL
- County
- Okeechobee County · 23,975 people
- Metro
- Okeechobee, FL
- Population (ZIP)
- 23,975
- Household income
- $53,013
- Rent vs Own
- Severe rent burden
- 399.0
Population outlook (Okeechobee County) Hauer SSP2
- Today (2025)
- 37,273 people
- By 2030
- 35,885 · -3.7%
- By 2040
- 32,931 · -11.6%
- By 2050
- 29,433 · -21.0%
- By 2075
- 19,607 · -47.4%
- By 2100
- 11,814 · -68.3%
Race, ethnicity, and origin ACS 2023
- Neighborhood character
- Predominantly White (74%)
- Race & ethnicity
- White 74% Hispanic / Latino 19% Two or more races 8% Asian 2% Black 2% Native American 1%
- Hispanic origin (detail)
- Mexican 12% Puerto Rican 1% Cuban 2%
- Common ancestry
- Lithuanian 2% Iranian 2% Italian 2%
- Foreign-born
- 11% · Canada, Jamaica
- Languages at home
- 81% English-only · Spanish 16% French/Haitian/Cajun 1% Other Indo-European 1%
Political lean MEDSL · Okeechobee
- 2024 margin
- Solid R (+53.8) · D 22.9% · R 76.7%
- 2008→2024 swing
- -34.6pp toward R · 2008: -19.2pp · 2024: -53.8pp
- All cycles
- 2024: R+53.8 2020: R+44.4 2016: R+39.5 2012: R+20.0 2008: R+19.2
Not yet ingested
- Civics
- —
Market trends
- HPI YoY
- ▼ -64.47%
- Current HPI
- 348.6692
- Rent YoY
- —
- Metro
- Okeechobee, FL
- State GDP YoY
- ▲ 3.28%
- F500 in state
- 36
Industry mix (Fortune 500 HQ in FL)
| Industry | F500 HQs | Revenue |
|---|---|---|
| Industrial Technology | 2 | $29B |
|
||
| Insurance | 2 | $17B |
|
||
| Retail | 1 | $60B |
|
||
| Technology Distribution | 1 | $58B |
|
||
| Homebuilding | 1 | $35B |
|
||
| Technology Manufacturing | 1 | $35B |
|
||
Price history
+370.8% since first listed8 events — show timeline
- 2026-03-22 Price Changed $169,000 Beaches MLS
- 2026-01-29 Listed $179,000 Beaches MLS
- 2014-06-26 Sold (MLS) $15,000 Stellar MLS as Distributed by MLS Grid
- 2013-11-15 Listed $29,900 Stellar MLS as Distributed by MLS Grid
- 2004-02-13 Sold (Public Records) $46,000 Public Records
- 2003-06-16 Sold (Public Records) $50,000 Public Records
- 1996-03-01 Sold (Public Records) $45,000 Public Records
- 1991-10-01 Sold (Public Records) $35,900 Public Records
Property tax history
+6.1%/yrLatest (2025): $1,712 · +6.8% YoY. Source: county tax records.
Cash-flow waterfall
monthlySold comps — $/sqft
last 12 mo · ≤1 miLoading sold comps…