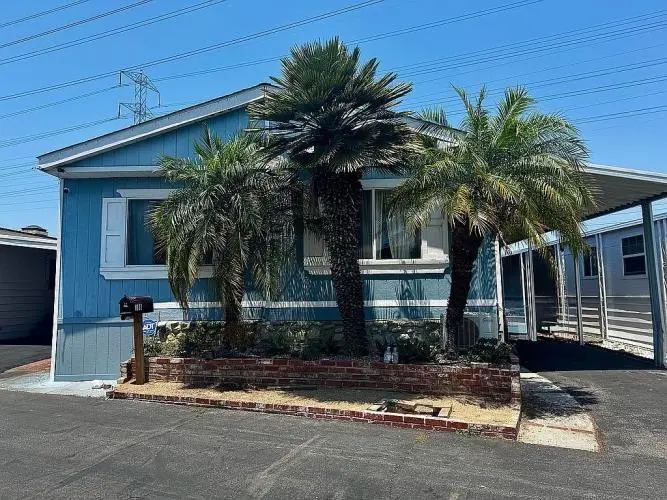
17705 S Western Ave Spc 109 · Torrance, CA
Flood risk 1/10 · Minimal
- FEMA flood zone
- X (unshaded)
- Chance of flooding over 30 yrs
- 0.0%
- Est. flood insurance / yr
- $507 – $1,088
Fire risk 1/10 · Minimal
- Est. fire insurance / yr
- $659 – $1,223
Heat risk 4/10 · Minor
- Hot days now (above 86°F)
- 4 days/yr
- Hot days in 30 yrs
- 12 days/yr
Wind risk 1/10 · Minimal
- Chance of severe wind over 30 yrs
- —
Air-quality risk 5/10 · Moderate
- Unhealthy air days now
- 7 days/yr
- Unhealthy air days in 30 yrs
- 7 days/yr
Risk factors via First Street. Map © Google.
Why this score? — see what drove the B- grade
The composite is a weighted blend of 9 inputs, each scored 0–100. Each bar is that input's sub-score; the figure is the points it added to the 100-point composite (weight × sub-score).
- Cash flow +30.0/30.0
- 1% rule +10.0/10.0
- DSCR +10.0/10.0
- Schools +5.9/10.0
- Condition / age +4.0/5.0
- Livability +3.8/5.0
- Rent growth +2.5/5.0
- ARV discount +0.0/15.0
- Appreciation +0.0/10.0
$180,000
🖨 Deal sheet (PDF) 📄 Offer letter ✓ Due diligence
Listing remarks MLS
No HOA ONLY land rent
Key facts
- Built 1994
- Listed 61 days
Neighborhood map
What this means for you Summary
Snapshot
- This is a 2-bed/2.0-bath manufactured listed at $180k. Condition is rated good.
Deal economics
- At list price, monthly cash flow is $1k ($16k/yr) — positive.
- The deal already cash-flows at list — no discount required.
- Meets the 1% rule at list price ($3k rent vs $180k).
- Recommended offer: $169k (6.0% below list) — sets the bar for market timing.
- Cap rate 15.3% vs local median 2.1% in Torrance — top-decile yield for the area; either an underpriced asset or a hidden risk that comps aren't pricing in. Stress-test before assuming the spread holds.
Location & tenants
- Location reads 76/100 on livability (#95 in CA, #3,501 nationally) — a middle-class / working-renter tenant base. Strengths: schools A+, amenities A+, commute A+; Watch: health & safety C-, crime D+, cost of living F.
- Torrance Unified (urban): math 62% / reading 67% proficiency, ranked #150 of 1,400 in CA (top 11%) — acceptable for families but not a draw, mixed tenant base, ~2y average lease; only 20% free/reduced lunch — higher-income household profile.
- Market conditions: 27 active listings in the ZIP; 39 comparable units currently listed for rent nearby; rentals at typical pace (median 26d on market — plan ~3-4 weeks tenant-placement turnaround); 41% of comp listings sitting > 30 days — soft ceiling on asking rent; 19,697 units permitted in Los Angeles County in 2024 (9,426 in 5+ unit buildings).
Forward outlook
- Local home prices are declining (-3.0%/yr); year-one equity from $1k of loan paydown is wiped out by about $5k of value loss. Plan a longer hold.
- Los Angeles County population projected at +9% by 2050 — modest demand growth; plan on rents tracking national, not racing it.
- At projected returns (-3.0% appreciation + 3.0% rent growth), your $50k cash investment doubles in ~4 years — after that, you're playing with house money.
Negotiation context
- It's been on market 61 days — a 6% lower offer ($169k) is reasonable based on typical stale-listing flexibility.
Questions for the listing agent
- It's been on market 61 days. Have you received any prior offers? Is the seller open to a 6% concession, seller financing, or rate buy-down credit?
- Why hasn't it sold? Are there any deal-killer items the seller is aware of (foundation, flood, title, zoning, code violations)?
- Is there a deadline driving the sale (1031 exchange, divorce, estate, relocation)? That informs how much negotiation room exists.
- Schools are A-rated — typically a magnet for longer-tenancy family renters. What's the average tenant stay here, and is there a school-zone premium baked into asking?
- Crime grade is D in this area — have there been break-ins, vandalism, or insurance claims at this property in the last 3 years? What carrier currently insures it and at what premium?
- What's the average days-on-market for RENTAL listings here right now (not sales)? A rising rental-DOM trend means longer vacancies and softer asking-rent achievability than the comps imply.
- What's the recent tenant-quality profile in this submarket — average credit score on applications, eviction rate, late-payment / NSF rate, and stable-employment percentage? A property-management company in the area should have these aggregated.
- How much new for-sale + rental construction is in the pipeline within 1–3 miles? Heavy new supply typically softens prices + rents 12–24 months out; constrained supply supports both.
Investment metrics
- 1% rule
- 1.69% ✓
- Cap rate
- 15.28%
- Cash-on-cash
- 32.11%
- DSCR
- 2.43
- GRM
- 4.9
CMA / ARV
- ARV (median comp)
- $128,012
- List price
- $180,000
- Delta
- 40.61%
- Verdict
- OVERPRICED
- Comps
- 13 within 1.0 mi
Show comp detail 12 sales within ~0.75 mi
| Address | Dist | Beds/Ba | Sqft | Sold | Price | $/sf | Match |
|---|---|---|---|---|---|---|---|
| 17705 S Western Ave #18 | 0.00mi | 2/2.0 | 1,080 (-4%) | 9mo | $117,000 | $108 | 85 |
| 17705 S Western #102 | 0.06mi | 2/2.0 | 1,100 (-2%) | 14mo | $115,000 | $105 | 82 |
| 17700 Western #76 | 0.23mi | 3/2.0 (+1) | 1,152 (+2%) | 2mo | $85,000 | $74 | 79 |
| 17705 S Western Ave #88 | 0.00mi | 3/2.0 (+1) | 1,248 (+11%) | 4mo | $215,000 | $172 | 74 |
| 17705 S Western Ave #53 | 0.00mi | 3/2.0 (+1) | 990 (-12%) | 7mo | $155,000 | $157 | 69 |
| 17700 S Western Ave #116 | 0.24mi | 2/2.0 | 1,040 (-8%) | 9mo | $155,000 | $149 | 68 |
| 17705 S Western #24 | 0.10mi | 3/2.0 (+1) | 1,000 (-11%) | 12mo | $114,900 | $115 | 62 |
| 17700 Western Ave S #190 | 0.23mi | 2/2.0 | 960 (-15%) | 5mo | $95,000 | $99 | 60 |
| 17700 S Western Ave #174 | 0.30mi | 2/2.0 | 960 (-15%) | 1mo | $178,000 | $185 | 60 |
| 17700 S Western Ave #162 | 0.23mi | 2/2.0 | 960 (-15%) | 7mo | $152,500 | $159 | 59 |
| 17700 S Western Ave #35 | 0.23mi | 2/2.0 | 960 (-15%) | 10mo | $130,000 | $135 | 56 |
| 17700 Western Ave SPC 111 | 0.30mi | 2/2.0 | 960 (-15%) | 10mo | $159,000 | $166 | 53 |
Match score weights: distance 35% · size 25% · config 20% · recency 20%. Top-matched comps best support the ARV.
Projected returns pro-forma
-3.0% appreciation · 3.0% rent growth · sell at horizon
- IRR
- 27.1%
- Equity multiple
- 2.12×
- Total profit
- $56,665
- Equity at exit
- $26,839
- IRR
- 34.6%
- Equity multiple
- 4.17×
- Total profit
- $159,668
- Equity at exit
- $15,563
Cash invested: $50,400 (down + closing). Projections, not guarantees.
Landlord ↔ Tenant lean methodology
- Overall (STATE)
- 18 Strongly Tenant-Friendly
- State California
- 18 Strongly Tenant-Friendly · D+13
- County
- — inherits STATE
- City
- — inherits STATE
ZIP-level market 90248
- Active inventory
- 27
- Price-to-rent
- 4.9×
Monthly cashflow live
- Estimated rent
- $3,040 high interval (Pro) →
- Mortgage (P&I)
- −$944
- Tax from tax record
- −$34 /mo · $406/yr
- Insurance
- −$75
- HOA
- −$0
- Vacancy / Maint / Mgmt
- −$638
- Net cashflow
- $1,349
Break-even live
Sensitivity live
| Price | -10% $1,451 | -5% $1,400 | +0% $1,349 | +5% $1,298 | +10% $1,247 |
|---|---|---|---|---|---|
| Rent | -10% $1,109 | -5% $1,229 | +0% $1,349 | +5% $1,469 | +10% $1,589 |
| Rate | -1.0pp $1,439 | -0.5pp $1,395 | base $1,349 | +0.5pp $1,302 | +1.0pp $1,255 |
UW: 25.0% down · 7.5% · 30yr · 1.5% tax · 5.0% vac · 8.0% maint · 8.0% mgmt
Financing live
Cash to close
- Down payment
- $45,000
- Closing costs
- $5,400
- Reserves months
- —
- Total cash needed
- —
Loan-product check · same deal, 3 products live
Conventional
25% down · 7.5% · 30yr
- Down + closing
- —
- Monthly P&I
- —
- Monthly cashflow
- —
- DSCR
- —
- Eligible?
- —
Personal DTI + credit; lowest rate.
DSCR
20% down · 8.5% · 30yr
- Down + closing
- —
- Monthly P&I
- —
- Monthly cashflow
- —
- DSCR
- —
- Eligible?
- —
No personal income docs; deal must DSCR.
Hard money
10% down · 12.0% · 12mo
- Down + closing
- —
- Monthly P&I
- —
- Monthly cashflow
- —
- DSCR
- —
- Eligible?
- —
Short-term bridge; refi at stabilization.
Rent comps 39 comps
| Address | Beds | Baths | Sqft | Rent | $/sqft | DOM | Units | Dist |
|---|---|---|---|---|---|---|---|---|
| 18012 Manhattan Pl Torrance, CA | 3.0 | 2.0 | 1446 | $3,595 | $2.49 | 3d | 1 | 0.21mi |
| 17405 Van Ness Ave Torrance, CA | 2.0 | 2.0 | 850 | $2,775 | $3.26 | 16d | 1 | 0.44mi |
| 17313 Denker Ave Unit 4 Gardena, CA | 2.0 | 1.0 | 985 | $2,300 | $2.34 | 45d | 1 | 0.44mi |
| 17310 S Dalton Ave #3 Gardena, CA | 2.0 | 2.5 | 1400 | $3,500 | $2.50 | 25d | 1 | 0.50mi |
| 18405 Haas Ave Torrance, CA | 3.0 | 2.0 | 1240 | $3,500 | $2.82 | 45d | 1 | 0.56mi |
| 1443 W 179th St Unit 107 Gardena, CA | 2.0 | 1.0 | 800 | $2,450 | $3.06 | 25d | 1 | 0.61mi |
| 1443 W 179th St Apt 104 Gardena, CA | 2.0 | 2.0 | 850 | $2,500 | $2.94 | 45d | 1 | 0.61mi |
| 16507 Saint Andrews Pl Unit C Gardena, CA | 2.0 | 1.0 | 850 | $2,650 | $3.12 | 45d | 1 | 0.74mi |
| 1243 Electric St Gardena, CA | 2.0 | 2.0 | 866 | $2,850 | $3.29 | 9d | 1 | 0.88mi |
| 1616 W Gardena Blvd Gardena, CA | 2.0 | 1.0 | 882 | $2,800 | $3.17 | 4d | 1 | 0.88mi |
| 17229 Atkinson Ave Torrance, CA | 3.0 | 1.0 | 967 | $3,600 | $3.72 | 45d | 1 | 0.88mi |
| 2314 W 165th St Torrance, CA | 3.0 | 2.0 | 1304 | $4,000 | $3.07 | 18d | 1 | 0.90mi |
| 16326 Denker Ave Gardena, CA | 2.0 | 1.0 | 908 | $3,000 | $3.30 | 45d | 1 | 0.93mi |
| 16901 Crenshaw Blvd Unit 1 Torrance, CA | 2.0 | 1.0 | 800 | $2,500 | $3.12 | 25d | 1 | 1.03mi |
| 1328 W Gardena Blvd Apt 3 Gardena, CA | 2.0 | 2.0 | 1080 | $2,700 | $2.50 | 45d | 1 | 1.04mi |
| 17309 Elgar Ave Torrance, CA | 2.0 | 1.0 | 838 | $3,400 | $4.06 | 14d | 1 | 1.05mi |
| 17309 Elgar Ave Torrance, CA | 2.0 | 1.0 | 838 | $3,400 | $4.06 | 9d | 1 | 1.05mi |
| 1261 W 166th St Gardena, CA | 3.0 | 2.0 | 1280 | $3,000 | $2.34 | 45d | 1 | 1.07mi |
| 16713 Crenshaw Blvd Torrance, CA | 3.0 | 1.0 | 850 | $2,450 | $2.88 | 45d | 1 | 1.08mi |
| 1343 W 164th St Gardena, CA | 2.0 | 2.0 | 800 | $2,700 | $3.38 | 25d | 1 | 1.10mi |
| 17032 Falda Ave Torrance, CA | 3.0 | 2.0 | 1487 | $4,995 | $3.36 | 0d | 1 | 1.11mi |
| 17513 Glenburn Ave Torrance, CA | 2.0 | 2.0 | 800 | $3,195 | $3.99 | 45d | 1 | 1.13mi |
| 3313 Artesia Blvd Torrance, CA | 1.0 | 1.0 | 750 | $1,895 | $2.53 | 45d | 1 | 1.17mi |
| 15825 Denker Ave Unit A Gardena, CA | 2.0 | 1.0 | 900 | $2,750 | $3.06 | 45d | 1 | 1.22mi |
| 16935 S Vermont Ave Gardena, CA | 2.0 | 1.0 | 850 | $2,295 | $2.70 | 25d | 1 | 1.23mi |
| 1661 W 158th St Apt 103 Gardena, CA | 2.0 | 2.0 | 935 | $2,550 | $2.73 | 0d | 1 | 1.26mi |
| 16920 S Vermont Ave Unit D Gardena, CA | 2.0 | 1.5 | 1100 | $2,795 | $2.54 | 20d | 1 | 1.27mi |
| 16920 S Vermont Ave Gardena, CA | 2.0 | 1.5 | 1100 | $2,795 | $2.54 | 25d | 1 | 1.27mi |
| 1040 W 165th Pl Unit A Gardena, CA | 3.0 | 3.0 | 1500 | $4,500 | $3.00 | 0d | 1 | 1.27mi |
| 1040 W 165th Pl Unit 1 Gardena, CA | 3.0 | 3.0 | 1500 | $4,501 | $3.00 | 0d | 1 | 1.27mi |
| 2125 W 157th St Unit 10 Gardena, CA | 1.0 | 1.0 | 700 | $2,050 | $2.93 | 5d | 1 | 1.30mi |
| 860 W 165th Pl Apt 201 Gardena, CA | 2.0 | 2.0 | 925 | $2,395 | $2.59 | 45d | 1 | 1.36mi |
| 17302 Yukon Ave Torrance, CA | 2.0 | 2.0 | 990 | $2,782 | $2.81 | 25d | 2 | 1.38mi |
| 15702 Brighton Ave Unit 4 Gardena, CA | 2.0 | 1.0 | 750 | $2,500 | $3.33 | 20d | 1 | 1.43mi |
| 17035 Yukon Ave Torrance, CA | 1.0 | 1.0 | 720 | $2,195 | $3.05 | 45d | 1 | 1.46mi |
| 3619 W 172nd St Torrance, CA | 3.0 | 2.0 | 999 | $4,200 | $4.20 | 45d | 1 | 1.48mi |
| 16915 Yukon Ave Unit 6 Torrance, CA | 2.0 | 1.0 | 903 | $2,650 | $2.93 | 25d | 1 | 1.48mi |
| 16700 Yukon Ave #108 Torrance, CA | 2.0 | 2.0 | 859 | $3,200 | $3.73 | 45d | 1 | 1.49mi |
| 16724 Yukon Ave Torrance, CA | 1.0 | 1.0 | 705 | $2,595 | $3.68 | 25d | 1 | 1.49mi |
Listing history 16 events
-
2026-06-21days on market $180,000 Active 61 DOM
-
2026-06-18days on market $180,000 Active 58 DOM
-
2026-06-17days on market $180,000 Active 57 DOM
-
2026-06-16days on market $180,000 Active 56 DOM
-
2026-06-15days on market $180,000 Active 55 DOM
-
2026-06-13days on market $180,000 Active 53 DOM
-
2026-06-13days on market $180,000 Active 52 DOM
-
2026-06-09days on market $180,000 Active 49 DOM
-
2026-06-08days on market $180,000 Active 48 DOM
-
2026-06-07days on market $180,000 Active 47 DOM
-
2026-06-04days on market $180,000 Active 44 DOM
-
2026-06-03days on market $180,000 Active 43 DOM
-
2026-06-02days on market $180,000 Active 42 DOM
-
2026-06-01days on market $180,000 Active 41 DOM
-
2026-05-31days on market $180,000 Active 40 DOM
-
2026-04-17$180,000 Active 21-char remark
Show marketing remark (21 chars)
No HOA ONLY land rent
ⓘ Source: listings_history table (triggers on properties + properties_extension) + one-shot
backfill from property_details.listing_events for pre-trigger history.
Tax reassessment forecast CA · Resets to sale price
- Current annual tax
- $406 · $34/mo
- Projected year-2 tax
- $1,368 · $114/mo
- Expected delta
- +$962/yr (+$80/mo · 236.6%)
ⓘ Screening estimate from a state-policy table — verify with the county assessor before closing.
Climate risk First Street
- Flood 1/10 Low FEMA zone X (unshaded) · 0% chance over 30 yrs
- Wildfire 1/10 Low
- Heat 4/10 Moderate 4 d/yr ≥86°F today · 12 d/yr by 30 yrs out
- Wind 1/10 Low
- Air quality 5/10 Major 7 unhealthy d/yr today · 7 by 30 yrs out
Nearby sold comps map
Loading sold comps map…
Walkable amenities ~0.75 mi
Loading nearby amenities…
Taxation est. · year 1
- Rental income
- $36,480
- − Mortgage interest
- −$10,083
- − Property taxes
- −$406
- − Insurance
- −$900
- − Repairs & maintenance
- −$2,918
- − Management
- −$2,918
- − Depreciation
- −$5,236
- Taxable income
- $14,017
- Est. tax owed @ 24.0%
- −$3,364
- After-tax cash flow
- $12,821/yr
For passive investors: Depreciation is non-cash, so a rental often shows a tax loss while cash-flowing — sheltering income. Rental losses are passive: they offset passive income freely, and up to $25,000/yr can offset ordinary (W-2) income if you actively participate and your MAGI is under $100k (phasing out to $0 by $150k); unused losses carry forward. On sale, claimed depreciation is recaptured at up to 25%, and gains may owe capital-gains tax (a 1031 exchange can defer both). Figures are a year-1 estimate at your 24.0% rate — not tax advice; consult a CPA.
Condition & rehab AI · 12 photos
This manufactured home is in good condition with minimal repairs needed. It is move-in ready and has potential for significant value increase with cosmetic updates.
Value-add opportunities
- Both Paint exterior siding — Enhances curb appeal and adds value.
- Both Replace carpet with hardwood flooring — Improves aesthetics and increases value.
- Both Install new kitchen appliances — Modernizes the kitchen and adds value.
- Both Install new bathroom fixtures — Enhances functionality and adds value.
Renovation cost estimate screening
Value-add ROI direction
- Both Paint exterior siding — Enhances curb appeal and adds value. ↑
- Both Replace carpet with hardwood flooring — Improves aesthetics and increases value. ↑
- Both Install new kitchen appliances — Modernizes the kitchen and adds value. ↑
- Both Install new bathroom fixtures — Enhances functionality and adds value. ↑
ⓘ Cost ranges are severity-bucket heuristics (US national rule-of-thumb). Get contractor quotes + a written scope before underwriting a rehab budget.
Schools (NCES district)
- District
- Torrance Unified
- NCES district ID
- 0639420
- Math proficiency
- 62% ▲ 2.00%
- Reading proficiency
- 67% ▬ 0.00%
- Median HH income
- $78,640
- Composite
- 58.96/100
- National rank
- #1969
- State rank
- #150 of 1400 in CA
Livability — Torrance
- Score
- 76/100
- State rank
- #95
- US rank
- #3501
Category grades
Schools grade is shown separately in the Schools card above.
Census & demographics
- Census place
- Torrance, CA
- City population
- 153,473
- Population (ZIP)
- 11,144
Population outlook (Los Angeles County) Hauer SSP2
- Today (2025)
- 10,940,515 people
- By 2030
- 11,256,481 · +2.9%
- By 2040
- 11,729,929 · +7.2%
- By 2050
- 11,948,407 · +9.2%
- By 2075
- 11,818,114 · +8.0%
- By 2100
- 10,842,928 · -0.9%
Race, ethnicity, and origin ACS 2023
- Neighborhood character
- Highly diverse neighborhood (Simpson 0.75)
- Race & ethnicity
- Asian 32% Hispanic / Latino 31% Black 21% Two or more races 12% White 7%
- Hispanic origin (detail)
- Mexican 20% Puerto Rican 2%
- Common ancestry
- British 1%
- Foreign-born
- 37% · Canada, South Korea, Vietnam
- Languages at home
- 53% English-only · Spanish 25% Other Asian/Pacific 10% Tagalog/Filipino 6%
Political lean MEDSL · Los Angeles
- 2024 margin
- Solid D (+32.9) · D 64.8% · R 31.9% · Other 3.3%
- 2008→2024 swing
- -7.4pp toward R · 2008: 40.4pp · 2024: 32.9pp
- All cycles
- 2024: D+32.9 2020: D+44.2 2016: D+48.0 2012: D+40.0 2008: D+40.4
Not yet ingested
- Civics
- —
Market trends
- HPI YoY
- ▼ -318.63%
- Current HPI
- 409.9768
- Rent YoY
- —
- Metro
- —
- State GDP YoY
- ▲ 3.21%
- F500 in state
- 116
Industry mix (Fortune 500 HQ in CA)
| Industry | F500 HQs | Revenue |
|---|---|---|
| Technology | 27 | $1,492B |
|
||
| Financial Services | 3 | $174B |
|
||
| Retail | 3 | $44B |
|
||
| Insurance | 3 | $26B |
|
||
| Media / Entertainment | 2 | $115B |
|
||
| Pharmaceuticals / Biotech | 2 | $62B |
|
||
Price history
1 event — show timeline
- 2026-04-17 Listed $180,000 Fizber.com
Property tax history
+4.9%/yrLatest (2025): $406 · +4.9% YoY. Source: county tax records.
Cash-flow waterfall
monthlySold comps — $/sqft
last 12 mo · ≤1 miLoading sold comps…