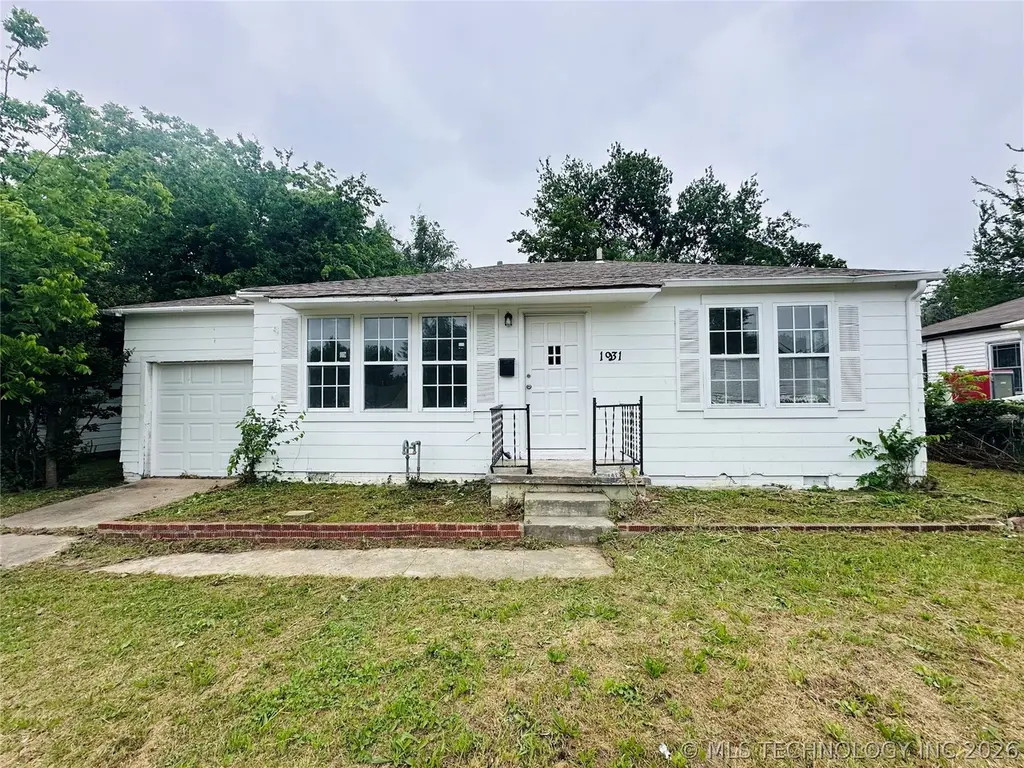
1931 N Florence Ave · Tulsa, OK
Flood risk 1/10 · Minimal
- FEMA flood zone
- X (unshaded)
- Chance of flooding over 30 yrs
- 0.0%
- Est. flood insurance / yr
- $507 – $1,088
Fire risk 1/10 · Minimal
- Est. fire insurance / yr
- $2,463 – $4,575
Heat risk 6/10 · Moderate
- Hot days now (above 110°F)
- 7 days/yr
- Hot days in 30 yrs
- 18 days/yr
Wind risk 2/10 · Minimal
- Chance of severe wind over 30 yrs
- 4.0%
Air-quality risk 3/10 · Minor
- Unhealthy air days now
- 2 days/yr
- Unhealthy air days in 30 yrs
- 3 days/yr
Risk factors via First Street. Map © Google.
Why this score? — see what drove the A- grade
The composite is a weighted blend of 9 inputs, each scored 0–100. Each bar is that input's sub-score; the figure is the points it added to the 100-point composite (weight × sub-score).
- Cash flow +30.0/30.0
- ARV discount +15.0/15.0
- DSCR +10.0/10.0
- Appreciation +9.3/10.0
- 1% rule +7.3/10.0
- Livability +3.8/5.0
- Rent growth +2.9/5.0
- Condition / age +2.5/5.0
- Schools +0.8/10.0
$79,000
🖨 Deal sheet 📄 Offer letter ✓ Due diligence
Listing remarks MLS
HUD #422-261161. SOLD AS-IS subject to HUD regulations/bid procedures. INSURED W/ Escrow($440). Bid deadline:DAILY. CLICK ON DOCS for further info.
Key facts
- 7,449 sq ft lot
- 2 garage spots
- Built 1950
Property features AI
Finance
- Other: Lot size approximately 0.171 acres
Exterior
- Parking: Has garage with 2 garage spaces
- Security: No safety shelter
- Utilities: Public water; Public sewer
- Home design: Single-story home; Faces west; Crawlspace foundation
- Construction: Concrete construction; Year built from public records
- Exterior features: No exterior features listed
Interior
- Kitchen: Cooktop
- Bedrooms: Master bedroom with dressing area and walk-in closet (First floor); Additional bedroom without bath (First floor)
- Flooring: Wood flooring
- Bathrooms: One full bathroom (hall bath, First floor)
- Heating & cooling: Electric and gas heating; Central air conditioning
- Interior features: Laminate counters; No additional interior features listed
- Laundry & utility: Gas water heater
Neighborhood map
What this means for you Summary
Snapshot
- This is a 2-bed/1.0-bath single-family listed at $79k.
Deal economics
- At list price, monthly cash flow is $295 ($4k/yr) — positive.
- The deal already cash-flows at list — no discount required.
- Meets the 1% rule at list price ($972 rent vs $79k).
- Recommended offer: $77k (3.0% below list) — sets the bar for market timing.
- Cap rate 10.8% vs local median 3.9% in Tulsa — top-decile yield for the area; either an underpriced asset or a hidden risk that comps aren't pricing in. Stress-test before assuming the spread holds.
Location & tenants
- Location reads 75/100 on livability (#13 in OK, #4,058 nationally) — a middle-class / working-renter tenant base. Strengths: amenities A+, commute A+, cost of living A+; Watch: schools F, crime F, employment D-.
- Tulsa (urban): math 7% / reading 12% proficiency, ranked #250 of 270 in OK (top 93%) — low school quality limits family demand, transient renter base, plan for 1-2y turnover; 76% free/reduced lunch — lower-income household profile, screen leases tightly.
- Market conditions: Rents rising (+1.8%/yr); 57 active listings in the ZIP; 15 comparable units currently listed for rent nearby; rentals at typical pace (median 24d on market — plan ~3-4 weeks tenant-placement turnaround); lower-income renter base — watch delinquency; 2,818 units permitted in Tulsa County in 2024 (518 in 5+ unit buildings).
Forward outlook
- In year one you build about $7k of equity ($546 loan paydown + $7k appreciation (8.7% local appreciation)).
- Tulsa County population projected at +30% by 2050 — long-run rental-demand tailwind backs the buy-and-hold thesis.
- At projected returns (8.7% appreciation + 1.8% rent growth), your $22k cash investment doubles in ~2 years — after that, you're playing with house money.
- By year 5, paydown + projected appreciation supports a ~$34k cash-out refi (75% LTV) — recoverable capital for the next deal without selling this one.
Negotiation context
- It's been on market 38 days — a 3% lower offer ($77k) is reasonable based on typical stale-listing flexibility.
- 6 sale attempts since 33y ago with the ask held roughly flat each time — persistent listings suggest the price (not the market) is what's stuck; bring a comps-based counter.
- Current owner paid $22k; list at $79k implies a 266% gain — meaningful room to come down on a strong offer.
Risks & watch-outs
- Watch-outs: built in 1950 — expect roof / HVAC / electrical / plumbing capex.
- Climate carrying-cost: extreme-heat days projected 7→18/yr by 2055 (HVAC capex compounding) — expect insurance premiums to compound above CPI over the hold.
Questions for the listing agent
- It's been on market 38 days. Have you received any prior offers? Is the seller open to a 3% concession, seller financing, or rate buy-down credit?
- Built in 1950 — when were the roof, HVAC, electrical panel, plumbing, and water heater last replaced?
- Is there a deadline driving the sale (1031 exchange, divorce, estate, relocation)? That informs how much negotiation room exists.
- Schools are F-rated, which usually means shorter tenancies and higher turnover. Who's the typical renter profile here, and what's been the actual vacancy rate?
- Crime grade is F in this area — have there been break-ins, vandalism, or insurance claims at this property in the last 3 years? What carrier currently insures it and at what premium?
- What's the average days-on-market for RENTAL listings here right now (not sales)? A rising rental-DOM trend means longer vacancies and softer asking-rent achievability than the comps imply.
- What's the recent tenant-quality profile in this submarket — average credit score on applications, eviction rate, late-payment / NSF rate, and stable-employment percentage? A property-management company in the area should have these aggregated.
- How much new for-sale + rental construction is in the pipeline within 1–3 miles? Heavy new supply typically softens prices + rents 12–24 months out; constrained supply supports both.
Investment metrics
- 1% rule
- 1.23% ✓
- Cap rate
- 10.77%
- Cash-on-cash
- 15.98%
- DSCR
- 1.71
- GRM
- 6.8
CMA / ARV
- ARV (on-the-fly)
- $117,504
- Comps found
- 12
Show comp detail 12 sales within ~0.75 mi
| Address | Dist | Beds/Ba | Sqft | Sold | Price | $/sf | Match |
|---|---|---|---|---|---|---|---|
| 1942 N Florence Ave | 0.03mi | 2/1.0 | 780 (+2%) | 16mo | $119,000 | $153 | 83 |
| 2918 E Woodrow St | 0.17mi | 2/1.0 | 876 (+14%) | 2mo | $62,500 | $71 | 67 |
| 1442 N Gary Ave | 0.45mi | 2/1.0 | 790 (+3%) | 15mo | $116,000 | $147 | 61 |
| 1576 N Knoxville Ave | 0.43mi | 2/1.0 | 816 (+6%) | 17mo | $90,000 | $110 | 56 |
| 1421 N Indianapolis Ave | 0.57mi | 2/1.0 | 841 (+10%) | 7mo | $179,000 | $213 | 52 |
| 1830 N New Haven Ave | 0.55mi | 2/1.0 | 840 (+9%) | 13mo | $155,000 | $185 | 48 |
| 2211 N Knoxville Ave | 0.49mi | 3/1.0 (+1) | 864 (+12%) | 7mo | $105,000 | $122 | 45 |
| 1804 N Louisville Ave | 0.45mi | 3/1.0 (+1) | 840 (+9%) | 17mo | $84,000 | $100 | 44 |
| 3546 E Xyler St | 0.54mi | 3/1.0 (+1) | 864 (+12%) | 8mo | $56,000 | $65 | 42 |
| 1820 N Oswego Ave | 0.61mi | 3/1.0 (+1) | 864 (+12%) | 4mo | $138,000 | $160 | 42 |
| 1526 N Oswego Ave | 0.68mi | 2/1.0 | 840 (+9%) | 16mo | $133,500 | $159 | 39 |
| 1308 N Delaware Pl | 0.70mi | 3/1.0 (+1) | 832 (+8%) | 13mo | $136,900 | $165 | 37 |
Match score weights: distance 35% · size 25% · config 20% · recency 20%. Top-matched comps best support the ARV.
Projected returns pro-forma
8.69% appreciation · 1.78% rent growth · sell at horizon
- IRR
- 33.2%
- Equity multiple
- 3.42×
- Total profit
- $53,630
- Equity at exit
- $63,777
- IRR
- 28.8%
- Equity multiple
- 7.31×
- Total profit
- $139,575
- Equity at exit
- $130,359
Cash invested: $22,120 (down + closing). Projections, not guarantees.
Landlord ↔ Tenant lean methodology
- Overall (STATE)
- 83 Strongly Landlord-Friendly
- State Oklahoma
- 83 Strongly Landlord-Friendly · R+20
- County
- — inherits STATE
- City
- — inherits STATE
ZIP-level market 74110
- Home prices YoY
- 3.2%
- Rents YoY
- 1.8%
- Active inventory
- 57
- Price-to-rent
- 6.8×
Monthly cashflow live
- Estimated rent
- $972 high interval (Pro) →
- Mortgage (P&I)
- −$414
- Tax from tax record
- −$26 /mo · $310/yr
- Insurance
- −$33
- HOA
- −$0
- Vacancy / Maint / Mgmt
- −$204
- Net cashflow
- $295
Break-even live
UW: 25.0% down · 7.5% · 30yr · 1.5% tax · 5.0% vac · 8.0% maint · 8.0% mgmt
Financing live
Cash to close
- Down payment
- $19,750
- Closing costs
- $2,370
- Reserves months
- —
- Total cash needed
- —
Loan-product check · same deal, 3 products live
Conventional
25% down · 7.5% · 30yr
- Down + closing
- —
- Monthly P&I
- —
- Monthly cashflow
- —
- DSCR
- —
- Eligible?
- —
Personal DTI + credit; lowest rate.
DSCR
20% down · 8.5% · 30yr
- Down + closing
- —
- Monthly P&I
- —
- Monthly cashflow
- —
- DSCR
- —
- Eligible?
- —
No personal income docs; deal must DSCR.
Hard money
10% down · 12.0% · 12mo
- Down + closing
- —
- Monthly P&I
- —
- Monthly cashflow
- —
- DSCR
- —
- Eligible?
- —
Short-term bridge; refi at stabilization.
Rent comps 15 comps
| Address | Beds | Baths | Sqft | Rent | $/sqft | DOM | Units | Dist |
|---|---|---|---|---|---|---|---|---|
| 1825 N College Ave Unit 13 Tulsa, OK | 1.0 | 1.0 | 675 | $745 | $1.10 | 23d | 1 | 0.11mi |
| 1816 N Delaware Pl Tulsa, OK | 3.0 | 1.0 | 990 | $950 | $0.96 | 3d | 1 | 0.30mi |
| 1507 N Florence Ave Tulsa, OK | 3.0 | 1.0 | 1000 | $1,100 | $1.10 | 23d | 1 | 0.38mi |
| 1928 N Columbia Pl Tulsa, OK | 2.0 | 1.0 | 888 | $1,000 | $1.13 | 16d | 1 | 0.40mi |
| 1830 N New Haven Ave Tulsa, OK | 2.0 | 1.0 | 840 | $1,295 | $1.54 | 23d | 1 | 0.54mi |
| 4008 E Virgin St Tulsa, OK | 3.0 | 1.0 | 1125 | $1,400 | $1.24 | 3d | 1 | 0.65mi |
| 1807 N Atlanta Ave Tulsa, OK | 3.0 | 1.0 | 812 | $995 | $1.23 | 23d | 1 | 0.70mi |
| 2132 N Atlanta Ave Tulsa, OK | 1.0 | 1.0 | 572 | $945 | $1.65 | 23d | 1 | 0.73mi |
| 1623 N Atlanta Ave Tulsa, OK | 3.0 | 1.0 | 975 | $1,175 | $1.21 | 3d | 1 | 0.73mi |
| 3326 E Marshall St Apt 4 Tulsa, OK | 2.0 | 1.0 | 750 | $925 | $1.23 | 23d | 1 | 0.85mi |
| 3326 E Marshall St Unit 1 Tulsa, OK | 2.0 | 1.0 | 700 | $825 | $1.18 | 23d | 1 | 0.85mi |
| 3336 E Marshall St Unit 06 Tulsa, OK | 1.0 | 1.0 | 700 | $895 | $1.28 | 23d | 1 | 0.86mi |
| 3336 E Marshall St Unit 10 Tulsa, OK | 1.0 | 1.0 | 575 | $799 | $1.39 | 23d | 1 | 0.86mi |
| 4703 E Latimer Pl Tulsa, OK | 2.0 | 1.0 | 1103 | $1,290 | $1.17 | 3d | 1 | 1.37mi |
| 3238 E Easton St Tulsa, OK | 2.0 | 1.0 | 800 | $1,150 | $1.44 | 3d | 1 | 1.37mi |
Listing history 30 events
-
2026-06-18days on market $79,000 Active 38 DOM
-
2026-06-17days on market $79,000 Active 37 DOM
-
2026-06-16days on market $79,000 Active 36 DOM
-
2026-06-15days on market $79,000 Active 35 DOM
-
2026-06-13days on market $79,000 Active 33 DOM
-
2026-06-10days on market $79,000 Active 30 DOM
-
2026-06-09days on market $79,000 Active 29 DOM
-
2026-06-08days on market $79,000 Active 28 DOM
-
2026-06-07days on market $79,000 Active 27 DOM
-
2026-06-05days on market $79,000 Active 24 DOM
-
2026-06-03days on market $79,000 Active 23 DOM
-
2026-06-02days on market $79,000 Active 22 DOM
-
2026-06-01days on market $79,000 Active 21 DOM
-
2026-05-31days on market $79,000 Active 20 DOM
-
2026-05-21status Pending
-
2026-05-06$79,000 Active
-
2014-02-18soldstatus $21,589 147-char remark
Show marketing remark (147 chars)
HUD #422-261161. SOLD AS-IS subject to HUD regulations/bid procedures. INSURED W/ Escrow($440). Bid deadline:DAILY. CLICK ON DOCS for further info.
-
2014-01-28historical 147-char remark
Show marketing remark (147 chars)
HUD #422-261161. SOLD AS-IS subject to HUD regulations/bid procedures. INSURED W/ Escrow($440). Bid deadline:DAILY. CLICK ON DOCS for further info.
-
2013-12-12$18,500 147-char remark
Show marketing remark (147 chars)
HUD #422-261161. SOLD AS-IS subject to HUD regulations/bid procedures. INSURED W/ Escrow($440). Bid deadline:DAILY. CLICK ON DOCS for further info.
-
2004-01-07soldstatus $44,000
-
2004-01-06soldstatus $43,900 235-char remark
Show marketing remark (235 chars)
Recent improvements include: new fixtures, interior paint, central heat and air, hot water heater, garage door, roof, front storm door. Hardwood floors in good condition. Cute home in nice neighborhood. Walking distance to elem school.
-
2003-12-08historical 235-char remark
Show marketing remark (235 chars)
Recent improvements include: new fixtures, interior paint, central heat and air, hot water heater, garage door, roof, front storm door. Hardwood floors in good condition. Cute home in nice neighborhood. Walking distance to elem school.
-
2003-11-19$42,900 235-char remark
Show marketing remark (235 chars)
Recent improvements include: new fixtures, interior paint, central heat and air, hot water heater, garage door, roof, front storm door. Hardwood floors in good condition. Cute home in nice neighborhood. Walking distance to elem school.
-
2003-10-27historical
-
2003-07-27$46,000
-
2003-04-15soldstatus $28,500
-
2003-04-03historical
-
2003-02-20$34,000
-
1993-08-02historical
-
1993-02-02$24,950
ⓘ Source: listings_history table (triggers on properties + properties_extension) + one-shot
backfill from property_details.listing_events for pre-trigger history.
Tax reassessment forecast OK · Resets to sale price
- Current annual tax
- $310 · $26/mo
- Projected year-2 tax
- $711 · $59/mo
- Expected delta
- +$401/yr (+$33/mo · 129.4%)
ⓘ Screening estimate from a state-policy table — verify with the county assessor before closing.
Climate risk First Street
- Flood 1/10 Low FEMA zone X (unshaded) · 0% chance over 30 yrs
- Wildfire 1/10 Low
- Heat 6/10 Major 7 d/yr ≥110°F today · 18 d/yr by 30 yrs out
- Wind 2/10 Low 4% chance of damaging wind over 30 yrs
- Air quality 3/10 Moderate 2 unhealthy d/yr today · 3 by 30 yrs out
Nearby sold comps map
Loading sold comps map…
Walkable amenities ~0.75 mi
Loading nearby amenities…
Taxation est. · year 1
- Rental income
- $11,660
- − Mortgage interest
- −$4,425
- − Property taxes
- −$310
- − Insurance
- −$395
- − Repairs & maintenance
- −$933
- − Management
- −$933
- − Depreciation
- −$2,298
- Taxable income
- $2,366
- Est. tax owed @ 24.0%
- −$568
- After-tax cash flow
- $2,967/yr
For passive investors: Depreciation is non-cash, so a rental often shows a tax loss while cash-flowing — sheltering income. Rental losses are passive: they offset passive income freely, and up to $25,000/yr can offset ordinary (W-2) income if you actively participate and your MAGI is under $100k (phasing out to $0 by $150k); unused losses carry forward. On sale, claimed depreciation is recaptured at up to 25%, and gains may owe capital-gains tax (a 1031 exchange can defer both). Figures are a year-1 estimate at your 24.0% rate — not tax advice; consult a CPA.
Schools (NCES district)
- District
- Tulsa
- NCES district ID
- 4030240
- Math proficiency
- 7% ▼ -9.00%
- Reading proficiency
- 12% ▼ -7.00%
- Median HH income
- $37,895
- Composite
- 8.04/100
- National rank
- #9919
- State rank
- #250 of 270 in OK
Livability — Tulsa
- Score
- 75/100
- State rank
- #13
- US rank
- #4058
Category grades
Schools grade is shown separately in the Schools card above.
Census & demographics
- Census place
- Tulsa, OK
- County
- Tulsa County · 640,811 people
- City population
- 389,418
- Metro
- Tulsa, OK
- Population (ZIP)
- 15,244
- Household income
- $42,054
- Rent vs Own
- Severe rent burden
- 528.0
Population outlook (Tulsa County) Hauer SSP2
- Today (2025)
- 723,846 people
- By 2030
- 766,033 · +5.8%
- By 2040
- 851,386 · +17.6%
- By 2050
- 938,389 · +29.6%
- By 2075
- 1,166,011 · +61.1%
- By 2100
- 1,350,277 · +86.5%
Race, ethnicity, and origin ACS 2023
- Neighborhood character
- Highly diverse neighborhood (Simpson 0.72)
- Race & ethnicity
- Hispanic / Latino 40% White 24% Black 24% Two or more races 16% Native American 6%
- Hispanic origin (detail)
- Mexican 36%
- Common ancestry
- Slovak 1%
- Foreign-born
- 17% · Canada
- Languages at home
- 62% English-only · Spanish 37%
Political lean MEDSL · Tulsa
- 2024 margin
- R (+15.2) · D 41.3% · R 56.5% · Other 2.2%
- 2008→2024 swing
- +9.2pp toward D · 2008: -24.5pp · 2024: -15.2pp
- All cycles
- 2024: R+15.2 2020: R+15.6 2016: R+22.9 2012: R+27.4 2008: R+24.5
Not yet ingested
- Civics
- —
Market trends
- HPI YoY
- ▲ 8.69%
- Current HPI
- 277.6663
- Rent YoY
- ▲ 1.78%
- Metro
- Tulsa, OK
- State GDP YoY
- ▲ 1.55%
- F500 in state
- 6
Industry mix (Fortune 500 HQ in OK)
| Industry | F500 HQs | Revenue |
|---|---|---|
| Energy | 3 | $48B |
|
||
Price history
+216.6% since first listed16 events — show timeline
- 2026-05-21 Pending — MLS Technology, Inc.
- 2026-05-06 Listed $79,000 MLS Technology, Inc.
- 2014-02-18 Sold (MLS) $21,589 MLS Technology, Inc.
- 2014-01-28 Listing Removed — MLS Technology, Inc.
- 2013-12-12 Listed $18,500 MLS Technology, Inc.
- 2004-01-07 Sold (Public Records) $44,000 Public Records
- 2004-01-06 Sold (MLS) $43,900 MLS Technology, Inc.
- 2003-12-08 Listing Removed — MLS Technology, Inc.
- 2003-11-19 Listed $42,900 MLS Technology, Inc.
- 2003-10-27 Listing Removed — MLS Technology, Inc.
- 2003-07-27 Listed $46,000 MLS Technology, Inc.
- 2003-04-15 Sold (MLS) $28,500 MLS Technology, Inc.
- 2003-04-03 Listing Removed — MLS Technology, Inc.
- 2003-02-20 Listed $34,000 MLS Technology, Inc.
- 1993-08-02 Listing Removed — MLS Technology, Inc.
- 1993-02-02 Listed $24,950 MLS Technology, Inc.
Property tax history
-6.8%/yrLatest (2025): $310 · -17.1% YoY. Source: county tax records.
Cash-flow waterfall
monthlySold comps — $/sqft
last 12 mo · ≤1 miLoading sold comps…