2234 Red Crossbill St · Wimauma, FL
Flood risk No data
- FEMA flood zone
- —
- Chance of flooding over 30 yrs
- —
- Est. flood insurance / yr
- —
Fire risk No data
- Est. fire insurance / yr
- —
Heat risk No data
- Hot days now (above threshold)
- —
- Hot days in 30 yrs
- —
Wind risk No data
- Chance of severe wind over 30 yrs
- —
Air-quality risk No data
- Unhealthy air days now
- —
- Unhealthy air days in 30 yrs
- —
Risk factors via First Street. Map © Google.
Why this score? — see what drove the D- grade
The composite is a weighted blend of 9 inputs, each scored 0–100. Each bar is that input's sub-score; the figure is the points it added to the 100-point composite (weight × sub-score).
- Cash flow +10.4/30.0
- ARV discount +7.5/15.0
- Schools +4.2/10.0
- Appreciation +3.8/10.0
- Livability +3.2/5.0
- 1% rule +3.1/10.0
- DSCR +3.0/10.0
- Condition / age +2.5/5.0
- Rent growth +1.9/5.0
$335,950
🖨 Deal sheet (PDF) 📄 Offer letter ✓ Due diligence
Listing remarks
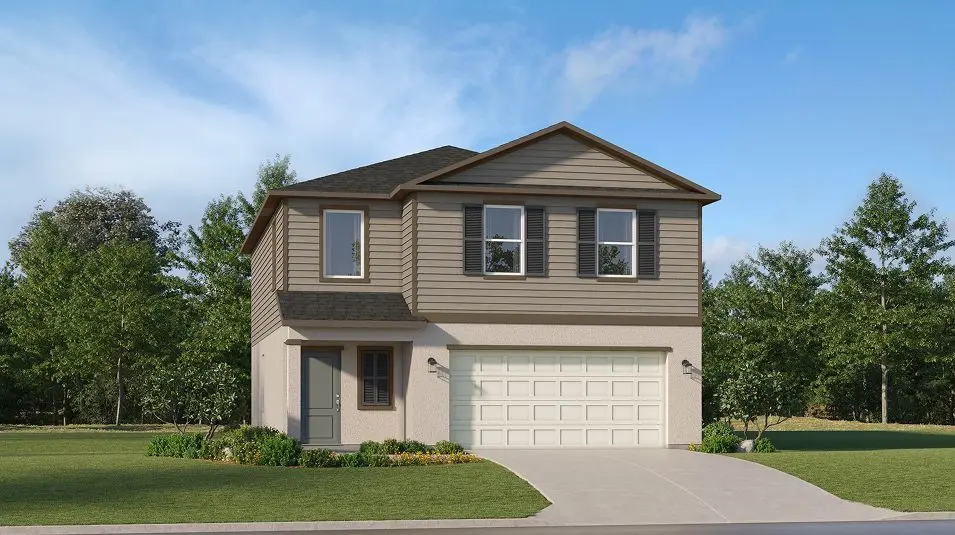
This expansive two-story home boasts a well-designed layout, featuring a first floor dedicated to shared living and entertaining. The open concept design seamlessly connects the kitchen, dining room and family room, with a patio extending the interior space outdoors. Upstairs, a spacious loft separates the three secondary bedrooms from the serene owner's suite. Completing the home is a convenient two-car garage.
Key facts
- Serene owner's suite
- Open concept design
- Spacious loft
Tags
Property features AI
Finance
- Financial info: List price $337,550
Exterior
- Parking: 2 garage spaces (2 total parking spaces)
- Home design: Single-family home
- Exterior features: Living area approximately 1,874
Interior
- Bedrooms: 4 bedrooms
- Bathrooms: 2 full bathrooms, 1 half bathroom
- Interior features: Spec new-construction home (Columbus plan)
Neighborhood map
What this means for you Summary
Snapshot
- This is a 4-bed/2.5-bath single-family listed at $336k.
Deal economics
- At list price, monthly cash flow is $-179 ($-2k/yr) — negative.
- To cash-flow at today's rent, offer at most $310k (7.7% below list).
- To meet the 1% rule (rent ≥ 1% of price), the offer needs to be $271k (19.3% below list).
- Recommended offer: $271k (19.3% below list) — sets the bar for 1% rule.
- Cap rate 5.7% vs local median 4.5% in Wimauma — meaningfully above typical; check what's discounted (condition, days-on-market, listing class) to confirm the premium yield is real.
Location & tenants
- Location reads 64/100 on livability (#699 in FL) — a middle-class / working-renter tenant base. Strengths: commute A, cost of living A-, crime B; Watch: amenities F, employment D-, health & safety F.
- Hillsborough (suburban): math 47% / reading 50% proficiency, ranked #41 of 73 in FL (top 56%) — families likely to look elsewhere, expect single-tenant / working-renter base with shorter leases.
- Zoned schools: Wimauma Elementary School (math 31% / reading 29%, grade F, #1,882 of 2,144 statewide, top 88%, 543 students, 81% FRL); Shields Middle School (math 29% / reading 27%, grade F, #486 of 571 statewide, top 86%, 1,867 students, 68% FRL); Lennard High School (math 30% / reading 46%, grade F, #328 of 667 statewide, top 50%, 2,404 students, 47% FRL).
- Zoned-school proficiency averages 32% at this address vs 48% district-wide (-16 pts) — the specific schools serving this property underperform the Hillsborough average; the district grade overstates school quality for this exact location.
- Market conditions: Rents soft (-2.5%/yr); 689 active listings in the ZIP; 27 comparable units currently listed for rent nearby; rentals at typical pace (median 26d on market — plan ~3-4 weeks tenant-placement turnaround); solid renter incomes; 9,053 units permitted in Hillsborough County in 2024 (4,555 in 5+ unit buildings).
- This rent runs 33% of the median local income ($98k/yr) — at the standard rent-burdened threshold; future hikes will face affordability resistance.
Forward outlook
- Local home prices are declining (-2.4%/yr); year-one equity from $2k of loan paydown is wiped out by about $8k of value loss. Plan a longer hold.
- Hillsborough County population projected at +37% by 2050 — long-run rental-demand tailwind backs the buy-and-hold thesis.
Negotiation context
- It's been on market 42 days — a 3% lower offer ($326k) is reasonable based on typical stale-listing flexibility.
Questions for the listing agent
- What do current leases actually rent for vs. the listed asking? Can we see a recent rent roll and the last 12 months of T-12 income?
- It's been on market 42 days. Have you received any prior offers? Is the seller open to a 19% concession, seller financing, or rate buy-down credit?
- Is there a deadline driving the sale (1031 exchange, divorce, estate, relocation)? That informs how much negotiation room exists.
- Schools are F-rated, which usually means shorter tenancies and higher turnover. Who's the typical renter profile here, and what's been the actual vacancy rate?
- The area grade is low — what's the realistic commute time and amenity access for the typical tenant pool here? Any planned neighborhood developments (good or bad) we should know about?
- What's the average days-on-market for RENTAL listings here right now (not sales)? A rising rental-DOM trend means longer vacancies and softer asking-rent achievability than the comps imply.
- What's the recent tenant-quality profile in this submarket — average credit score on applications, eviction rate, late-payment / NSF rate, and stable-employment percentage? A property-management company in the area should have these aggregated.
- How much new for-sale + rental construction is in the pipeline within 1–3 miles? Heavy new supply typically softens prices + rents 12–24 months out; constrained supply supports both.
Investment metrics
- 1% rule
- 0.81% ✗
- Cap rate
- 5.65%
- Cash-on-cash
- -2.28%
- DSCR
- 0.90
- GRM
- 10.3
CMA / ARV
No comps found within radius.
Projected returns pro-forma
-2.35% appreciation · 0.0% rent growth · sell at horizon
- IRR
- -18.8%
- Equity multiple
- 0.31×
- Total profit
- $-64,451
- Equity at exit
- $59,958
- IRR
- -17.1%
- Equity multiple
- 0.01×
- Total profit
- $-93,206
- Equity at exit
- $46,282
Cash invested: $94,066 (down + closing). Projections, not guarantees.
Landlord ↔ Tenant lean methodology
- Overall (STATE)
- 87 Strongly Landlord-Friendly
- State Florida
- 87 Strongly Landlord-Friendly · R+3
- County
- — inherits STATE
- City
- — inherits STATE
ZIP-level market 33598
- Home prices YoY
- -0.9%
- Rents YoY
- -2.5%
- Active inventory
- 689
- Price-to-rent
- 10.3×
Monthly cashflow live
- Estimated rent
- $2,713 high interval (Pro) →
- Mortgage (P&I)
- −$1,762
- Tax est. 1.5%
- −$420 /mo · $5,039/yr
- Insurance
- −$140
- HOA
- −$0
- Vacancy / Maint / Mgmt
- −$570
- Net cashflow
- $-179
Break-even live
Sensitivity live
| Price | -10% $54 | -5% $-63 | +0% $-179 | +5% $-295 | +10% $-411 |
|---|---|---|---|---|---|
| Rent | -10% $-393 | -5% $-286 | +0% $-179 | +5% $-71 | +10% $36 |
| Rate | -1.0pp $-9 | -0.5pp $-93 | base $-179 | +0.5pp $-266 | +1.0pp $-354 |
UW: 25.0% down · 7.5% · 30yr · 1.5% tax · 5.0% vac · 8.0% maint · 8.0% mgmt
Financing live
Cash to close
- Down payment
- $83,988
- Closing costs
- $10,078
- Reserves months
- —
- Total cash needed
- —
Loan-product check · same deal, 3 products live
Conventional
25% down · 7.5% · 30yr
- Down + closing
- —
- Monthly P&I
- —
- Monthly cashflow
- —
- DSCR
- —
- Eligible?
- —
Personal DTI + credit; lowest rate.
DSCR
20% down · 8.5% · 30yr
- Down + closing
- —
- Monthly P&I
- —
- Monthly cashflow
- —
- DSCR
- —
- Eligible?
- —
No personal income docs; deal must DSCR.
Hard money
10% down · 12.0% · 12mo
- Down + closing
- —
- Monthly P&I
- —
- Monthly cashflow
- —
- DSCR
- —
- Eligible?
- —
Short-term bridge; refi at stabilization.
Rent comps 27 comps
| Address | Beds | Baths | Sqft | Rent | $/sqft | DOM | Units | Dist |
|---|---|---|---|---|---|---|---|---|
| 5771 Red Kite Dr Wimauma, FL | 5.0 | 3.0 | 2200 | $2,650 | $1.20 | 26d | 1 | 0.12mi |
| 5757 Red Kite Dr Wimauma, FL | 5.0 | 3.0 | 2200 | $2,630 | $1.20 | 12d | 1 | 0.14mi |
| 5615 Red Kite Dr Wimauma, FL | 5.0 | 3.0 | 2112 | $3,000 | $1.42 | 4d | 1 | 0.24mi |
| 2467 White Ladyfish Rd Wimauma, FL | 3.0 | 2.0 | 1496 | $2,100 | $1.40 | 26d | 1 | 0.65mi |
| 17224 Auburn Arch Loop Wimauma, FL | 2.0–4.0 | 2.5 | 1517 | $2,900 | $1.91 | 19d | 20 | 0.78mi |
| 17042 Oval Rum Dr Wimauma, FL | 3.0 | 2.0 | 1516 | $2,500 | $1.65 | 19d | 1 | 0.92mi |
| 17029 Blister Wing Dr Wimauma, FL | 4.0 | 2.5 | 2328 | $3,000 | $1.29 | 1d | 1 | 0.96mi |
| 17247 Southern Haven Dr Wimauma, FL | 3.0 | 2.5 | 1660 | $2,300 | $1.39 | 19d | 1 | 1.02mi |
| 16634 Mooner Plank Cir Wimauma, FL | 4.0 | 2.5 | 2035 | $2,550 | $1.25 | 26d | 1 | 1.19mi |
| 17134 White Mangrove Dr Wimauma, FL | 4.0 | 2.0 | 1935 | $2,395 | $1.24 | 26d | 1 | 1.36mi |
| 17132 White Mangrove Dr Wimauma, FL | 3.0 | 2.0 | 1561 | $2,100 | $1.35 | 0d | 1 | 1.36mi |
| 5091 Capri Harbor Dr Wimauma, FL | 3.0 | 2.5 | 1634 | $2,201 | $1.35 | 26d | 1 | 1.39mi |
| 5089 Capri Harbor Dr Wimauma, FL | 3.0 | 2.5 | 1634 | $2,201 | $1.35 | 26d | 1 | 1.39mi |
| 5085 Capri Harbor Dr Wimauma, FL | 3.0 | 2.5 | 1634 | $2,201 | $1.35 | 26d | 1 | 1.40mi |
| 16638 Ancient Mariner Ln Wimauma, FL | 3.0 | 2.5 | 1634 | $2,276 | $1.39 | 23d | 1 | 1.40mi |
| 16616 Ancient Mariner Ln Wimauma, FL | 3.0 | 2.5 | 1634 | $2,276 | $1.39 | 23d | 1 | 1.40mi |
| 16610 Ancient Mariner Ln Wimauma, FL | 3.0 | 2.5 | 1634 | $2,176 | $1.33 | 26d | 1 | 1.41mi |
| 5029 Sable Chime Dr Wimauma, FL | 3.0 | 2.0 | 1451 | $2,420 | $1.67 | 16d | 1 | 1.41mi |
| 16660 Ancient Mariner Ln Wimauma, FL | 3.0 | 2.5 | 1634 | $2,276 | $1.39 | 26d | 1 | 1.42mi |
| 16611 Ancient Mariner Ln Wimauma, FL | 3.0 | 2.5 | 1634 | $2,176 | $1.33 | 22d | 1 | 1.42mi |
| 16676 Ancient Mariner Ln Wimauma, FL | 3.0 | 2.5 | 1634 | $2,201 | $1.35 | 26d | 1 | 1.44mi |
| 16665 Ancient Mariner Ln Wimauma, FL | 3.0 | 2.5 | 1634 | $2,101 | $1.29 | 26d | 1 | 1.45mi |
| 16667 Ancient Mariner Ln Wimauma, FL | 3.0 | 2.5 | 1634 | $2,101 | $1.29 | 26d | 1 | 1.45mi |
| 16671 Ancient Mariner Ln Wimauma, FL | 3.0 | 2.5 | 1634 | $2,101 | $1.29 | 26d | 1 | 1.45mi |
| 16705 Myrtle Sand Dr Wimauma, FL | 3.0 | 2.0 | 1253 | $2,350 | $1.88 | 26d | 1 | 1.46mi |
| 5017 Capri Harbor Dr Wimauma, FL | 3.0 | 2.5 | 1634 | $2,101 | $1.29 | 22d | 1 | 1.47mi |
| 5010 Capri Harbor Dr Wimauma, FL | 3.0 | 2.5 | 1634 | $2,101 | $1.29 | 26d | 1 | 1.50mi |
Listing history 19 events
-
2026-06-21days on market $335,950 Active 42 DOM
-
2026-06-18days on market $335,950 Active 39 DOM
-
2026-06-17days on market $335,950 Active 38 DOM
-
2026-06-16days on market $335,950 Active 37 DOM
-
2026-06-15price $335,950 Active 36 DOM
-
2026-06-15pricedays on market $335,850 Active 36 DOM
-
2026-06-13days on market $335,750 Active 34 DOM
-
2026-06-13days on market $335,750 Active 33 DOM
-
2026-06-09days on market $335,750 Active 30 DOM
-
2026-06-08pricedays on market $335,750 Active 29 DOM
-
2026-06-07days on market $335,650 Active 28 DOM
-
2026-06-04days on market $335,650 Active 25 DOM
-
2026-06-03days on market $335,650 Active 24 DOM
-
2026-06-02pricedays on market $335,650 Active 23 DOM
-
2026-06-01days on market $337,650 Active 22 DOM
-
2026-05-31days on market $337,650 Active 21 DOM
-
2026-05-18price $337,450 415-char remark
-
2026-05-11price $337,350 415-char remark
-
2026-05-10$336,850 Active 415-char remark
ⓘ Source: listings_history table (triggers on properties + properties_extension) + one-shot
backfill from property_details.listing_events for pre-trigger history.
Nearby sold comps map
Loading sold comps map…
Walkable amenities ~0.75 mi
Loading nearby amenities…
Taxation est. · year 1
- Rental income
- $32,552
- − Mortgage interest
- −$18,818
- − Property taxes
- −$5,039
- − Insurance
- −$1,680
- − Repairs & maintenance
- −$2,604
- − Management
- −$2,604
- − Depreciation
- −$9,773
- Taxable loss
- −$7,967
- Est. tax savings @ 24.0%
- +$1,912
- After-tax cash flow
- $-232/yr
For passive investors: Depreciation is non-cash, so a rental often shows a tax loss while cash-flowing — sheltering income. Rental losses are passive: they offset passive income freely, and up to $25,000/yr can offset ordinary (W-2) income if you actively participate and your MAGI is under $100k (phasing out to $0 by $150k); unused losses carry forward. On sale, claimed depreciation is recaptured at up to 25%, and gains may owe capital-gains tax (a 1031 exchange can defer both). Figures are a year-1 estimate at your 24.0% rate — not tax advice; consult a CPA.
Schools (NCES district)
- District
- Hillsborough
- NCES district ID
- 1200870
- Math proficiency
- 47% ▼ -8.00%
- Reading proficiency
- 50% ▼ -4.00%
- Median HH income
- $50,622
- Composite
- 41.6/100
- National rank
- #3435
- State rank
- #41 of 73 in FL
Livability — Wimauma
- Score
- 64/100
- State rank
- #699
- US rank
- #14659
Category grades
Schools grade is shown separately in the Schools card above.
Census & demographics
- Census place
- Wimauma, FL
- County
- Hillsborough County · 1,540,968 people
- City population
- 32,820
- Metro
- Tampa-St. Petersburg-Clearwater, FL
- Population (ZIP)
- 32,820
- Household income
- $97,520
- Rent vs Own
- Severe rent burden
- 149.0
Population outlook (Hillsborough County) Hauer SSP2
- Today (2025)
- 1,607,022 people
- By 2030
- 1,733,968 · +7.9%
- By 2040
- 1,979,565 · +23.2%
- By 2050
- 2,203,427 · +37.1%
- By 2075
- 2,667,893 · +66.0%
- By 2100
- 2,891,558 · +79.9%
Race, ethnicity, and origin ACS 2023
- Neighborhood character
- Diverse neighborhood (Simpson 0.67)
- Race & ethnicity
- White 40% Hispanic / Latino 39% Black 14% Two or more races 11% Asian 2%
- Hispanic origin (detail)
- Mexican 26% Puerto Rican 3% Cuban 1%
- Common ancestry
- Romanian 2% Scotch-Irish 2% Lithuanian 1%
- Foreign-born
- 23% · Canada, Jamaica, Guatemala
- Languages at home
- 62% English-only · Spanish 35% Other Indo-European 1% Arabic 1%
Political lean MEDSL · Hillsborough
- 2024 margin
- Toss-up / Even · D 47.8% · R 50.9% · Other 1.3%
- 2008→2024 swing
- -10.2pp toward R · 2008: 7.1pp · 2024: -3.1pp
- All cycles
- 2024: R+3.1 2020: D+6.9 2016: D+6.8 2012: D+6.7 2008: D+7.1
Not yet ingested
- Civics
- —
Market trends
- HPI YoY
- ▼ -2.35%
- Current HPI
- 271.8552
- Rent YoY
- ▼ -2.50%
- Metro
- Tampa-St. Petersburg-Clearwater, FL
- State GDP YoY
- ▲ 3.28%
- F500 in state
- 36
Industry mix (Fortune 500 HQ in FL)
| Industry | F500 HQs | Revenue |
|---|---|---|
| Industrial Technology | 2 | $29B |
|
||
| Insurance | 2 | $17B |
|
||
| Retail | 1 | $60B |
|
||
| Technology Distribution | 1 | $58B |
|
||
| Homebuilding | 1 | $35B |
|
||
| Technology Manufacturing | 1 | $35B |
|
||
Cash-flow waterfall
monthlySold comps — $/sqft
last 12 mo · ≤1 miLoading sold comps…