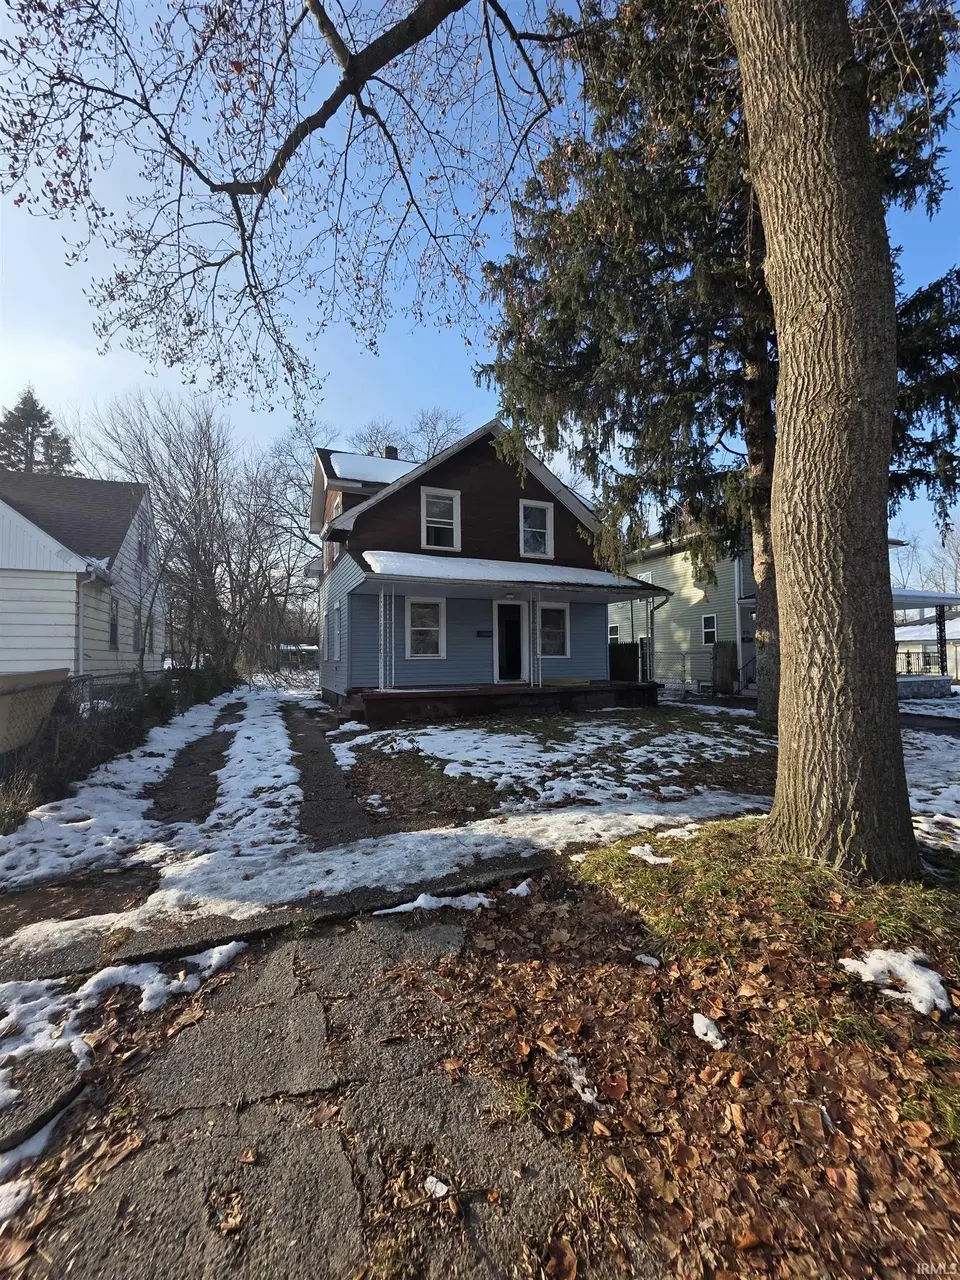
1129 Huey St · South Bend, IN
Flood risk 1/10 · Minimal
- FEMA flood zone
- X (unshaded)
- Chance of flooding over 30 yrs
- 0.0%
- Est. flood insurance / yr
- $473 – $860
Fire risk 1/10 · Minimal
- Est. fire insurance / yr
- $717 – $1,331
Heat risk 2/10 · Minimal
- Hot days now (above 99°F)
- 7 days/yr
- Hot days in 30 yrs
- 16 days/yr
Wind risk 2/10 · Minimal
- Chance of severe wind over 30 yrs
- —
Air-quality risk 3/10 · Minor
- Unhealthy air days now
- 3 days/yr
- Unhealthy air days in 30 yrs
- 3 days/yr
Risk factors via First Street. Map © Google.
Why this score? — see what drove the B+ grade
The composite is a weighted blend of 9 inputs, each scored 0–100. Each bar is that input's sub-score; the figure is the points it added to the 100-point composite (weight × sub-score).
- Cash flow +30.0/30.0
- ARV discount +15.0/15.0
- 1% rule +10.0/10.0
- DSCR +10.0/10.0
- Rent growth +4.2/5.0
- Livability +3.2/5.0
- Condition / age +2.5/5.0
- Schools +1.4/10.0
- Appreciation +0.0/10.0
$57,500
🖨 Deal sheet 📄 Offer letter ✓ Due diligence
Listing remarks
Calling all investors, flippers, or handy buyers! This is a great opportunity with excellent potential for rental, flip, or to renovate your own home in a desirable location. Home is cleaned out and ready for rehab. Property to be sold As-Is
Key facts
- 5,200 sq ft lot
- Built 1919
- Listed 7 days
Property features AI
Finance
- Financial info: Annual taxes listed at $780
Exterior
- Utilities: Public water; Public sewer
- Home design: Single-family site-built home; 2 stories
- Construction: Built with other construction materials
- Exterior features: Lot dimensions approximately 40 x 130; Lot about 0.12 acres
Interior
- Bathrooms: 1 full bathroom
- Heating & cooling: Forced air heating; No air conditioning
- Interior features: 8 total rooms; Unfinished basement
- Laundry & utility: Laundry in basement
Neighborhood map
What this means for you Summary
Snapshot
- This is a 4-bed/1.5-bath single-family listed at $58k.
Deal economics
- At list price, monthly cash flow is $691 ($8k/yr) — positive.
- The deal already cash-flows at list — no discount required.
- Meets the 1% rule at list price ($1k rent vs $58k).
- Cap rate 20.7% vs local median 4.4% in South Bend — top-decile yield for the area; either an underpriced asset or a hidden risk that comps aren't pricing in. Stress-test before assuming the spread holds.
Location & tenants
- Location reads 64/100 on livability (#365 in IN) — a middle-class / working-renter tenant base. Strengths: cost of living A+, housing A+, health & safety A+; Watch: amenities D, employment D, crime F.
- South Bend Community School Corporation (urban): math 12% / reading 21% proficiency, ranked #284 of 301 in IN (top 94%) — low school quality limits family demand, transient renter base, plan for 1-2y turnover; 66% free/reduced lunch — lower-income household profile, screen leases tightly.
- Zoned schools: Muessel Elementary School (math 2% / reading 2%, grade F, #989 of 994 statewide, top 100%, 241 students, 88% FRL); Jefferson Traditional School (math 12% / reading 22%, grade F, #284 of 330 statewide, top 87%, 516 students, 64% FRL); Adams High School (math 28% / reading 57%, grade F, #195 of 369 statewide, top 53%, 1,976 students, 56% FRL) — zoned schools at 69% FRL track the district average.
- Market conditions: Rents rising fast (+6.8%/yr); 424 active listings in the ZIP; 12 comparable units currently listed for rent nearby; rentals at typical pace (median 21d on market — plan ~3-4 weeks tenant-placement turnaround); 754 units permitted in St. Joseph County in 2024 (460 in 5+ unit buildings).
Forward outlook
- Local home prices are declining (-3.0%/yr); year-one equity from $398 of loan paydown is wiped out by about $2k of value loss. Plan a longer hold.
- At projected returns (-3.0% appreciation + 6.8% rent growth), your $16k cash investment doubles in ~3 years — after that, you're playing with house money.
Negotiation context
- Only 7 days on market — expect competitive offers; lowballing is unlikely to land.
- 2 sale attempts since 10y ago with the ask held roughly flat each time — persistent listings suggest the price (not the market) is what's stuck; bring a comps-based counter.
Risks & watch-outs
- Watch-outs: built in 1919 — expect roof / HVAC / electrical / plumbing capex.
Questions for the listing agent
- Built in 1919 — when were the roof, HVAC, electrical panel, plumbing, and water heater last replaced?
- Is there a deadline driving the sale (1031 exchange, divorce, estate, relocation)? That informs how much negotiation room exists.
- Schools are F-rated, which usually means shorter tenancies and higher turnover. Who's the typical renter profile here, and what's been the actual vacancy rate?
- Crime grade is F in this area — have there been break-ins, vandalism, or insurance claims at this property in the last 3 years? What carrier currently insures it and at what premium?
- What's the average days-on-market for RENTAL listings here right now (not sales)? A rising rental-DOM trend means longer vacancies and softer asking-rent achievability than the comps imply.
- What's the recent tenant-quality profile in this submarket — average credit score on applications, eviction rate, late-payment / NSF rate, and stable-employment percentage? A property-management company in the area should have these aggregated.
- How much new for-sale + rental construction is in the pipeline within 1–3 miles? Heavy new supply typically softens prices + rents 12–24 months out; constrained supply supports both.
Investment metrics
- 1% rule
- 2.38% ✓
- Cap rate
- 20.72%
- Cash-on-cash
- 51.54%
- DSCR
- 3.29
- GRM
- 3.5
CMA / ARV
- ARV (on-the-fly)
- $114,240
- Comps found
- 12
Show comp detail 12 sales within ~0.75 mi
| Address | Dist | Beds/Ba | Sqft | Sold | Price | $/sf | Match |
|---|---|---|---|---|---|---|---|
| 1119 College St | 0.25mi | 3/1.0 (-1) | 960 (0%) | 3mo | $121,000 | $126 | 79 |
| 1122 Fremont St | 0.16mi | 3/1.0 (-1) | 1,008 (+5%) | 2mo | $120,000 | $119 | 75 |
| 1233 Huey St | 0.11mi | 3/1.0 (-1) | 1,008 (+5%) | 5mo | $75,000 | $74 | 75 |
| 1234 Obrien St | 0.14mi | 3/1.0 (-1) | 1,058 (+10%) | 3mo | $47,500 | $45 | 67 |
| 2317 Roger St | 0.52mi | 3/1.0 (-1) | 995 (+4%) | 4mo | $146,000 | $147 | 60 |
| 1414 Wilber St | 0.49mi | 3/1.0 (-1) | 1,020 (+6%) | 0mo | $118,000 | $116 | 59 |
| 2226 Roger St | 0.54mi | 3/1.0 (-1) | 936 (-2%) | 6mo | $57,150 | $61 | 59 |
| 1310 N Brookfield St | 0.26mi | 3/1.0 (-1) | 1,092 (+14%) | 2mo | $140,000 | $128 | 57 |
| 1233 Wilber St | 0.39mi | 3/1.0 (-1) | 1,079 (+12%) | 0mo | $67,490 | $63 | 54 |
| 925 Sancome Ave | 0.49mi | 3/1.0 (-1) | 864 (-10%) | 1mo | $108,000 | $125 | 52 |
| 1838 N Brookfield St | 0.74mi | 3/1.0 (-1) | 1,008 (+5%) | 4mo | $155,000 | $154 | 47 |
| 2121 Linden Ave | 0.73mi | 3/1.0 (-1) | 1,072 (+12%) | 2mo | $70,000 | $65 | 38 |
Match score weights: distance 35% · size 25% · config 20% · recency 20%. Top-matched comps best support the ARV.
Projected returns pro-forma
-3.0% appreciation · 6.78% rent growth · sell at horizon
- IRR
- 53.6%
- Equity multiple
- 3.49×
- Total profit
- $40,132
- Equity at exit
- $8,573
- IRR
- 60.3%
- Equity multiple
- 8.18×
- Total profit
- $115,651
- Equity at exit
- $4,972
Cash invested: $16,100 (down + closing). Projections, not guarantees.
Landlord ↔ Tenant lean methodology
- Overall (STATE)
- 90 Strongly Landlord-Friendly
- State Indiana
- 90 Strongly Landlord-Friendly · R+11
- County
- — inherits STATE
- City
- — inherits STATE
ZIP-level market 46628
- Rents YoY
- 6.8%
- Active inventory
- 424
- Price-to-rent
- 3.5×
Monthly cashflow live
- Estimated rent
- $1,367 high interval (Pro) →
- Mortgage (P&I)
- −$302
- Tax from tax record
- −$63 /mo · $754/yr
- Insurance
- −$24
- HOA
- −$0
- Vacancy / Maint / Mgmt
- −$287
- Net cashflow
- $691
Break-even live
UW: 25.0% down · 7.5% · 30yr · 1.5% tax · 5.0% vac · 8.0% maint · 8.0% mgmt
Financing live
Cash to close
- Down payment
- $14,375
- Closing costs
- $1,725
- Reserves months
- —
- Total cash needed
- —
Loan-product check · same deal, 3 products live
Conventional
25% down · 7.5% · 30yr
- Down + closing
- —
- Monthly P&I
- —
- Monthly cashflow
- —
- DSCR
- —
- Eligible?
- —
Personal DTI + credit; lowest rate.
DSCR
20% down · 8.5% · 30yr
- Down + closing
- —
- Monthly P&I
- —
- Monthly cashflow
- —
- DSCR
- —
- Eligible?
- —
No personal income docs; deal must DSCR.
Hard money
10% down · 12.0% · 12mo
- Down + closing
- —
- Monthly P&I
- —
- Monthly cashflow
- —
- DSCR
- —
- Eligible?
- —
Short-term bridge; refi at stabilization.
Rent comps 12 comps
| Address | Beds | Baths | Sqft | Rent | $/sqft | DOM | Units | Dist |
|---|---|---|---|---|---|---|---|---|
| 1141 Fremont St South Bend, IN | 3.0 | 1.0 | 760 | $1,100 | $1.45 | 21d | 1 | 0.16mi |
| 2013 Elwood Ave South Bend, IN | 3.0 | 1.0 | 720 | $999 | $1.39 | 44d | 1 | 0.31mi |
| 1505 Huey St South Bend, IN | 3.0 | 1.0 | 864 | $1,425 | $1.65 | 21d | 1 | 0.34mi |
| 1630 Obrien St South Bend, IN | 3.0 | 1.0 | 1120 | $1,400 | $1.25 | 13d | 1 | 0.47mi |
| 1710 Johnson St South Bend, IN | 3.0 | 1.0 | 1000 | $1,350 | $1.35 | 44d | 1 | 0.57mi |
| 736 Lawndale Ave Unit 1 South Bend, IN | 3.0 | 1.0 | 1072 | $1,200 | $1.12 | 13d | 1 | 0.67mi |
| 1214 Queen St South Bend, IN | 3.0 | 1.0 | 1056 | $1,300 | $1.23 | 13d | 1 | 0.83mi |
| 1428 Kessler Blvd South Bend, IN | 3.0 | 1.0 | 936 | $1,000 | $1.07 | 44d | 1 | 0.84mi |
| 910 Allen St South Bend, IN | 3.0 | 1.0 | 1100 | $1,350 | $1.23 | 21d | 1 | 0.85mi |
| 1033 Beale St South Bend, IN | 3.0 | 1.0 | 840 | $1,250 | $1.49 | 21d | 1 | 1.08mi |
| 208 S Bendix Dr South Bend, IN | 3.0 | 1.0 | 864 | $1,150 | $1.33 | 21d | 1 | 1.17mi |
| 344 Parkovash Ave South Bend, IN | 3.0 | 1.0 | 950 | $1,900 | $2.00 | 13d | 1 | 1.37mi |
Listing history 8 events
-
2026-06-07statusdays on market $57,500 Pending 7 DOM
-
2026-06-03days on market $57,500 Active 6 DOM
-
2026-06-02days on market $57,500 Active 5 DOM
-
2026-06-01days on market $57,500 Active 4 DOM
-
2026-05-31days on market $57,500 Active 3 DOM
-
2026-05-30days on market $57,500 Active 2 DOM
-
2026-05-28$57,500 Active
-
2016-02-01$25,900
ⓘ Source: listings_history table (triggers on properties + properties_extension) + one-shot
backfill from property_details.listing_events for pre-trigger history.
Tax reassessment forecast IN · Partial reset (capped growth)
- Current annual tax
- $754 · $63/mo
- Projected year-2 tax
- $754 · $63/mo
- Expected delta
- $0/yr ($0/mo · 0.0%)
ⓘ Screening estimate from a state-policy table — verify with the county assessor before closing.
Climate risk First Street
- Flood 1/10 Low FEMA zone X (unshaded) · 0% chance over 30 yrs
- Wildfire 1/10 Low
- Heat 2/10 Low 7 d/yr ≥99°F today · 16 d/yr by 30 yrs out
- Wind 2/10 Low
- Air quality 3/10 Moderate 3 unhealthy d/yr today · 3 by 30 yrs out
Nearby sold comps map
Loading sold comps map…
Walkable amenities ~0.75 mi
Loading nearby amenities…
Taxation est. · year 1
- Rental income
- $16,402
- − Mortgage interest
- −$3,221
- − Property taxes
- −$754
- − Insurance
- −$288
- − Repairs & maintenance
- −$1,312
- − Management
- −$1,312
- − Depreciation
- −$1,673
- Taxable income
- $7,842
- Est. tax owed @ 24.0%
- −$1,882
- After-tax cash flow
- $6,415/yr
For passive investors: Depreciation is non-cash, so a rental often shows a tax loss while cash-flowing — sheltering income. Rental losses are passive: they offset passive income freely, and up to $25,000/yr can offset ordinary (W-2) income if you actively participate and your MAGI is under $100k (phasing out to $0 by $150k); unused losses carry forward. On sale, claimed depreciation is recaptured at up to 25%, and gains may owe capital-gains tax (a 1031 exchange can defer both). Figures are a year-1 estimate at your 24.0% rate — not tax advice; consult a CPA.
Schools (NCES district)
- District
- South Bend Community School Corporation
- NCES district ID
- 1810290
- Math proficiency
- 12% ▼ -10.00%
- Reading proficiency
- 21% ▼ -6.00%
- Median HH income
- $41,935
- Composite
- 14.21/100
- National rank
- #9452
- State rank
- #284 of 301 in IN
Livability — South Bend
- Score
- 64/100
- State rank
- #365
- US rank
- #13730
Category grades
Schools grade is shown separately in the Schools card above.
Census & demographics
- Census place
- South Bend, IN
- County
- Saint Joseph County · 189,048 people
- City population
- 99,767
- Metro
- South Bend-Mishawaka, IN-MI
- Population (ZIP)
- 27,685
- Household income
- $61,759
- Rent vs Own
- Severe rent burden
- 1024.0
Population outlook (St. Joseph County) Hauer SSP2
- Today (2025)
- 273,186 people
- By 2030
- 273,594 · +0.1%
- By 2040
- 271,641 · -0.6%
- By 2050
- 269,187 · -1.5%
- By 2075
- 263,136 · -3.7%
- By 2100
- 245,659 · -10.1%
Race, ethnicity, and origin ACS 2023
- Neighborhood character
- Diverse neighborhood (Simpson 0.60)
- Race & ethnicity
- White 55% Black 30% Hispanic / Latino 10% Two or more races 8%
- Hispanic origin (detail)
- Mexican 8%
- Common ancestry
- Romanian 12% Lithuanian 1% Slovak 1%
- Foreign-born
- 7% · Canada, China
- Languages at home
- 89% English-only · Spanish 7% Russian/Polish/Slavic 1%
Political lean MEDSL · St. Joseph
- 2024 margin
- Toss-up / Even · D 50.0% · R 48.5% · Other 1.5%
- 2008→2024 swing
- -15.6pp toward R · 2008: 17.1pp · 2024: 1.5pp
- All cycles
- 2024: D+1.5 2020: D+5.8 2016: D+0.2 2012: D+3.5 2008: D+17.1
Not yet ingested
- Civics
- —
Market trends
- HPI YoY
- ▼ -130.47%
- Current HPI
- 202.112
- Rent YoY
- ▲ 6.78%
- Metro
- South Bend-Mishawaka, IN-MI
- State GDP YoY
- ▲ 2.90%
- F500 in state
- 18
Industry mix (Fortune 500 HQ in IN)
| Industry | F500 HQs | Revenue |
|---|---|---|
| Industrial Machinery | 2 | $37B |
|
||
| Healthcare | 1 | $177B |
|
||
| Pharmaceuticals | 1 | $45B |
|
||
| Metals / Steel | 1 | $18B |
|
||
| Agriculture | 1 | $17B |
|
||
| Packaging | 1 | $12B |
|
||
Price history
+122.0% since first listed2 events — show timeline
- 2026-05-28 Listed $57,500 IRMLS
- 2016-02-01 Listed $25,900 IRMLS
Property tax history
-7.2%/yrLatest (2024): $754 · -1.4% YoY. Source: county tax records.
Cash-flow waterfall
monthlySold comps — $/sqft
last 12 mo · ≤1 miLoading sold comps…