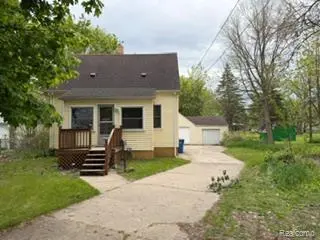
3992 Dallas Ave · Warren, MI
Flood risk 9/10 · Severe
- FEMA flood zone
- X (unshaded)
- Chance of flooding over 30 yrs
- 0.99%
- Est. flood insurance / yr
- $507 – $1,088
Fire risk 1/10 · Minimal
- Est. fire insurance / yr
- $784 – $1,456
Heat risk 3/10 · Minor
- Hot days now (above 97°F)
- 7 days/yr
- Hot days in 30 yrs
- 15 days/yr
Wind risk 1/10 · Minimal
- Chance of severe wind over 30 yrs
- —
Air-quality risk 3/10 · Minor
- Unhealthy air days now
- 3 days/yr
- Unhealthy air days in 30 yrs
- 5 days/yr
Risk factors via First Street. Map © Google.
Why this score? — see what drove the C grade
The composite is a weighted blend of 9 inputs, each scored 0–100. Each bar is that input's sub-score; the figure is the points it added to the 100-point composite (weight × sub-score).
- Cash flow +23.9/30.0
- ARV discount +9.0/15.0
- DSCR +7.7/10.0
- 1% rule +5.7/10.0
- Livability +3.7/5.0
- Rent growth +3.1/5.0
- Condition / age +2.5/5.0
- Schools +1.3/10.0
- Appreciation +0.0/10.0
$129,000
🖨 Deal sheet 📄 Offer letter ✓ Due diligence
Listing remarks MLS
Good condition bungalow on a very deep (301') almost half acre lot on a full basement with a huge 3 car garage. Good condition original kitchen with included stainless steel range and 2 door/2 drawer stainless steel refrigerator. Good condition bathroom with newer appearing vanity, top, toilet and acrylic tub with acrylic surround. Hardwood floors throughout. Clean open basement with included front load washer and dryer. All room sizes and counts are estimates. Information in this listing is deemed reliable but not guaranteed. No FHA offers please. Owner is a licensed broker in the state of Michigan.
Key facts
- Deep lot
- Full basement
- Acrylic tub
Tags
Property features AI
Exterior
- Parking: Detached 3-car garage
- Utilities: Public water; Public sewer
- Home design: Single-family residence; One and one-half stories; Ground-level entry with steps; Aluminum siding
- Construction: Block foundation
- Exterior features: Paved road access; Lot approximately 0.46 acre (67 x 301)
Interior
- Kitchen: Free-standing gas range; Free-standing refrigerator; Stainless steel appliances
- Bathrooms: 1 full bathroom
- Heating & cooling: Forced air heating (natural gas); Ceiling fans; No central air
- Interior features: Unfinished basement; Total of 5 rooms
- Laundry & utility: Washer; Dryer; Gas water heater
Neighborhood map
What this means for you Summary
Snapshot
- This is a 2-bed/1.0-bath single-family listed at $129k.
Deal economics
- At list price, monthly cash flow is $184 ($2k/yr) — positive.
- The deal already cash-flows at list — no discount required.
- Meets the 1% rule at list price ($1k rent vs $129k).
- Cap rate 8.6% vs local median 5.3% in Warren — top-decile yield for the area; either an underpriced asset or a hidden risk that comps aren't pricing in. Stress-test before assuming the spread holds.
Location & tenants
- Location reads 74/100 on livability (#171 in MI, #4,491 nationally) — a middle-class / working-renter tenant base. Strengths: commute A+, cost of living A+, housing A+; Watch: schools D, amenities D, employment D.
- Fitzgerald Public Schools (urban): math 8% / reading 23% proficiency, ranked #503 of 540 in MI (top 93%) — low school quality limits family demand, transient renter base, plan for 1-2y turnover; 77% free/reduced lunch — lower-income household profile, screen leases tightly.
- Market conditions: Rents rising (+2.4%/yr); 168 active listings in the ZIP; 26 comparable units currently listed for rent nearby; rentals at typical pace (median 24d on market — plan ~3-4 weeks tenant-placement turnaround); 1,321 units permitted in Macomb County in 2024 (86 in 5+ unit buildings).
- This rent runs 31% of the median local income ($54k/yr) — at the standard rent-burdened threshold; future hikes will face affordability resistance.
Forward outlook
- Local home prices are declining (-3.0%/yr); year-one equity from $892 of loan paydown is wiped out by about $4k of value loss. Plan a longer hold.
- Macomb County population projected at +9% by 2050 — modest demand growth; plan on rents tracking national, not racing it.
Negotiation context
- Only 1 days on market — expect competitive offers; lowballing is unlikely to land.
- 4 sale attempts since 27y ago with the ask held roughly flat each time — persistent listings suggest the price (not the market) is what's stuck; bring a comps-based counter.
- Current owner paid $10k; list at $129k implies a 1216% gain — meaningful room to come down on a strong offer.
Risks & watch-outs
- Watch-outs: flood insurance adds $66/mo; built in 1940 — expect roof / HVAC / electrical / plumbing capex.
- Climate carrying-cost: severe flood risk — expect insurance premiums to compound above CPI over the hold.
Questions for the listing agent
- Built in 1940 — when were the roof, HVAC, electrical panel, plumbing, and water heater last replaced?
- What's the actual annual flood-insurance premium (NFIP or private), and is the property in a SFHA with mandatory coverage?
- Is there a deadline driving the sale (1031 exchange, divorce, estate, relocation)? That informs how much negotiation room exists.
- Schools are D-rated, which usually means shorter tenancies and higher turnover. Who's the typical renter profile here, and what's been the actual vacancy rate?
- Crime grade is D in this area — have there been break-ins, vandalism, or insurance claims at this property in the last 3 years? What carrier currently insures it and at what premium?
- What's the average days-on-market for RENTAL listings here right now (not sales)? A rising rental-DOM trend means longer vacancies and softer asking-rent achievability than the comps imply.
- What's the recent tenant-quality profile in this submarket — average credit score on applications, eviction rate, late-payment / NSF rate, and stable-employment percentage? A property-management company in the area should have these aggregated.
- How much new for-sale + rental construction is in the pipeline within 1–3 miles? Heavy new supply typically softens prices + rents 12–24 months out; constrained supply supports both.
Investment metrics
- 1% rule
- 1.07% ✓
- Cap rate
- 8.63%
- Cash-on-cash
- 8.34%
- DSCR
- 1.37
- GRM
- 7.8
CMA / ARV
- ARV (on-the-fly)
- $133,560
- Comps found
- 12
Show comp detail 12 sales within ~0.75 mi
| Address | Dist | Beds/Ba | Sqft | Sold | Price | $/sf | Match |
|---|---|---|---|---|---|---|---|
| 3590 Dallas Ave | 0.19mi | 2/1.0 | 766 (-9%) | 5mo | $41,000 | $54 | 72 |
| 22369 Cunningham Ave | 0.38mi | 3/1.0 (+1) | 900 (+7%) | 1mo | $150,000 | $167 | 65 |
| 3342 Bart St | 0.46mi | 2/1.0 | 942 (+12%) | 1mo | $95,000 | $101 | 57 |
| 23532 Eureka Ave | 0.47mi | 2/1.0 | 768 (-9%) | 10mo | $157,500 | $205 | 56 |
| 22595 Curie Ave | 0.73mi | 2/1.0 | 887 (+6%) | 4mo | $40,000 | $45 | 54 |
| 23241 Hill Ave | 0.73mi | 2/1.0 | 912 (+9%) | 1mo | $145,000 | $159 | 50 |
| 23220 Audrey Ave | 0.68mi | 2/1.0 | 952 (+13%) | 1mo | $169,900 | $178 | 45 |
| 23906 Ada Ave | 0.72mi | 3/1.5 (+1) | 894 (+6%) | 4mo | $130,000 | $145 | 45 |
| 4259 Stephens Rd | 0.65mi | 2/1.0 | 950 (+13%) | 13mo | $128,800 | $136 | 37 |
| 21844 Hill St | 0.75mi | 3/1.0 (+1) | 939 (+12%) | 8mo | $190,000 | $202 | 34 |
| 22006 Hill St | 0.73mi | 3/1.0 (+1) | 939 (+12%) | 9mo | $200,000 | $213 | 34 |
| 2465 Waltz Ave | 0.65mi | 3/1.0 (+1) | 943 (+12%) | 14mo | $138,500 | $147 | 33 |
Match score weights: distance 35% · size 25% · config 20% · recency 20%. Top-matched comps best support the ARV.
Projected returns pro-forma
-3.0% appreciation · 2.35% rent growth · sell at horizon
- IRR
- -7.6%
- Equity multiple
- 0.72×
- Total profit
- $-10,022
- Equity at exit
- $19,234
- IRR
- 1.2%
- Equity multiple
- 1.08×
- Total profit
- $2,890
- Equity at exit
- $11,154
Cash invested: $36,120 (down + closing). Projections, not guarantees.
Landlord ↔ Tenant lean methodology
- Overall (STATE)
- 62 Landlord-Friendly
- State Michigan
- 62 Landlord-Friendly · EVEN
- County
- — inherits STATE
- City
- — inherits STATE
ZIP-level market 48091
- Rents YoY
- 2.4%
- Active inventory
- 168
- Price-to-rent
- 7.8×
Monthly cashflow live
- Estimated rent
- $1,381 high interval (Pro) →
- Mortgage (P&I)
- −$676
- Tax from tax record
- −$109 /mo · $1,314/yr
- Insurance
- −$54
- Flood insurance flood zone
- −$66 /mo · $798/yr
- HOA
- −$0
- Vacancy / Maint / Mgmt
- −$290
- Net cashflow
- $184
Break-even live
UW: 25.0% down · 7.5% · 30yr · 1.5% tax · 5.0% vac · 8.0% maint · 8.0% mgmt
Financing live
Cash to close
- Down payment
- $32,250
- Closing costs
- $3,870
- Reserves months
- —
- Total cash needed
- —
Loan-product check · same deal, 3 products live
Conventional
25% down · 7.5% · 30yr
- Down + closing
- —
- Monthly P&I
- —
- Monthly cashflow
- —
- DSCR
- —
- Eligible?
- —
Personal DTI + credit; lowest rate.
DSCR
20% down · 8.5% · 30yr
- Down + closing
- —
- Monthly P&I
- —
- Monthly cashflow
- —
- DSCR
- —
- Eligible?
- —
No personal income docs; deal must DSCR.
Hard money
10% down · 12.0% · 12mo
- Down + closing
- —
- Monthly P&I
- —
- Monthly cashflow
- —
- DSCR
- —
- Eligible?
- —
Short-term bridge; refi at stabilization.
Rent comps 26 comps
| Address | Beds | Baths | Sqft | Rent | $/sqft | DOM | Units | Dist |
|---|---|---|---|---|---|---|---|---|
| 3840 Bart Ave Warren, MI | 3.0 | 1.0 | 1062 | $1,350 | $1.27 | 24d | 1 | 0.34mi |
| 22580 Masch Ave Warren, MI | 3.0 | 1.0 | 988 | $1,450 | $1.47 | 24d | 1 | 0.49mi |
| 3974 Berkshire Ave Warren, MI | 1.0 | 1.0 | 900 | $1,500 | $1.67 | 2d | 1 | 0.61mi |
| 2709 Capitol Ave Warren, MI | 3.0 | 2.0 | 1056 | $1,649 | $1.56 | 43d | 1 | 0.61mi |
| 21155 Warner Ave Warren, MI | 2.0 | 1.0 | 756 | $1,029 | $1.36 | 24d | 1 | 0.88mi |
| 22622 Panama Ave Warren, MI | 3.0 | 1.5 | 920 | $1,395 | $1.52 | 10d | 1 | 0.88mi |
| 21516 Dequindre Rd Warren, MI | 1.0–2.0 | 1.0 | 837 | $1,375 | $1.64 | 21d | 1 | 0.99mi |
| 20794 Audrey Ave Warren, MI | 3.0 | 1.0 | 954 | $1,350 | $1.42 | 43d | 1 | 1.04mi |
| 1731 E Pearl Ave Hazel Park, MI | 3.0 | 1.0 | 844 | $1,500 | $1.78 | 20d | 1 | 1.04mi |
| 21410 Panama St Warren, MI | 3.0 | 1.0 | 900 | $1,600 | $1.78 | 24d | 1 | 1.05mi |
| 23077 Davey Ave Hazel Park, MI | 3.0 | 1.0 | 933 | $1,895 | $2.03 | 24d | 1 | 1.06mi |
| 21465 Syracuse Ave Warren, MI | 3.0 | 1.0 | 990 | $1,375 | $1.39 | 43d | 1 | 1.10mi |
| 4652 E 10 Mile Rd Warren, MI | 2.0 | 1.0 | 950 | $1,200 | $1.26 | 43d | 1 | 1.13mi |
| 1770 E Woodward Heights Blvd Unit E3 Hazel Park, MI | 2.0 | 1.0 | 850 | $1,300 | $1.53 | 24d | 1 | 1.15mi |
| 1770 E Woodward Heights Blvd Hazel Park, MI | 1.0–2.0 | 1.0 | 712 | $1,400 | $1.96 | 5d | 1 | 1.15mi |
| 1770 E Woodward Heights Blvd Unit C1 Hazel Park, MI | 1.0 | 1.0 | 550 | $1,350 | $2.45 | 24d | 1 | 1.15mi |
| 1770 E Woodward Heights Blvd Hazel Park, MI | 2.0 | 1.0 | 850 | $1,525 | $1.79 | 12d | 1 | 1.15mi |
| 1770 E Woodward Heights Blvd Unit C6 Hazel Park, MI | 1.0 | 1.0 | 550 | $1,100 | $2.00 | 24d | 1 | 1.15mi |
| 2034 John B Ave Warren, MI | 3.0 | 1.0 | 920 | $1,261 | $1.37 | 43d | 1 | 1.15mi |
| 1771 E Woodward Heights Blvd #8 Hazel Park, MI | 1.0 | 1.0 | 800 | $990 | $1.24 | 3d | 1 | 1.17mi |
| 20255 Harned St Detroit, MI | 3.0 | 1.0 | 1000 | $1,374 | $1.37 | 16d | 1 | 1.20mi |
| 1621 E Evelyn Ave Hazel Park, MI | 2.0 | 1.0 | 749 | $1,295 | $1.73 | 18d | 1 | 1.20mi |
| 19930 Binder St Detroit, MI | 3.0 | 1.0 | 1000 | $1,450 | $1.45 | 16d | 1 | 1.38mi |
| 1326 E Evelyn Ave Unit 1032332P Hazel Park, MI | 3.0 | 2.0 | 1097 | $6,448 | $5.88 | 1d | 1 | 1.39mi |
| 20263 Caldwell St Detroit, MI | 3.0 | 1.0 | 909 | $1,350 | $1.49 | 16d | 1 | 1.43mi |
| 1211 E Bernhard Ave Hazel Park, MI | 2.0 | 1.0 | 721 | $1,500 | $2.08 | 24d | 1 | 1.49mi |
Listing history 3 events
-
2026-06-19remarks 699-char remark
-
2026-06-18remarks 607-char remark
-
2026-06-18$129,000 Active 1 DOM
ⓘ Source: listings_history table (triggers on properties + properties_extension) + one-shot
backfill from property_details.listing_events for pre-trigger history.
Tax reassessment forecast MI · Partial reset (capped growth)
- Current annual tax
- $1,314 · $109/mo
- Projected year-2 tax
- $1,650 · $138/mo
- Expected delta
- +$336/yr (+$28/mo · 25.6%)
ⓘ Screening estimate from a state-policy table — verify with the county assessor before closing.
Climate risk First Street
- Flood 9/10 Extreme FEMA zone X (unshaded) · 99% chance over 30 yrs
- Wildfire 1/10 Low
- Heat 3/10 Moderate 7 d/yr ≥97°F today · 15 d/yr by 30 yrs out
- Wind 1/10 Low
- Air quality 3/10 Moderate 3 unhealthy d/yr today · 5 by 30 yrs out
Nearby sold comps map
Loading sold comps map…
Walkable amenities ~0.75 mi
Loading nearby amenities…
Taxation est. · year 1
- Rental income
- $16,567
- − Mortgage interest
- −$7,226
- − Property taxes
- −$1,314
- − Insurance
- −$1,442
- − Repairs & maintenance
- −$1,325
- − Management
- −$1,325
- − Depreciation
- −$3,753
- Taxable income
- $181
- Est. tax owed @ 24.0%
- −$43
- After-tax cash flow
- $2,170/yr
For passive investors: Depreciation is non-cash, so a rental often shows a tax loss while cash-flowing — sheltering income. Rental losses are passive: they offset passive income freely, and up to $25,000/yr can offset ordinary (W-2) income if you actively participate and your MAGI is under $100k (phasing out to $0 by $150k); unused losses carry forward. On sale, claimed depreciation is recaptured at up to 25%, and gains may owe capital-gains tax (a 1031 exchange can defer both). Figures are a year-1 estimate at your 24.0% rate — not tax advice; consult a CPA.
Schools (NCES district)
- District
- Fitzgerald Public Schools
- NCES district ID
- 2614460
- Math proficiency
- 8% ▼ -8.00%
- Reading proficiency
- 23% ▼ -11.00%
- Median HH income
- $34,828
- Composite
- 12.67/100
- National rank
- #9608
- State rank
- #503 of 540 in MI
Livability — Warren
- Score
- 74/100
- State rank
- #171
- US rank
- #4491
Category grades
Schools grade is shown separately in the Schools card above.
Census & demographics
- Census place
- Warren, MI
- County
- Macomb County · 638,552 people
- City population
- 114,937
- Metro
- Detroit-Warren-Dearborn, MI
- Population (ZIP)
- 30,696
- Household income
- $54,230
- Rent vs Own
- Severe rent burden
- 1296.0
Population outlook (Macomb County) Hauer SSP2
- Today (2025)
- 925,296 people
- By 2030
- 948,226 · +2.5%
- By 2040
- 983,961 · +6.3%
- By 2050
- 1,010,200 · +9.2%
- By 2075
- 1,076,222 · +16.3%
- By 2100
- 1,077,065 · +16.4%
Race, ethnicity, and origin ACS 2023
- Neighborhood character
- Diverse neighborhood (Simpson 0.68)
- Race & ethnicity
- White 47% Black 25% Asian 19% Two or more races 5% Hispanic / Latino 3% Native American 2%
- Common ancestry
- Romanian 7% Lithuanian 2% Slovak 1%
- Foreign-born
- 16% · Canada
- Languages at home
- 77% English-only · Other Indo-European 14% Other Asian/Pacific 3% Russian/Polish/Slavic 2%
Political lean MEDSL · Macomb
- 2024 margin
- R (+13.7) · D 42.2% · R 55.9% · Other 1.9%
- 2008→2024 swing
- -22.3pp toward R · 2008: 8.6pp · 2024: -13.7pp
- All cycles
- 2024: R+13.7 2020: R+8.1 2016: R+11.6 2012: D+4.0 2008: D+8.6
Not yet ingested
- Civics
- —
Market trends
- HPI YoY
- ▼ -199.66%
- Current HPI
- 177.9273
- Rent YoY
- ▲ 2.35%
- Metro
- Detroit-Warren-Dearborn, MI
- State GDP YoY
- ▲ 1.37%
- F500 in state
- 28
Industry mix (Fortune 500 HQ in MI)
| Industry | F500 HQs | Revenue |
|---|---|---|
| Automotive Parts | 3 | $48B |
|
||
| Automotive | 2 | $372B |
|
||
| Chemicals | 1 | $45B |
|
||
| Automotive Retail | 1 | $29B |
|
||
| Healthcare / Medical Devices | 1 | $23B |
|
||
| Automotive Technology | 1 | $20B |
|
||
Price history
+61.5% since first listed8 events — show timeline
- 2026-06-17 Listed $129,000 REALCOMP
- 2026-06-17 Listed $129,000 MiRealSource-MiMLS
- 2010-09-13 Sold (MLS) $9,801 REALCOMP
- 2010-08-23 Listed $9,801 REALCOMP
- 1999-07-14 Sold (Public Records) $75,000 Public Records
- 1999-06-01 Sold (MLS) $75,000 MiRealSource-MiMLS
- 1999-04-21 Listing Removed — MiRealSource-MiMLS
- 1999-02-10 Listed $79,900 MiRealSource-MiMLS
Property tax history
+2.6%/yrLatest (2025): $1,314 · +2.5% YoY. Source: county tax records.
Cash-flow waterfall
monthlySold comps — $/sqft
last 12 mo · ≤1 miLoading sold comps…