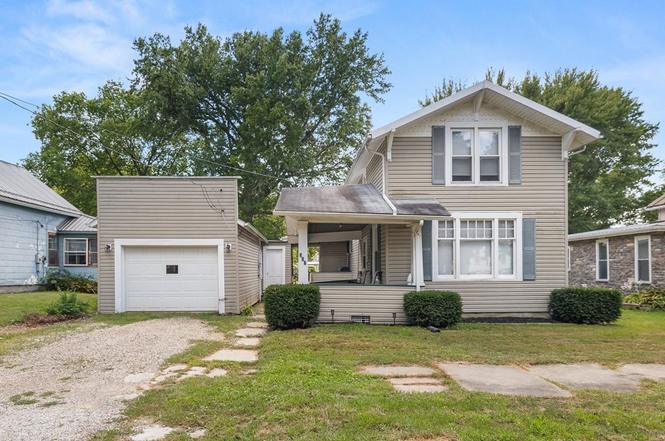
337 Grove Ave · Galion, OH
Flood risk 4/10 · Minor
- FEMA flood zone
- X (unshaded)
- Chance of flooding over 30 yrs
- 0.22%
- Est. flood insurance / yr
- $473 – $860
Fire risk 1/10 · Minimal
- Est. fire insurance / yr
- $713 – $1,323
Heat risk 3/10 · Minor
- Hot days now (above 98°F)
- 7 days/yr
- Hot days in 30 yrs
- 17 days/yr
Wind risk 2/10 · Minimal
- Chance of severe wind over 30 yrs
- —
Air-quality risk 2/10 · Minimal
- Unhealthy air days now
- 1 days/yr
- Unhealthy air days in 30 yrs
- 1 days/yr
Risk factors via First Street. Map © Google.
Why this score? — see what drove the F grade
The composite is a weighted blend of 9 inputs, each scored 0–100. Each bar is that input's sub-score; the figure is the points it added to the 100-point composite (weight × sub-score).
- Cash flow +8.1/30.0
- ARV discount +6.7/15.0
- Schools +3.8/10.0
- Livability +3.2/5.0
- Rent growth +2.5/5.0
- Condition / age +2.5/5.0
- DSCR +2.2/10.0
- 1% rule +2.0/10.0
- Appreciation +0.0/10.0
$120,000
🖨 Deal sheet 📄 Offer letter ✓ Due diligence
Listing remarks MLS
This welcoming home has had the same owner for 50 years. There's not just one porch to relax on and enjoy the beautiful yard and landscaping, but two! The extra large lot used to have a garden. The inside has the original dark woodwork, open stairway, and abundant kitchen cabinets. Don't miss out - schedule your showing today!
Key facts
- Shed
- New flooring
- Large lot
Tags
Neighborhood map
What this means for you Summary
Snapshot
- This is a 2-bed/1.0-bath single-family listed at $120k.
Deal economics
- At list price, monthly cash flow is $-116 ($-1k/yr) — negative.
- To cash-flow at today's rent, offer at most $100k (17.1% below list).
- To meet the 1% rule (rent ≥ 1% of price), the offer needs to be $84k (29.6% below list).
- Recommended offer: $84k (29.6% below list) — sets the bar for 1% rule.
Location & tenants
- Location reads 63/100 on livability (#833 in OH) — a middle-class / working-renter tenant base. Strengths: cost of living A+, housing A+, crime A-; Watch: schools C-, amenities F, commute F.
- Galion City (town): math 36% / reading 56% proficiency, ranked #499 of 656 in OH (top 76%) — families likely to look elsewhere, expect single-tenant / working-renter base with shorter leases.
- Market conditions: 76 active listings in the ZIP; 1 comparable units currently listed for rent nearby; 8 units permitted in Crawford County in 2024 (0 in 5+ unit buildings).
- This rent is only 18% of the median local income ($57k/yr) — well below the 30% rent-burden line; pricing power to push rent on renewal without tenant pushback.
Forward outlook
- Local home prices are declining (-3.0%/yr); year-one equity from $830 of loan paydown is wiped out by about $4k of value loss. Plan a longer hold.
- Crawford County population projected at -22% by 2050 — secular population decline; favor cash flow + early exit over multi-decade hold.
Negotiation context
- It's been on market 122 days — a 12% lower offer ($106k) is reasonable based on typical stale-listing flexibility.
- 3 sale attempts since 3y ago with the ask held roughly flat each time — persistent listings suggest the price (not the market) is what's stuck; bring a comps-based counter.
Risks & watch-outs
- Watch-outs: built in 1910 — expect roof / HVAC / electrical / plumbing capex.
Questions for the listing agent
- What do current leases actually rent for vs. the listed asking? Can we see a recent rent roll and the last 12 months of T-12 income?
- It's been on market 122 days. Have you received any prior offers? Is the seller open to a 30% concession, seller financing, or rate buy-down credit?
- Built in 1910 — when were the roof, HVAC, electrical panel, plumbing, and water heater last replaced?
- Why hasn't it sold? Are there any deal-killer items the seller is aware of (foundation, flood, title, zoning, code violations)?
- Is there a deadline driving the sale (1031 exchange, divorce, estate, relocation)? That informs how much negotiation room exists.
- The area grade is low — what's the realistic commute time and amenity access for the typical tenant pool here? Any planned neighborhood developments (good or bad) we should know about?
- What's the average days-on-market for RENTAL listings here right now (not sales)? A rising rental-DOM trend means longer vacancies and softer asking-rent achievability than the comps imply.
- What's the recent tenant-quality profile in this submarket — average credit score on applications, eviction rate, late-payment / NSF rate, and stable-employment percentage? A property-management company in the area should have these aggregated.
- How much new for-sale + rental construction is in the pipeline within 1–3 miles? Heavy new supply typically softens prices + rents 12–24 months out; constrained supply supports both.
Investment metrics
- 1% rule
- 0.70% ✗
- Cap rate
- 5.13%
- Cash-on-cash
- -4.14%
- DSCR
- 0.82
- GRM
- 11.8
CMA / ARV
- ARV (on-the-fly)
- $118,026
- Comps found
- 12
Show comp detail 12 sales within ~0.75 mi
| Address | Dist | Beds/Ba | Sqft | Sold | Price | $/sf | Match |
|---|---|---|---|---|---|---|---|
| 337 Grove Ave | 0.00mi | 3/1.0 (+1) | 1,494 (0%) | 0mo | $118,000 | $79 | 95 |
| 341 Grove Ave | 0.01mi | 3/1.5 (+1) | 1,536 (+3%) | 7mo | $67,500 | $44 | 82 |
| 322 Cherry St | 0.19mi | 2/1.0 | 1,606 (+8%) | 6mo | $138,500 | $86 | 73 |
| 216 Orange St | 0.21mi | 3/2.0 (+1) | 1,586 (+6%) | 2mo | $140,000 | $88 | 69 |
| 638 S Boston St | 0.32mi | 3/2.0 (+1) | 1,560 (+4%) | 1mo | $196,900 | $126 | 68 |
| 316 Cherry St | 0.19mi | 3/1.5 (+1) | 1,572 (+5%) | 10mo | $145,000 | $92 | 67 |
| 281 N Union St | 0.57mi | 3/1.0 (+1) | 1,536 (+3%) | 2mo | $105,000 | $68 | 63 |
| 424 John St | 0.39mi | 2/1.0 | 1,294 (-13%) | 4mo | $20,690 | $16 | 56 |
| 240 Clymer Ave | 0.35mi | 3/2.0 (+1) | 1,668 (+12%) | 1mo | $225,000 | $135 | 54 |
| 239 South St | 0.59mi | 3/1.0 (+1) | 1,586 (+6%) | 4mo | $60,000 | $38 | 54 |
| 315 E Atwood St | 0.48mi | 3/1.0 (+1) | 1,650 (+10%) | 2mo | $26,000 | $16 | 53 |
| 226 S Pierce St | 0.66mi | 3/1.0 (+1) | 1,320 (-12%) | 1mo | $47,500 | $36 | 44 |
Match score weights: distance 35% · size 25% · config 20% · recency 20%. Top-matched comps best support the ARV.
Projected returns pro-forma
-3.0% appreciation · 3.0% rent growth · sell at horizon
- IRR
- -23.3%
- Equity multiple
- 0.20×
- Total profit
- $-26,840
- Equity at exit
- $17,892
- IRR
- -18.0%
- Equity multiple
- 0.02×
- Total profit
- $-32,938
- Equity at exit
- $10,375
Cash invested: $33,600 (down + closing). Projections, not guarantees.
Landlord ↔ Tenant lean methodology
- Overall (STATE)
- 73 Landlord-Friendly
- State Ohio
- 73 Landlord-Friendly · R+6
- County
- — inherits STATE
- City
- — inherits STATE
ZIP-level market 44833
- Home prices YoY
- -27.9%
- Active inventory
- 76
- Price-to-rent
- 11.8×
Monthly cashflow live
- Estimated rent
- $845 medium interval (Pro) →
- Mortgage (P&I)
- −$629
- Tax from tax record
- −$104 /mo · $1,250/yr
- Insurance
- −$50
- HOA
- −$0
- Vacancy / Maint / Mgmt
- −$177
- Net cashflow
- $-116
Break-even live
UW: 25.0% down · 7.5% · 30yr · 1.5% tax · 5.0% vac · 8.0% maint · 8.0% mgmt
Financing live
Cash to close
- Down payment
- $30,000
- Closing costs
- $3,600
- Reserves months
- —
- Total cash needed
- —
Loan-product check · same deal, 3 products live
Conventional
25% down · 7.5% · 30yr
- Down + closing
- —
- Monthly P&I
- —
- Monthly cashflow
- —
- DSCR
- —
- Eligible?
- —
Personal DTI + credit; lowest rate.
DSCR
20% down · 8.5% · 30yr
- Down + closing
- —
- Monthly P&I
- —
- Monthly cashflow
- —
- DSCR
- —
- Eligible?
- —
No personal income docs; deal must DSCR.
Hard money
10% down · 12.0% · 12mo
- Down + closing
- —
- Monthly P&I
- —
- Monthly cashflow
- —
- DSCR
- —
- Eligible?
- —
Short-term bridge; refi at stabilization.
Rent comps 1 comps
| Address | Beds | Baths | Sqft | Rent | $/sqft | DOM | Units | Dist |
|---|---|---|---|---|---|---|---|---|
| 1140 N Market St Galion, OH | 1.0 | 1.0 | 912 | $845 | $0.93 | 43d | 1 | 1.34mi |
Listing history 9 events
-
2026-02-27status Pending
-
2025-12-30status Active
-
2025-12-23status Pending
-
2025-11-03price $120,000
-
2025-08-23$125,000 Active
-
2023-09-13soldstatus $111,000
-
2023-09-12soldstatus $111,000 Closed 328-char remark
Show marketing remark (328 chars)
This welcoming home has had the same owner for 50 years. There's not just one porch to relax on and enjoy the beautiful yard and landscaping, but two! The extra large lot used to have a garden. The inside has the original dark woodwork, open stairway, and abundant kitchen cabinets. Don't miss out - schedule your showing today!
-
2023-08-16status Pending 328-char remark
Show marketing remark (328 chars)
This welcoming home has had the same owner for 50 years. There's not just one porch to relax on and enjoy the beautiful yard and landscaping, but two! The extra large lot used to have a garden. The inside has the original dark woodwork, open stairway, and abundant kitchen cabinets. Don't miss out - schedule your showing today!
-
2023-08-09$102,000 Active 328-char remark
Show marketing remark (328 chars)
This welcoming home has had the same owner for 50 years. There's not just one porch to relax on and enjoy the beautiful yard and landscaping, but two! The extra large lot used to have a garden. The inside has the original dark woodwork, open stairway, and abundant kitchen cabinets. Don't miss out - schedule your showing today!
ⓘ Source: listings_history table (triggers on properties + properties_extension) + one-shot
backfill from property_details.listing_events for pre-trigger history.
Tax reassessment forecast OH · Partial reset (capped growth)
- Current annual tax
- $1,250 · $104/mo
- Projected year-2 tax
- $1,561 · $130/mo
- Expected delta
- +$311/yr (+$26/mo · 24.9%)
ⓘ Screening estimate from a state-policy table — verify with the county assessor before closing.
Climate risk First Street
- Flood 4/10 Moderate FEMA zone X (unshaded) · 22% chance over 30 yrs
- Wildfire 1/10 Low
- Heat 3/10 Moderate 7 d/yr ≥98°F today · 17 d/yr by 30 yrs out
- Wind 2/10 Low
- Air quality 2/10 Low 1 unhealthy d/yr today · 1 by 30 yrs out
Nearby sold comps map
Loading sold comps map…
Walkable amenities ~0.75 mi
Loading nearby amenities…
Taxation est. · year 1
- Rental income
- $10,140
- − Mortgage interest
- −$6,722
- − Property taxes
- −$1,250
- − Insurance
- −$600
- − Repairs & maintenance
- −$811
- − Management
- −$811
- − Depreciation
- −$3,491
- Taxable loss
- −$3,545
- Est. tax savings @ 24.0%
- +$851
- After-tax cash flow
- $-540/yr
For passive investors: Depreciation is non-cash, so a rental often shows a tax loss while cash-flowing — sheltering income. Rental losses are passive: they offset passive income freely, and up to $25,000/yr can offset ordinary (W-2) income if you actively participate and your MAGI is under $100k (phasing out to $0 by $150k); unused losses carry forward. On sale, claimed depreciation is recaptured at up to 25%, and gains may owe capital-gains tax (a 1031 exchange can defer both). Figures are a year-1 estimate at your 24.0% rate — not tax advice; consult a CPA.
Schools (NCES district)
- District
- Galion City
- NCES district ID
- 3904402
- Math proficiency
- 36% ▼ -12.00%
- Reading proficiency
- 56% ▬ 0.00%
- Median HH income
- $36,331
- Composite
- 38.08/100
- National rank
- #4279
- State rank
- #499 of 656 in OH
Livability — Galion
- Score
- 63/100
- State rank
- #833
- US rank
- #15587
Category grades
Schools grade is shown separately in the Schools card above.
Census & demographics
- Census place
- Galion, OH
- County
- Morrow · 41,908 people
- City population
- 16,641
- Metro
- Columbus, OH
- Population (ZIP)
- 16,641
- Household income
- $57,234
- Rent vs Own
- Severe rent burden
- 3.8
Population outlook (Crawford County) Hauer SSP2
- Today (2025)
- 39,421 people
- By 2030
- 37,656 · -4.5%
- By 2040
- 34,043 · -13.6%
- By 2050
- 30,617 · -22.3%
- By 2075
- 23,652 · -40.0%
- By 2100
- 17,786 · -54.9%
Race, ethnicity, and origin ACS 2023
- Neighborhood character
- Predominantly White (96%)
- Race & ethnicity
- White 96% Two or more races 2% Hispanic / Latino 2%
- Common ancestry
- Slovak 2% Romanian 2% Lithuanian 2%
- Foreign-born
- 1% · Canada
- Languages at home
- 98% English-only · Spanish 1% German/W. Germanic 1%
Political lean MEDSL · Crawford
- 2024 margin
- Solid R (+53.0) · D 23.1% · R 76.1%
- 2008→2024 swing
- -33.9pp toward R · 2008: -19.0pp · 2024: -53.0pp
- All cycles
- 2024: R+53.0 2020: R+50.9 2016: R+46.8 2012: R+22.7 2008: R+19.0
Not yet ingested
- Civics
- —
Market trends
- HPI YoY
- ▼ -84.57%
- Current HPI
- 218.195
- Rent YoY
- —
- Metro
- —
- State GDP YoY
- ▲ 1.98%
- F500 in state
- 48
Industry mix (Fortune 500 HQ in OH)
| Industry | F500 HQs | Revenue |
|---|---|---|
| Insurance | 3 | $145B |
|
||
| Industrial Machinery | 3 | $49B |
|
||
| Financial Services | 3 | $24B |
|
||
| Consumer Goods | 2 | $93B |
|
||
| Aerospace / Defense | 2 | $47B |
|
||
| Utilities | 2 | $33B |
|
||
Price history
+17.6% since first listed9 events — show timeline
- 2026-02-27 Pending — MARMLS
- 2025-12-30 Relisted — MARMLS
- 2025-12-23 Pending — MARMLS
- 2025-11-03 Price Changed $120,000 MARMLS
- 2025-08-23 Listed $125,000 MARMLS
- 2023-09-13 Sold (Public Records) $111,000 Public Records
- 2023-09-12 Sold (MLS) $111,000 MARMLS
- 2023-08-16 Pending — MARMLS
- 2023-08-09 Listed $102,000 MARMLS
Property tax history
+2.9%/yrLatest (2025): $1,250 · -0.3% YoY. Source: county tax records.
Cash-flow waterfall
monthlySold comps — $/sqft
last 12 mo · ≤1 miLoading sold comps…