 Multi-family
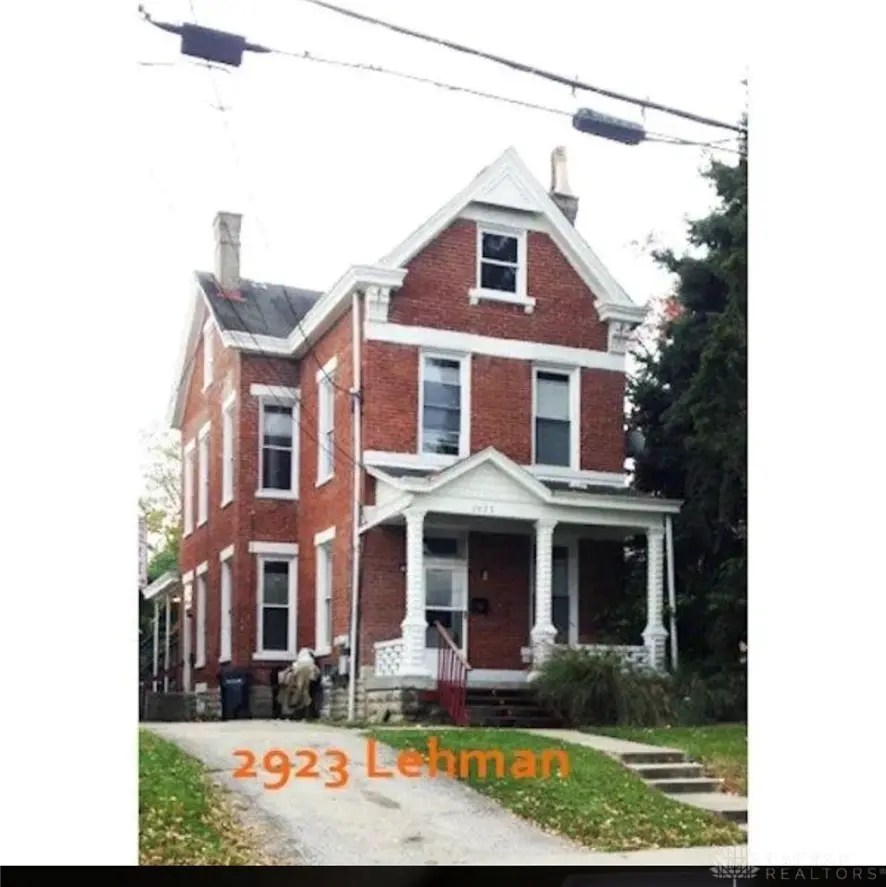
2923 Lehman Rd · Cincinnati, OH
Flood risk 1/10 · Minimal
- FEMA flood zone
- X (unshaded)
- Chance of flooding over 30 yrs
- 0.0%
- Est. flood insurance / yr
- $473 – $860
Fire risk 1/10 · Minimal
- Est. fire insurance / yr
- $713 – $1,323
Heat risk 3/10 · Minor
- Hot days now (above 103°F)
- 6 days/yr
- Hot days in 30 yrs
- 16 days/yr
Wind risk 2/10 · Minimal
- Chance of severe wind over 30 yrs
- 1.0%
Air-quality risk 3/10 · Minor
- Unhealthy air days now
- 3 days/yr
- Unhealthy air days in 30 yrs
- 5 days/yr
Risk factors via First Street. Map © Google.
Why this score? — see what drove the B grade
The composite is a weighted blend of 9 inputs, each scored 0–100. Each bar is that input's sub-score; the figure is the points it added to the 100-point composite (weight × sub-score).
- Cash flow +29.1/30.0
- ARV discount +15.0/15.0
- DSCR +10.0/10.0
- 1% rule +7.9/10.0
- Livability +4.0/5.0
- Rent growth +2.5/5.0
- Schools +2.5/10.0
- Condition / age +2.5/5.0
- Appreciation +0.0/10.0
$195,000
🖨 Deal sheet 📄 Offer letter ✓ Due diligence
Multi-family units
County records classify this as Multi-Family (2-4 Unit). Listing-text estimate: 1 unit. estimate disagrees with records
Listing remarks MLS
Fantastic Investment Opportunity near the Incline District! Fully occupied brick duplex in East Price Hill. Excellent rental history. Tenants pay gas and electric and heat. Current rents below market. 3 bedroom $755; 1 bedroom $650. Newer water heaters and furnaces. Replaced the sewer line from house to street tie in in 2018. Professional management already in place and can continue with new owner if desired. Sold As Is. Proof of Funds required with offer.
Key facts
- Two-story property
- Distinct units
- Thoughtful layout
Tags
Property features AI
Finance
- Financial info: Offered for sale
Exterior
- Parking: No garage
- Home design: Two-story building
- Construction: Brick construction
- Exterior features: Residential zoning; Lot approximately 0.12 acres (assessor)
Interior
- Bedrooms: Multi-unit property with units of four bedrooms or more; Two total units
- Bathrooms: Two full bathrooms (total)
- Heating & cooling: Forced air heating; Heating present
- Interior features: Partially finished basement; Basement present
Neighborhood map
What this means for you Summary
Snapshot
- This is a 5-bed/2.0-bath multifamily listed at $195k.
Deal economics
- At list price, monthly cash flow is $675 ($8k/yr) — positive.
- The deal already cash-flows at list — no discount required.
- Meets the 1% rule at list price ($3k rent vs $195k).
- Recommended offer: $189k (3.0% below list) — sets the bar for market timing.
- Cap rate 10.4% vs local median 3.9% in Cincinnati — top-decile yield for the area; either an underpriced asset or a hidden risk that comps aren't pricing in. Stress-test before assuming the spread holds.
Location & tenants
- Location reads 80/100 on livability (#130 in OH, #1,856 nationally) — a professional / high-income tenant draw. Strengths: amenities A+, commute A+, cost of living A+; Watch: employment D, crime F.
- Cincinnati Public Schools (urban): math 25% / reading 36% proficiency, ranked #581 of 656 in OH (top 89%) — families likely to look elsewhere, expect single-tenant / working-renter base with shorter leases; 70% free/reduced lunch — lower-income household profile, screen leases tightly.
- Market conditions: 33 active listings in the ZIP; 6 comparable units currently listed for rent nearby; rentals at typical pace (median 20d on market — plan ~3-4 weeks tenant-placement turnaround); lower-income renter base — watch delinquency; 801 units permitted in Hamilton County in 2024 (190 in 5+ unit buildings).
- At $2,522/mo this rent would consume 97% of the median local household income ($31k/yr) (locally 487% of renters already pay >50% of income on rent) — very limited rent-growth headroom before tenants either downsize or default.
Forward outlook
- Local home prices are declining (-3.0%/yr); year-one equity from $1k of loan paydown is wiped out by about $6k of value loss. Plan a longer hold.
- At projected returns (-3.0% appreciation + 3.0% rent growth), your $55k cash investment doubles in ~8 years — after that, you're playing with house money.
Negotiation context
- It's been on market 53 days — a 3% lower offer ($189k) is reasonable based on typical stale-listing flexibility.
- 6 sale attempts since 23y ago with the ask held roughly flat each time — persistent listings suggest the price (not the market) is what's stuck; bring a comps-based counter.
- Current owner paid $115k; list at $195k implies a 70% gain — meaningful room to come down on a strong offer.
Risks & watch-outs
- Watch-outs: built in 1890 — expect roof / HVAC / electrical / plumbing capex.
Questions for the listing agent
- It's been on market 53 days. Have you received any prior offers? Is the seller open to a 3% concession, seller financing, or rate buy-down credit?
- Built in 1890 — when were the roof, HVAC, electrical panel, plumbing, and water heater last replaced?
- Is there a deadline driving the sale (1031 exchange, divorce, estate, relocation)? That informs how much negotiation room exists.
- Schools are B-rated — typically a magnet for longer-tenancy family renters. What's the average tenant stay here, and is there a school-zone premium baked into asking?
- Crime grade is F in this area — have there been break-ins, vandalism, or insurance claims at this property in the last 3 years? What carrier currently insures it and at what premium?
- What's the average days-on-market for RENTAL listings here right now (not sales)? A rising rental-DOM trend means longer vacancies and softer asking-rent achievability than the comps imply.
- What's the recent tenant-quality profile in this submarket — average credit score on applications, eviction rate, late-payment / NSF rate, and stable-employment percentage? A property-management company in the area should have these aggregated.
- How much new apartment / multifamily construction is in the pipeline within 1–3 miles? Heavy new supply (>2% of stock underway) typically softens rents 12–24 months out; light construction supports rent growth.
Investment metrics
- 1% rule
- 1.29% ✓
- Cap rate
- 10.45%
- Cash-on-cash
- 14.84%
- DSCR
- 1.66
- GRM
- 6.4
CMA / ARV
- ARV (on-the-fly)
- $238,140
- Comps found
- 6
Show comp detail 6 sales within ~0.75 mi
| Address | Dist | Beds/Ba | Sqft | Sold | Price | $/sf | Match |
|---|---|---|---|---|---|---|---|
| 2558 Warsaw Ave | 0.34mi | 5/3.0 | 2,504 (+3%) | 22mo | $252,000 | $101 | 57 |
| 740 Purcell Ave | 0.72mi | 6/2.0 (+1) | 2,454 (+1%) | 13mo | $50,000 | $20 | 49 |
| 966 Fairbanks Ave | 0.61mi | 4/2.0 (-1) | 2,679 (+10%) | 1mo | $25,000 | $9 | 48 |
| 3615 Glenway Ave | 0.65mi | 6/2.0 (+1) | 2,640 (+9%) | 10mo | $259,500 | $98 | 42 |
| 2555 Warsaw Ave | 0.37mi | 5/3.0 | 2,734 (+12%) | 23mo | $160,000 | $59 | 39 |
| 1608 Ross Ave | 0.71mi | 4/3.0 (-1) | 2,076 (-15%) | 12mo | $226,500 | $109 | 24 |
Match score weights: distance 35% · size 25% · config 20% · recency 20%. Top-matched comps best support the ARV.
Projected returns pro-forma
-3.0% appreciation · 3.0% rent growth · sell at horizon
- IRR
- 5.4%
- Equity multiple
- 1.21×
- Total profit
- $11,436
- Equity at exit
- $29,075
- IRR
- 14.8%
- Equity multiple
- 2.20×
- Total profit
- $65,426
- Equity at exit
- $16,860
Cash invested: $54,600 (down + closing). Projections, not guarantees.
Landlord ↔ Tenant lean methodology
- Overall (STATE)
- 73 Landlord-Friendly
- State Ohio
- 73 Landlord-Friendly · R+6
- County
- — inherits STATE
- City
- — inherits STATE
ZIP-level market 45204
- Home prices YoY
- -21.2%
- Active inventory
- 33
- Price-to-rent
- 12.9×
Monthly cashflow live
- Estimated rent
- $2,522 high interval (Pro) →
- Mortgage (P&I)
- −$1,023
- Tax from tax record
- −$213 /mo · $2,558/yr
- Insurance
- −$81
- HOA
- −$0
- Vacancy / Maint / Mgmt
- −$530
- Net cashflow
- $675
Break-even live
2-unit breakdown (identical units grouped — click to expand)
| Units | Beds | Baths | Est. rent |
|---|---|---|---|
| 2× units | 2 | 1 | $2,522 |
| #1 | 2 | 1 | $1,261 |
| #2 | 2 | 1 | $1,261 |
| Total (2 units) | $2,522 | ||
UW: 25.0% down · 7.5% · 30yr · 1.5% tax · 5.0% vac · 8.0% maint · 8.0% mgmt
Financing live
Cash to close
- Down payment
- $48,750
- Closing costs
- $5,850
- Reserves months
- —
- Total cash needed
- —
Loan-product check · same deal, 3 products live
Conventional
25% down · 7.5% · 30yr
- Down + closing
- —
- Monthly P&I
- —
- Monthly cashflow
- —
- DSCR
- —
- Eligible?
- —
Personal DTI + credit; lowest rate.
DSCR
20% down · 8.5% · 30yr
- Down + closing
- —
- Monthly P&I
- —
- Monthly cashflow
- —
- DSCR
- —
- Eligible?
- —
No personal income docs; deal must DSCR.
Hard money
10% down · 12.0% · 12mo
- Down + closing
- —
- Monthly P&I
- —
- Monthly cashflow
- —
- DSCR
- —
- Eligible?
- —
Short-term bridge; refi at stabilization.
Rent comps 6 comps
| Address | Beds | Baths | Sqft | Rent | $/sqft | DOM | Units | Dist |
|---|---|---|---|---|---|---|---|---|
| 1014 Considine Ave Cincinnati, OH | 4.0 | 2.0 | 2200 | $2,000 | $0.91 | 1d | 1 | 0.37mi |
| 1620 Minion Ave Cincinnati, OH | 4.0 | 2.0 | 1845 | $1,550 | $0.84 | 20d | 1 | 0.92mi |
| 1852 Knox St Cincinnati, OH | 4.0 | 1.5 | 1747 | $1,850 | $1.06 | 23d | 1 | 1.02mi |
| 862 Academy Ave Unit 2 Cincinnati, OH | 4.0 | 1.0 | 1627 | $1,450 | $0.89 | 17d | 1 | 1.15mi |
| 905 Suire Ave Unit 2 Cincinnati, OH | 4.0 | 1.0 | 1699 | $1,400 | $0.82 | 23d | 1 | 1.33mi |
| 943 Rosemont Ave Cincinnati, OH | 5.0 | 1.5 | 2132 | $1,700 | $0.80 | 16d | 1 | 1.37mi |
Listing history 31 events
-
2026-06-18days on market $195,000 Active 53 DOM
-
2026-06-17days on market $195,000 Active 52 DOM
-
2026-06-16days on market $195,000 Active 51 DOM
-
2026-06-15days on market $195,000 Active 50 DOM
-
2026-06-13days on market $195,000 Active 48 DOM
-
2026-06-13days on market $195,000 Active 47 DOM
-
2026-06-09days on market $195,000 Active 44 DOM
-
2026-06-08days on market $195,000 Active 43 DOM
-
2026-06-07days on market $195,000 Active 42 DOM
-
2026-06-03days on market $195,000 Active 38 DOM
-
2026-06-02days on market $195,000 Active 37 DOM
-
2026-06-01days on market $195,000 Active 36 DOM
-
2026-05-31days on market $195,000 Active 35 DOM
-
2026-04-26$195,000 Active
-
2026-04-24$195,000 Active
-
2022-05-31soldstatus $115,000 Sold 460-char remark
Show marketing remark (460 chars)
Fantastic Investment Opportunity near the Incline District! Fully occupied brick duplex in East Price Hill. Excellent rental history. Tenants pay gas and electric and heat. Current rents below market. 3 bedroom $755; 1 bedroom $650. Newer water heaters and furnaces. Replaced the sewer line from house to street tie in in 2018. Professional management already in place and can continue with new owner if desired. Sold As Is. Proof of Funds required with offer.
-
2022-04-24historical Contingency Pending 460-char remark
Show marketing remark (460 chars)
Fantastic Investment Opportunity near the Incline District! Fully occupied brick duplex in East Price Hill. Excellent rental history. Tenants pay gas and electric and heat. Current rents below market. 3 bedroom $755; 1 bedroom $650. Newer water heaters and furnaces. Replaced the sewer line from house to street tie in in 2018. Professional management already in place and can continue with new owner if desired. Sold As Is. Proof of Funds required with offer.
-
2022-04-07$124,900 Active 460-char remark
Show marketing remark (460 chars)
Fantastic Investment Opportunity near the Incline District! Fully occupied brick duplex in East Price Hill. Excellent rental history. Tenants pay gas and electric and heat. Current rents below market. 3 bedroom $755; 1 bedroom $650. Newer water heaters and furnaces. Replaced the sewer line from house to street tie in in 2018. Professional management already in place and can continue with new owner if desired. Sold As Is. Proof of Funds required with offer.
-
2021-02-23historical
-
2020-10-22price $109,900
-
2020-09-02$119,900 Active
-
2012-01-26soldstatus $27,500
-
2012-01-24soldstatus $23,500
-
2011-11-10$29,900
-
2003-12-18soldstatus $82,500
-
2003-12-05soldstatus $82,500
-
2003-08-23$85,000
-
1994-05-11soldstatus $42,000
-
1990-12-13soldstatus $38,500
-
1987-05-21soldstatus $36,500
-
1979-05-01soldstatus $25,000
ⓘ Source: listings_history table (triggers on properties + properties_extension) + one-shot
backfill from property_details.listing_events for pre-trigger history.
Tax reassessment forecast OH · Partial reset (capped growth)
- Current annual tax
- $2,558 · $213/mo
- Projected year-2 tax
- $2,800 · $233/mo
- Expected delta
- +$242/yr (+$20/mo · 9.5%)
ⓘ Screening estimate from a state-policy table — verify with the county assessor before closing.
Climate risk First Street
- Flood 1/10 Low FEMA zone X (unshaded) · 0% chance over 30 yrs
- Wildfire 1/10 Low
- Heat 3/10 Moderate 6 d/yr ≥103°F today · 16 d/yr by 30 yrs out
- Wind 2/10 Low 100% chance of damaging wind over 30 yrs
- Air quality 3/10 Moderate 3 unhealthy d/yr today · 5 by 30 yrs out
Nearby sold comps map
Loading sold comps map…
Walkable amenities ~0.75 mi
Loading nearby amenities…
Taxation est. · year 1
- Rental income
- $30,264
- − Mortgage interest
- −$10,923
- − Property taxes
- −$2,558
- − Insurance
- −$975
- − Repairs & maintenance
- −$2,421
- − Management
- −$2,421
- − Depreciation
- −$5,673
- Taxable income
- $5,293
- Est. tax owed @ 24.0%
- −$1,270
- After-tax cash flow
- $6,834/yr
For passive investors: Depreciation is non-cash, so a rental often shows a tax loss while cash-flowing — sheltering income. Rental losses are passive: they offset passive income freely, and up to $25,000/yr can offset ordinary (W-2) income if you actively participate and your MAGI is under $100k (phasing out to $0 by $150k); unused losses carry forward. On sale, claimed depreciation is recaptured at up to 25%, and gains may owe capital-gains tax (a 1031 exchange can defer both). Figures are a year-1 estimate at your 24.0% rate — not tax advice; consult a CPA.
Schools (NCES district)
- District
- Cincinnati Public Schools
- NCES district ID
- 3904375
- Math proficiency
- 25% ▼ -19.00%
- Reading proficiency
- 36% ▼ -14.00%
- Median HH income
- $35,743
- Composite
- 25.21/100
- National rank
- #7508
- State rank
- #581 of 656 in OH
Livability — Cincinnati
- Score
- 80/100
- State rank
- #130
- US rank
- #1856
Category grades
Schools grade is shown separately in the Schools card above.
Census & demographics
- Census place
- Cincinnati, OH
- County
- Hamilton County · 701,295 people
- City population
- 505,555
- Metro
- Cincinnati, OH-KY-IN
- Population (ZIP)
- 8,412
- Household income
- $31,236
- Rent vs Own
- Severe rent burden
- 487.0
Population outlook (Hamilton County) Hauer SSP2
- Today (2025)
- 826,054 people
- By 2030
- 830,947 · +0.6%
- By 2040
- 832,319 · +0.8%
- By 2050
- 822,428 · -0.4%
- By 2075
- 788,688 · -4.5%
- By 2100
- 710,674 · -14.0%
Race, ethnicity, and origin ACS 2023
- Neighborhood character
- Diverse neighborhood (Simpson 0.64)
- Race & ethnicity
- White 44% Black 41% Two or more races 13% Hispanic / Latino 2%
- Common ancestry
- Slovak 1% Lithuanian 1% Italian 1%
- Foreign-born
- 3% · Canada
- Languages at home
- 94% English-only · Spanish 3% Other Indo-European 2% Other Asian/Pacific 1%
Political lean MEDSL · Hamilton
- 2024 margin
- D (+14.9) · D 57.0% · R 42.1%
- 2008→2024 swing
- +7.9pp toward D · 2008: 7.0pp · 2024: 14.9pp
- All cycles
- 2024: D+14.9 2020: D+15.9 2016: D+9.5 2012: D+4.9 2008: D+7.0
Not yet ingested
- Civics
- —
Market trends
- HPI YoY
- ▼ -43.12%
- Current HPI
- 160.5953
- Rent YoY
- —
- Metro
- Cincinnati, OH-KY-IN
- State GDP YoY
- ▲ 1.98%
- F500 in state
- 48
Industry mix (Fortune 500 HQ in OH)
| Industry | F500 HQs | Revenue |
|---|---|---|
| Insurance | 3 | $145B |
|
||
| Industrial Machinery | 3 | $49B |
|
||
| Financial Services | 3 | $24B |
|
||
| Consumer Goods | 2 | $93B |
|
||
| Aerospace / Defense | 2 | $47B |
|
||
| Utilities | 2 | $33B |
|
||
Price history
+680.0% since first listed18 events — show timeline
- 2026-04-26 Listed $195,000 Dayton MLS
- 2026-04-24 Listed $195,000 Cincy MLS
- 2022-05-31 Sold (MLS) $115,000 Cincy MLS
- 2022-04-24 Contingent — Cincy MLS
- 2022-04-07 Listed $124,900 Cincy MLS
- 2021-02-23 Listing Removed — Cincy MLS
- 2020-10-22 Price Changed $109,900 Cincy MLS
- 2020-09-02 Listed $119,900 Cincy MLS
- 2012-01-26 Sold (Public Records) $27,500 Public Records
- 2012-01-24 Sold (MLS) $23,500 Cincy MLS
- 2011-11-10 Listed $29,900 Cincy MLS
- 2003-12-18 Sold (Public Records) $82,500 Public Records
- 2003-12-05 Sold (MLS) $82,500 Cincy MLS
- 2003-08-23 Listed $85,000 Cincy MLS
- 1994-05-11 Sold (Public Records) $42,000 Public Records
- 1990-12-13 Sold (Public Records) $38,500 Public Records
- 1987-05-21 Sold (Public Records) $36,500 Public Records
- 1979-05-01 Sold (Public Records) $25,000 Public Records
Property tax history
+13.1%/yrLatest (2025): $2,558 · +0.1% YoY. Source: county tax records.
Cash-flow waterfall
monthlySold comps — $/sqft
last 12 mo · ≤1 miLoading sold comps…