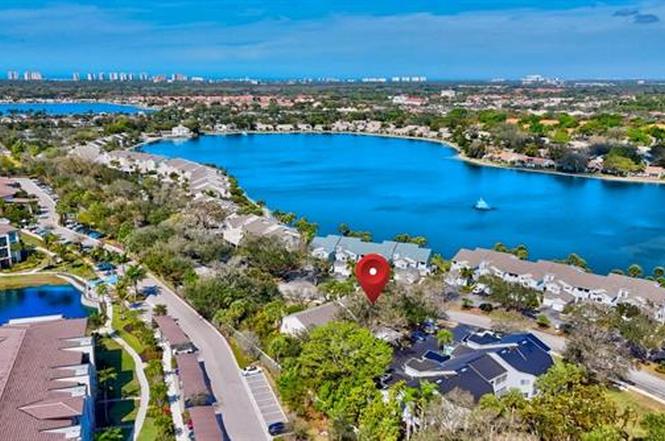
2810 Citrus Lake Dr Unit U201 · Pelican Marsh, FL
Flood risk No data
- FEMA flood zone
- —
- Chance of flooding over 30 yrs
- —
- Est. flood insurance / yr
- —
Fire risk No data
- Est. fire insurance / yr
- —
Heat risk No data
- Hot days now (above threshold)
- —
- Hot days in 30 yrs
- —
Wind risk No data
- Chance of severe wind over 30 yrs
- —
Air-quality risk No data
- Unhealthy air days now
- —
- Unhealthy air days in 30 yrs
- —
Risk factors via First Street. Map © Google.
Why this score? — see what drove the B+ grade
The composite is a weighted blend of 9 inputs, each scored 0–100. Each bar is that input's sub-score; the figure is the points it added to the 100-point composite (weight × sub-score).
- Cash flow +30.0/30.0
- 1% rule +10.0/10.0
- DSCR +10.0/10.0
- ARV discount +7.5/15.0
- Appreciation +5.1/10.0
- Schools +5.0/10.0
- Condition / age +3.8/5.0
- Rent growth +2.7/5.0
- Livability +2.5/5.0
$215,000
🖨 Deal sheet 📄 Offer letter ✓ Due diligence
Listing remarks
Lakeside is a premier gated community surrounding a beautiful 40-acre lake in the heart of North Naples, offering an unbeatable lifestyle just minutes from the Gulf’s white-sand beaches. This second-floor, two-bedroom, two-bath residence presents a rare opportunity to build instant equity in a high-demand area with A-rated schools. The home features granite countertops in the kitchen and bathrooms. A spacious master suite offers a walk-in closet and en-suite with dual sinks. From the private screened-in lanai, you can enjoy the serene sights and sounds of nature and mature landscaping—a perfect spot to savor your morning coffee or dine al fresco with a glass of wine in hand. Thi
Key facts
- Gated community
- 40 acre lake
- Granite countertops
Tags
Property features AI
Finance
- Other: Community amenities include: community pool and spa, clubhouse, exercise room, library, community room, play area, bike and jog path, sidewalks, streetlights, BBQ/picnic area, basketball, pickleball, shuffleboard, billiards, sauna, community park; underground utilities; Community type: boating, gated, tennis
- Financial info: Total annual recurring HOA fees reported; Total one-time fees reported
- HOA & community: Mandatory HOA; Quarterly master HOA fee; Quarterly condo fee; Professional management; HOA covers cable, insurance, internet/WiFi, irrigation water, lawn/land maintenance, pest control (interior & exterior), sewer, street maintenance, street lights, trash removal, water, recreation facilities, reserve, manager, legal/accounting
Exterior
- Parking: 1 assigned parking space; Covered parking; Paved driveway; Detached 1-car carport; Guest parking available
- Security: Gated community
- Utilities: Central water; Central sewer; Cable available
- Home design: Residential garden-style unit in a low-rise (1-3) building; Built in 1991; Concrete block construction with stucco finish; Shingle roof; Rear exposure to the west; Unit: Lot/Unit 201 in the Lakeside development (Lakeside Gardens)
- Construction: Concrete block construction; Stucco exterior; Shingle roof; Built in 1991
- Exterior features: Storage; Lake/Canal irrigation; Landscaped area and wooded area views; Paved road access; Zero lot line
Interior
- Kitchen: Range; Microwave; Refrigerator/Freezer; Disposal
- Bedrooms: 2 bedrooms (split bedroom floor plan)
- Flooring: Concrete; Tile; Wood
- Bathrooms: 2 full bathrooms; Primary bath with dual sinks and shower (no tub)
- Heating & cooling: Central electric heat; Central electric air conditioning; Ceiling fans
- Interior features: Vaulted ceiling; Walk-in closet; Window coverings; Screened lanai/porch; Laundry in residence; 6 total rooms; 4 ceiling fans
- Laundry & utility: Washer and dryer in unit; Tankless water heater; Smoke detector
Neighborhood map
What this means for you Summary
Snapshot
- This is a 2-bed/2.0-bath condo listed at $215k. Condition is rated good.
Deal economics
- At list price, monthly cash flow is $1k ($14k/yr) — positive.
- The deal already cash-flows at list — no discount required.
- Meets the 1% rule at list price ($4k rent vs $215k).
- Recommended offer: $209k (3.0% below list) — sets the bar for market timing.
Location & tenants
- Location reads: area grade B — affects rentability + tenant quality, not the cash-flow math above.
- Collier (suburban): math 60% / reading 56% proficiency, ranked #16 of 73 in FL (top 22%) — acceptable for families but not a draw, mixed tenant base, ~2y average lease.
- Zoned schools: Pelican Marsh Elementary School (math 87% / reading 83%, grade A+, #35 of 2,144 statewide, top 2%, 709 students, 29% FRL); Barron Collier High School (math 62% / reading 68%, grade B, #76 of 667 statewide, top 11%, 1,650 students, 26% FRL) — zoned schools average 28% FRL vs 55% district-wide (27 pts lower); this property's tenant base skews higher-income than the district average.
- Zoned-school proficiency averages 75% at this address vs 58% district-wide (+17 pts) — the actual schools serving this property are materially stronger than the Collier average implies; a family-tenant draw the district grade alone would hide.
- Market conditions: Rents flat; 424 active listings in the ZIP; 40 comparable units currently listed for rent nearby; rentals at typical pace (median 23d on market — plan ~3-4 weeks tenant-placement turnaround); solid renter incomes; 3,520 units permitted in Collier County in 2024 (959 in 5+ unit buildings).
- At $4,344/mo this rent would consume 57% of the median local household income ($92k/yr) (locally 1712% of renters already pay >50% of income on rent) — very limited rent-growth headroom before tenants either downsize or default.
Forward outlook
- In year one you build about $2k of equity ($1k loan paydown + $634 appreciation (0.3% local appreciation)).
- Collier County population projected at +30% by 2050 — long-run rental-demand tailwind backs the buy-and-hold thesis.
- At projected returns (0.3% appreciation + 0.9% rent growth), your $60k cash investment doubles in ~4 years — after that, you're playing with house money.
Negotiation context
- It's been on market 51 days — a 3% lower offer ($209k) is reasonable based on typical stale-listing flexibility.
Questions for the listing agent
- It's been on market 51 days. Have you received any prior offers? Is the seller open to a 3% concession, seller financing, or rate buy-down credit?
- What does the HOA fee cover, when was the last increase, and are there any pending special assessments or reserve-fund shortfalls?
- Any open or pending special assessments — roof, HVAC, plumbing, elevator, façade? What's the per-unit balance and payoff schedule, and is the seller paying it off at close or rolling it to the buyer?
- Is there a deadline driving the sale (1031 exchange, divorce, estate, relocation)? That informs how much negotiation room exists.
- What's the average days-on-market for RENTAL listings here right now (not sales)? A rising rental-DOM trend means longer vacancies and softer asking-rent achievability than the comps imply.
- What's the recent tenant-quality profile in this submarket — average credit score on applications, eviction rate, late-payment / NSF rate, and stable-employment percentage? A property-management company in the area should have these aggregated.
- How much new apartment / multifamily construction is in the pipeline within 1–3 miles? Heavy new supply (>2% of stock underway) typically softens rents 12–24 months out; light construction supports rent growth.
Investment metrics
- 1% rule
- 2.02% ✓
- Cap rate
- 13.03%
- Cash-on-cash
- 24.04%
- DSCR
- 2.07
- GRM
- 4.1
CMA / ARV
No comps found within radius.
Projected returns pro-forma
0.29% appreciation · 0.92% rent growth · sell at horizon
- IRR
- 22.5%
- Equity multiple
- 2.08×
- Total profit
- $65,144
- Equity at exit
- $65,618
- IRR
- 24.6%
- Equity multiple
- 3.56×
- Total profit
- $154,341
- Equity at exit
- $81,468
Cash invested: $60,200 (down + closing). Projections, not guarantees.
Landlord ↔ Tenant lean methodology
- Overall (STATE)
- 87 Strongly Landlord-Friendly
- State Florida
- 87 Strongly Landlord-Friendly · R+3
- County
- — inherits STATE
- City
- — inherits STATE
ZIP-level market 34109
- Home prices YoY
- 0.1%
- Rents YoY
- 0.9%
- Active inventory
- 424
- Price-to-rent
- 4.1×
Monthly cashflow live
- Estimated rent
- $4,344 high interval (Pro) →
- Mortgage (P&I)
- −$1,127
- Tax est. 1.5%
- −$269 /mo · $3,225/yr
- Insurance
- −$90
- HOA
- −$740
- Vacancy / Maint / Mgmt
- −$912
- Net cashflow
- $1,206
Break-even live
UW: 25.0% down · 7.5% · 30yr · 1.5% tax · 5.0% vac · 8.0% maint · 8.0% mgmt
Financing live
Cash to close
- Down payment
- $53,750
- Closing costs
- $6,450
- Reserves months
- —
- Total cash needed
- —
Loan-product check · same deal, 3 products live
Conventional
25% down · 7.5% · 30yr
- Down + closing
- —
- Monthly P&I
- —
- Monthly cashflow
- —
- DSCR
- —
- Eligible?
- —
Personal DTI + credit; lowest rate.
DSCR
20% down · 8.5% · 30yr
- Down + closing
- —
- Monthly P&I
- —
- Monthly cashflow
- —
- DSCR
- —
- Eligible?
- —
No personal income docs; deal must DSCR.
Hard money
10% down · 12.0% · 12mo
- Down + closing
- —
- Monthly P&I
- —
- Monthly cashflow
- —
- DSCR
- —
- Eligible?
- —
Short-term bridge; refi at stabilization.
Rent comps 40 comps
| Address | Beds | Baths | Sqft | Rent | $/sqft | DOM | Units | Dist |
|---|---|---|---|---|---|---|---|---|
| 2860 Citrus Lake Dr Unit R202 Naples, FL | 3.0 | 2.0 | 1590 | $5,000 | $3.14 | 23d | 1 | 0.06mi |
| 2860 Citrus Lake Dr Unit R-202 Naples, FL | 3.0 | 2.0 | 1590 | $5,000 | $3.14 | 13d | 1 | 0.06mi |
| 2880 Citrus Lake Dr Unit Q201 Naples, FL | 3.0 | 2.0 | 1590 | $2,495 | $1.57 | 13d | 1 | 0.10mi |
| 2731 Citrus Lake Dr #202 Naples, FL | 2.0 | 2.0 | 1260 | $2,500 | $1.98 | 13d | 1 | 0.10mi |
| 3048 Horizon Ln #1104 Naples, FL | 3.0 | 2.5 | 1818 | $5,150 | $2.83 | 23d | 1 | 0.14mi |
| 2711 Citrus Lake Dr Unit F302 Naples, FL | 2.0 | 2.0 | 1272 | $4,500 | $3.54 | 13d | 1 | 0.14mi |
| 2711 Citrus Lake Dr Unit F305 Naples, FL | 3.0 | 2.0 | 1480 | $5,500 | $3.72 | 13d | 1 | 0.14mi |
| 2885 Citrus Lake Dr Unit N103 Naples, FL | 2.0 | 2.0 | 1249 | $5,250 | $4.20 | 13d | 1 | 0.15mi |
| 3051 Horizon Ln #1803 Naples, FL | 2.0 | 2.0 | 1482 | $5,100 | $3.44 | 23d | 1 | 0.17mi |
| 3035 Horizon Ln #2206 Naples, FL | 2.0 | 2.0 | 1246 | $6,000 | $4.82 | 23d | 1 | 0.17mi |
| 2671 Citrus Lake Dr Unit E-303 Naples, FL | 2.0 | 2.0 | 1380 | $3,500 | $2.54 | 13d | 1 | 0.18mi |
| 2671 Citrus Lake Dr Unit E-201 Naples, FL | 3.0 | 2.0 | 1380 | $5,250 | $3.80 | 13d | 1 | 0.18mi |
| 2864 Mizzen Way Unit Y106 Naples, FL | 2.0 | 2.0 | 1350 | $5,200 | $3.85 | 13d | 1 | 0.20mi |
| 7030 Lone Oak Blvd Naples, FL | 3.0 | 2.0 | 1700 | $6,400 | $3.76 | 13d | 1 | 0.21mi |
| 2651 Citrus Lake Dr Unit D302 Naples, FL | 2.0 | 2.0 | 1250 | $5,000 | $4.00 | 13d | 1 | 0.21mi |
| 2730 Sailors Way Naples, FL | 3.0 | 3.0 | 1700 | $9,000 | $5.29 | 23d | 1 | 0.22mi |
| 2611 Citrus Lake Dr Unit C-203 Naples, FL | 3.0 | 2.0 | 1710 | $5,500 | $3.22 | 13d | 1 | 0.25mi |
| 7710 Ahoy Ave Naples, FL | 3.0 | 2.0 | 1580 | $2,950 | $1.87 | 23d | 1 | 0.26mi |
| 2835 Mizzen Way Naples, FL | 3.0 | 2.0 | 1641 | $2,900 | $1.77 | 23d | 1 | 0.27mi |
| 3015 Horizon Ln #2702 Naples, FL | 3.0 | 2.0 | 1399 | $1,790 | $1.28 | 23d | 1 | 0.28mi |
| 2541 Citrus Lake Dr Unit A-205 Naples, FL | 3.0 | 2.0 | 1590 | $5,250 | $3.30 | 13d | 1 | 0.32mi |
| 3009 Driftwood Way #2802 Naples, FL | 3.0 | 2.0 | 1399 | $2,000 | $1.43 | 23d | 1 | 0.36mi |
| 7416 Plumbago Bridge Rd #103 Naples, FL | 2.0 | 2.0 | 1223 | $2,400 | $1.96 | 13d | 1 | 0.36mi |
| 2608 Sailors Way #122 Naples, FL | 2.0 | 2.0 | 1387 | $5,500 | $3.97 | 23d | 1 | 0.36mi |
| 3062 Driftwood Way #4301 Naples, FL | 3.0 | 2.0 | 1573 | $6,500 | $4.13 | 23d | 1 | 0.37mi |
| 2516 Orchid Bay Dr #203 Naples, FL | 2.0 | 2.0 | 1360 | $4,750 | $3.49 | 23d | 1 | 0.39mi |
| 3057 Driftwood Way #4004 Naples, FL | 3.0 | 2.5 | 1818 | $6,400 | $3.52 | 23d | 1 | 0.40mi |
| 3017 Driftwood Way #3001 Naples, FL | 3.0 | 2.0 | 1385 | $5,000 | $3.61 | 23d | 1 | 0.41mi |
| 2460 Old Groves Rd Unit E102 Naples, FL | 2.0 | 2.0 | 1226 | $2,400 | $1.96 | 13d | 1 | 0.46mi |
| 3025 Driftwood Way #3203 Naples, FL | 2.0 | 2.0 | 1248 | $3,900 | $3.12 | 23d | 1 | 0.46mi |
| 3049 Driftwood Way #3806 Naples, FL | 3.0 | 2.5 | 1818 | $4,700 | $2.59 | 23d | 1 | 0.46mi |
| 3029 Driftwood Way #3303 Naples, FL | 2.0 | 2.0 | 1248 | $4,000 | $3.21 | 23d | 1 | 0.49mi |
| 7518 Silver Trumpet Ln Unit Q102 Naples, FL | 2.0 | 2.0 | 1300 | $2,600 | $2.00 | 13d | 1 | 0.49mi |
| 3037 Driftwood Way #3505 Naples, FL | 2.0 | 2.0 | 1248 | $2,500 | $2.00 | 23d | 1 | 0.51mi |
| 2585 Old Groves Rd Unit L203 Naples, FL | 2.0 | 2.0 | 1448 | $5,500 | $3.80 | 13d | 1 | 0.54mi |
| 7762 Gardner Dr #102 Naples, FL | 2.0 | 2.0 | 1607 | $6,000 | $3.73 | 23d | 1 | 0.57mi |
| 6654 Tannin Ln Unit B Naples, FL | 2.0 | 2.0 | 1441 | $3,100 | $2.15 | 23d | 1 | 0.59mi |
| 2729 Branch Ln Naples, FL | 3.0 | 2.0 | 1800 | $3,650 | $2.03 | 23d | 1 | 0.63mi |
| 7287 Mill Pond Cir Naples, FL | 3.0 | 2.0 | 1355 | $3,800 | $2.80 | 23d | 1 | 0.63mi |
| 7271 Mill Pond Cir Naples, FL | 3.0 | 2.0 | 1700 | $8,250 | $4.85 | 23d | 1 | 0.66mi |
HOA detail condo
- Monthly dues
- $740 · $8,880/yr
- Likely covers
- landscapingsecurity
- Assessments
- None detected in remarks — confirm with the listing agent.
Listing history 2 events
-
2026-06-03remarks 687-char remark
-
2026-06-03$215,000 Pending 51 DOM
ⓘ Source: listings_history table (triggers on properties + properties_extension) + one-shot
backfill from property_details.listing_events for pre-trigger history.
Nearby sold comps map
Loading sold comps map…
Walkable amenities ~0.75 mi
Loading nearby amenities…
Taxation est. · year 1
- Rental income
- $52,132
- − Mortgage interest
- −$12,043
- − Property taxes
- −$3,225
- − Insurance
- −$1,075
- − Repairs & maintenance
- −$4,171
- − Management
- −$4,171
- − HOA
- −$8,880
- − Depreciation
- −$6,255
- Taxable income
- $12,313
- Est. tax owed @ 24.0%
- −$2,955
- After-tax cash flow
- $11,519/yr
For passive investors: Depreciation is non-cash, so a rental often shows a tax loss while cash-flowing — sheltering income. Rental losses are passive: they offset passive income freely, and up to $25,000/yr can offset ordinary (W-2) income if you actively participate and your MAGI is under $100k (phasing out to $0 by $150k); unused losses carry forward. On sale, claimed depreciation is recaptured at up to 25%, and gains may owe capital-gains tax (a 1031 exchange can defer both). Figures are a year-1 estimate at your 24.0% rate — not tax advice; consult a CPA.
Condition & rehab AI · 13 photos
This well-maintained, two-bedroom condo in a gated community offers a serene lakeside setting with granite countertops and hardwood floors. A fresh coat of paint on the exterior and trimming the bushes would significantly enhance its curb appeal and resale value.
Value-add opportunities
- Both Paint exterior — Enhances curb appeal and resale value
- Both Trim bushes — Improves landscaping and enhances curb appeal
Renovation cost estimate screening
Value-add ROI direction
- Both Paint exterior — Enhances curb appeal and resale value ↑
- Both Trim bushes — Improves landscaping and enhances curb appeal ↑
ⓘ Cost ranges are severity-bucket heuristics (US national rule-of-thumb). Get contractor quotes + a written scope before underwriting a rehab budget.
Schools (NCES district)
- District
- Collier
- NCES district ID
- 1200330
- Math proficiency
- 60% ▼ -4.00%
- Reading proficiency
- 56% ▼ -2.00%
- Median HH income
- $58,275
- Composite
- 50.23/100
- National rank
- #1892
- State rank
- #16 of 73 in FL
Livability — Pelican Marsh
No livability data for this city. (Only ~50 U.S. cities are tracked.)
Census & demographics
- County
- Collier County · 396,295 people
- Metro
- Naples-Marco Island, FL
- Population (ZIP)
- 27,273
- Household income
- $92,259
- Rent vs Own
- Severe rent burden
- 1712.0
Population outlook (Collier County) Hauer SSP2
- Today (2025)
- 420,858 people
- By 2030
- 450,054 · +6.9%
- By 2040
- 502,232 · +19.3%
- By 2050
- 544,932 · +29.5%
- By 2075
- 627,203 · +49.0%
- By 2100
- 659,015 · +56.6%
Race, ethnicity, and origin ACS 2023
- Neighborhood character
- Predominantly White (78%)
- Race & ethnicity
- White 78% Hispanic / Latino 11% Two or more races 9% Black 4% Asian 4%
- Hispanic origin (detail)
- Mexican 1% Puerto Rican 1% Cuban 3%
- Common ancestry
- Romanian 5% Scotch-Irish 3% Lithuanian 2%
- Foreign-born
- 20% · Canada, Jamaica, Vietnam
- Languages at home
- 77% English-only · Spanish 10% Other Indo-European 5% Russian/Polish/Slavic 3%
Political lean MEDSL · Collier
- 2024 margin
- Solid R (+33.1) · D 33.1% · R 66.2%
- 2008→2024 swing
- -10.6pp toward R · 2008: -22.5pp · 2024: -33.1pp
- All cycles
- 2024: R+33.1 2020: R+24.7 2016: R+26.0 2012: R+30.1 2008: R+22.5
Not yet ingested
- Civics
- —
Market trends
- HPI YoY
- ▲ 0.29%
- Current HPI
- 279.357
- Rent YoY
- ▲ 0.92%
- Metro
- Naples-Marco Island, FL
- State GDP YoY
- ▲ 3.28%
- F500 in state
- 36
Industry mix (Fortune 500 HQ in FL)
| Industry | F500 HQs | Revenue |
|---|---|---|
| Industrial Technology | 2 | $29B |
|
||
| Insurance | 2 | $17B |
|
||
| Retail | 1 | $60B |
|
||
| Technology Distribution | 1 | $58B |
|
||
| Homebuilding | 1 | $35B |
|
||
| Technology Manufacturing | 1 | $35B |
|
||
Price history
-4.4% since first listed3 events — show timeline
- 2026-04-24 Pending — NAPLESMLS
- 2026-04-22 Price Changed $215,000 NAPLESMLS
- 2026-03-05 Listed $225,000 NAPLESMLS
Cash-flow waterfall
monthlySold comps — $/sqft
last 12 mo · ≤1 miLoading sold comps…