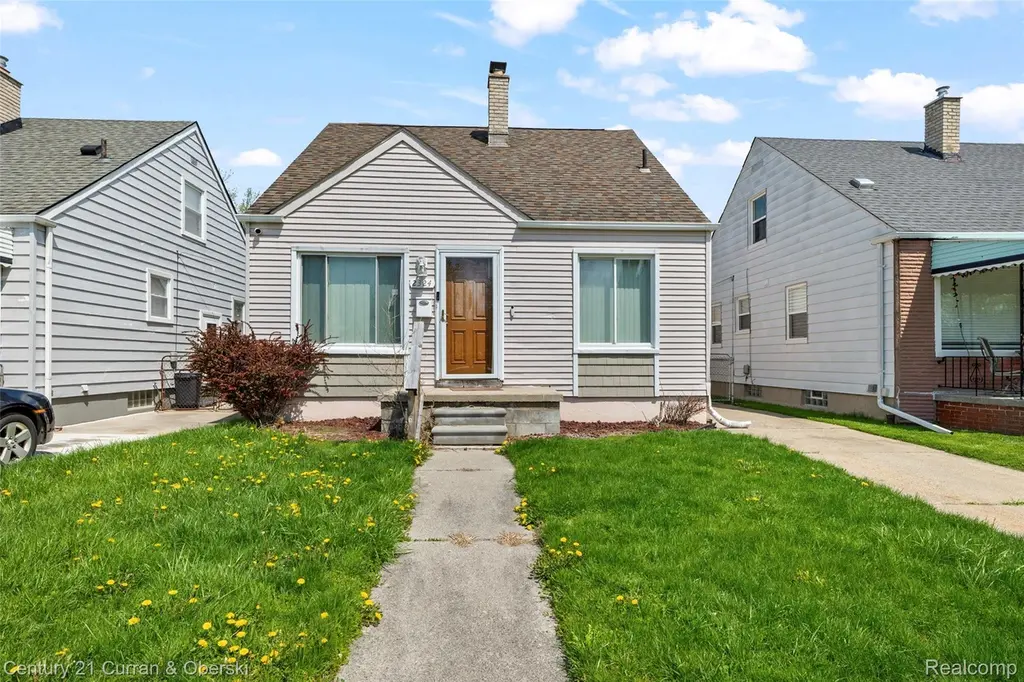
2324 Minnie St · Lincoln Park, MI
Flood risk 1/10 · Minimal
- FEMA flood zone
- X (unshaded)
- Chance of flooding over 30 yrs
- 0.0%
- Est. flood insurance / yr
- $473 – $860
Fire risk 1/10 · Minimal
- Est. fire insurance / yr
- $784 – $1,456
Heat risk 3/10 · Minor
- Hot days now (above 96°F)
- 7 days/yr
- Hot days in 30 yrs
- 15 days/yr
Wind risk 2/10 · Minimal
- Chance of severe wind over 30 yrs
- —
Air-quality risk 3/10 · Minor
- Unhealthy air days now
- 3 days/yr
- Unhealthy air days in 30 yrs
- 5 days/yr
Risk factors via First Street. Map © Google.
Why this score? — see what drove the C grade
The composite is a weighted blend of 9 inputs, each scored 0–100. Each bar is that input's sub-score; the figure is the points it added to the 100-point composite (weight × sub-score).
- Cash flow +19.9/30.0
- ARV discount +15.0/15.0
- DSCR +6.3/10.0
- 1% rule +6.0/10.0
- Livability +4.0/5.0
- Rent growth +3.7/5.0
- Condition / age +2.5/5.0
- Schools +2.0/10.0
- Appreciation +0.0/10.0
$134,900
🖨 Deal sheet (PDF) 📄 Offer letter ✓ Due diligence
Listing remarks MLS
Comfortable and updated single-family home in the heart of Lincoln Park featuring modern touches, spacious living areas, move-in ready appeal, a secluded setting, and ample garage space. Property showings to occur with a Licensed Michigan Realtor Property is subject to probate Approval Buyer to assume city-required repairs
Key facts
- Single-family home
- Modern touches
- Secluded setting
Tags
Property features AI
Exterior
- Parking: Detached garage; Driveway; Basement access to parking; One garage space
- Utilities: Public water; Public sewer
- Home design: Single-family residence; Two stories; Ground-level entry; Vinyl siding
- Construction: Brick/mortar foundation; Vinyl siding exterior
- Exterior features: Front porch; Paved road access
Interior
- Bathrooms: One full bathroom
- Heating & cooling: Forced air heating (natural gas); No central cooling
- Interior features: Unfinished basement; Five total rooms
Neighborhood map
What this means for you Summary
Snapshot
- This is a 3-bed/1.0-bath single-family listed at $135k.
Deal economics
- At list price, monthly cash flow is $164 ($2k/yr) — positive.
- The deal already cash-flows at list — no discount required.
- Meets the 1% rule at list price ($1k rent vs $135k).
- Cap rate 7.8% vs local median 6.4% in Lincoln Park — meaningfully above typical; check what's discounted (condition, days-on-market, listing class) to confirm the premium yield is real.
Location & tenants
- Location reads 80/100 on livability (#82 in MI, #1,720 nationally) — a professional / high-income tenant draw. Strengths: amenities A+, commute A+, cost of living A+; Watch: schools D-, crime F, employment D-.
- Lincoln Park School District (suburban): math 15% / reading 32% proficiency, ranked #440 of 540 in MI (top 82%) — low school quality limits family demand, transient renter base, plan for 1-2y turnover; 72% free/reduced lunch — lower-income household profile, screen leases tightly.
- Market conditions: Rents rising fast (+4.7%/yr); 151 active listings in the ZIP; 11 comparable units currently listed for rent nearby; rentals at typical pace (median 25d on market — plan ~3-4 weeks tenant-placement turnaround); 2,639 units permitted in Wayne County in 2024 (1,216 in 5+ unit buildings).
- This rent runs 30% of the median local income ($59k/yr) — at the standard rent-burdened threshold; future hikes will face affordability resistance.
Forward outlook
- Local home prices are declining (-3.0%/yr); year-one equity from $933 of loan paydown is wiped out by about $4k of value loss. Plan a longer hold.
- Wayne County population projected at -17% by 2050 — secular population decline; favor cash flow + early exit over multi-decade hold.
Negotiation context
- Only 4 days on market — expect competitive offers; lowballing is unlikely to land.
- 9 sale attempts since 25y ago with the ask held roughly flat each time — persistent listings suggest the price (not the market) is what's stuck; bring a comps-based counter.
Risks & watch-outs
- Watch-outs: built in 1950 — expect roof / HVAC / electrical / plumbing capex.
Questions for the listing agent
- Built in 1950 — when were the roof, HVAC, electrical panel, plumbing, and water heater last replaced?
- Is there a deadline driving the sale (1031 exchange, divorce, estate, relocation)? That informs how much negotiation room exists.
- Schools are D-rated, which usually means shorter tenancies and higher turnover. Who's the typical renter profile here, and what's been the actual vacancy rate?
- Crime grade is F in this area — have there been break-ins, vandalism, or insurance claims at this property in the last 3 years? What carrier currently insures it and at what premium?
- What's the average days-on-market for RENTAL listings here right now (not sales)? A rising rental-DOM trend means longer vacancies and softer asking-rent achievability than the comps imply.
- What's the recent tenant-quality profile in this submarket — average credit score on applications, eviction rate, late-payment / NSF rate, and stable-employment percentage? A property-management company in the area should have these aggregated.
- How much new for-sale + rental construction is in the pipeline within 1–3 miles? Heavy new supply typically softens prices + rents 12–24 months out; constrained supply supports both.
Investment metrics
- 1% rule
- 1.10% ✓
- Cap rate
- 7.75%
- Cash-on-cash
- 5.21%
- DSCR
- 1.23
- GRM
- 7.6
CMA / ARV
- ARV (on-the-fly)
- $183,600
- Comps found
- 12
Show comp detail 12 sales within ~0.75 mi
| Address | Dist | Beds/Ba | Sqft | Sold | Price | $/sf | Match |
|---|---|---|---|---|---|---|---|
| 2359 Detroit Ave | 0.05mi | 3/1.0 | 1,080 (0%) | 1mo | $196,000 | $181 | 97 |
| 2366 Progress Ave | 0.12mi | 3/1.0 | 1,120 (+4%) | 3mo | $145,000 | $129 | 86 |
| 14576 Oceana Ave | 0.32mi | 3/1.0 | 1,042 (-4%) | 2mo | $175,000 | $168 | 78 |
| 15044 Oceana Ave | 0.48mi | 3/1.0 | 1,000 (-7%) | 2mo | $195,000 | $195 | 64 |
| 2071 Meyer Ct | 0.48mi | 3/1.5 | 999 (-8%) | 2mo | $190,000 | $190 | 61 |
| 9616 Colwell Ave | 0.57mi | 3/1.0 | 1,031 (-4%) | 6mo | $175,000 | $170 | 61 |
| 9949 Sterling Ave | 0.70mi | 3/1.5 | 1,050 (-3%) | 3mo | $234,000 | $223 | 58 |
| 2121 Buckingham Ave | 0.61mi | 3/1.0 | 1,012 (-6%) | 4mo | $159,900 | $158 | 58 |
| 2119 White Ave | 0.71mi | 3/1.0 | 1,000 (-7%) | 1mo | $166,500 | $167 | 54 |
| 1860 Pagel Ave | 0.65mi | 3/1.0 | 1,162 (+8%) | 6mo | $160,000 | $138 | 52 |
| 1836 Garfield Ave | 0.72mi | 2/1.0 (-1) | 1,190 (+10%) | 2mo | $135,000 | $113 | 43 |
| 7208 Rosedale Blvd | 0.58mi | 3/2.0 | 1,214 (+12%) | 7mo | $220,000 | $181 | 42 |
Match score weights: distance 35% · size 25% · config 20% · recency 20%. Top-matched comps best support the ARV.
Projected returns pro-forma
-3.0% appreciation · 4.65% rent growth · sell at horizon
- IRR
- -6.2%
- Equity multiple
- 0.77×
- Total profit
- $-8,850
- Equity at exit
- $20,114
- IRR
- 5.5%
- Equity multiple
- 1.44×
- Total profit
- $16,602
- Equity at exit
- $11,664
Cash invested: $37,772 (down + closing). Projections, not guarantees.
Landlord ↔ Tenant lean methodology
- Overall (STATE)
- 62 Landlord-Friendly
- State Michigan
- 62 Landlord-Friendly · EVEN
- County
- — inherits STATE
- City
- — inherits STATE
ZIP-level market 48146
- Home prices YoY
- -32.7%
- Rents YoY
- 4.7%
- Active inventory
- 151
- Price-to-rent
- 7.6×
Monthly cashflow live
- Estimated rent
- $1,478 high interval (Pro) →
- Mortgage (P&I)
- −$707
- Tax from tax record
- −$240 /mo · $2,877/yr
- Insurance
- −$56
- HOA
- −$0
- Vacancy / Maint / Mgmt
- −$310
- Net cashflow
- $164
Break-even live
Sensitivity live
| Price | -10% $240 | -5% $202 | +0% $164 | +5% $126 | +10% $88 |
|---|---|---|---|---|---|
| Rent | -10% $47 | -5% $106 | +0% $164 | +5% $222 | +10% $281 |
| Rate | -1.0pp $232 | -0.5pp $198 | base $164 | +0.5pp $129 | +1.0pp $94 |
UW: 25.0% down · 7.5% · 30yr · 1.5% tax · 5.0% vac · 8.0% maint · 8.0% mgmt
Financing live
Cash to close
- Down payment
- $33,725
- Closing costs
- $4,047
- Reserves months
- —
- Total cash needed
- —
Loan-product check · same deal, 3 products live
Conventional
25% down · 7.5% · 30yr
- Down + closing
- —
- Monthly P&I
- —
- Monthly cashflow
- —
- DSCR
- —
- Eligible?
- —
Personal DTI + credit; lowest rate.
DSCR
20% down · 8.5% · 30yr
- Down + closing
- —
- Monthly P&I
- —
- Monthly cashflow
- —
- DSCR
- —
- Eligible?
- —
No personal income docs; deal must DSCR.
Hard money
10% down · 12.0% · 12mo
- Down + closing
- —
- Monthly P&I
- —
- Monthly cashflow
- —
- DSCR
- —
- Eligible?
- —
Short-term bridge; refi at stabilization.
Rent comps 11 comps
| Address | Beds | Baths | Sqft | Rent | $/sqft | DOM | Units | Dist |
|---|---|---|---|---|---|---|---|---|
| 2235 Moore Rd Unit 1 Lincoln Park, MI | 2.0 | 1.0 | 800 | $1,000 | $1.25 | 25d | 1 | 0.34mi |
| 9725 Fox Ave Allen Park, MI | 3.0 | 1.5 | 940 | $1,850 | $1.97 | 44d | 1 | 0.49mi |
| 9814 Quandt Ave Allen Park, MI | 3.0 | 2.0 | 1050 | $1,800 | $1.71 | 44d | 1 | 0.85mi |
| 9725 Ruth Allen Park, MI | 3.0 | 1.5 | 1110 | $1,800 | $1.62 | 3d | 1 | 0.85mi |
| 1343 Pagel Ave Unit 2-Upper Lincoln Park, MI | 2.0 | 1.0 | 1000 | $1,250 | $1.25 | 18d | 1 | 1.15mi |
| 1552 Hanover St Lincoln Park, MI | 2.0 | 1.0 | 800 | $1,250 | $1.56 | 25d | 1 | 1.17mi |
| 15806 Meyer Ave Allen Park, MI | 3.0 | 2.0 | 1100 | $1,650 | $1.50 | 2d | 1 | 1.28mi |
| 11400 Fordline St Allen Park, MI | 1.0–2.0 | 1.0 | 880 | $1,400 | $1.59 | 0d | 1 | 1.33mi |
| 1760 Saint Johns Blvd Apt 14 Lincoln Park, MI | 2.0 | 1.0 | 750 | $995 | $1.33 | 25d | 1 | 1.40mi |
| 1750 Saint Johns Blvd Unit 17 Lincoln Park, MI | 2.0 | 1.0 | 750 | $1,025 | $1.37 | 25d | 1 | 1.41mi |
| 1532 Euclid St #1 Lincoln Park, MI | 2.0 | 1.0 | 850 | $1,450 | $1.71 | 25d | 1 | 1.42mi |
Listing history 24 events
-
2026-05-15status Pending 324-char remark
Show marketing remark (324 chars)
Comfortable and updated single-family home in the heart of Lincoln Park featuring modern touches, spacious living areas, move-in ready appeal, a secluded setting, and ample garage space. Property showings to occur with a Licensed Michigan Realtor Property is subject to probate Approval Buyer to assume city-required repairs
-
2026-05-15status Pending
Show marketing remark (324 chars)
Comfortable and updated single-family home in the heart of Lincoln Park featuring modern touches, spacious living areas, move-in ready appeal, a secluded setting, and ample garage space. Property showings to occur with a Licensed Michigan Realtor Property is subject to probate Approval Buyer to assume city-required repairs
-
2026-05-11$134,900 Active
Show marketing remark (324 chars)
Comfortable and updated single-family home in the heart of Lincoln Park featuring modern touches, spacious living areas, move-in ready appeal, a secluded setting, and ample garage space. Property showings to occur with a Licensed Michigan Realtor Property is subject to probate Approval Buyer to assume city-required repairs
-
2026-05-11$134,900 Active 324-char remark
Show marketing remark (324 chars)
Comfortable and updated single-family home in the heart of Lincoln Park featuring modern touches, spacious living areas, move-in ready appeal, a secluded setting, and ample garage space. Property showings to occur with a Licensed Michigan Realtor Property is subject to probate Approval Buyer to assume city-required repairs
-
2022-02-04soldstatus $155,000
-
2012-07-05historical
-
2012-07-05historical
-
2012-06-06soldstatus $47,000
-
2012-05-13soldstatus $47,000
-
2012-01-07$49,000
-
2012-01-07$49,000
-
2012-01-07$49,000
-
2009-11-25soldstatus $18,700
-
2009-11-25soldstatus $18,700
-
2009-11-04historical
-
2009-08-11$18,700
-
2009-08-11$18,700
-
2002-01-25soldstatus $92,900
-
2001-11-21soldstatus $92,900
-
2001-11-21soldstatus $92,900
-
2001-10-21historical
-
2001-10-14$89,900
-
2001-10-13$89,900
-
1998-09-29soldstatus $42,500
ⓘ Source: listings_history table (triggers on properties + properties_extension) + one-shot
backfill from property_details.listing_events for pre-trigger history.
Tax reassessment forecast MI · Partial reset (capped growth)
- Current annual tax
- $2,877 · $240/mo
- Projected year-2 tax
- $2,877 · $240/mo
- Expected delta
- $0/yr ($0/mo · 0.0%)
ⓘ Screening estimate from a state-policy table — verify with the county assessor before closing.
Climate risk First Street
- Flood 1/10 Low FEMA zone X (unshaded) · 0% chance over 30 yrs
- Wildfire 1/10 Low
- Heat 3/10 Moderate 7 d/yr ≥96°F today · 15 d/yr by 30 yrs out
- Wind 2/10 Low
- Air quality 3/10 Moderate 3 unhealthy d/yr today · 5 by 30 yrs out
Nearby sold comps map
Loading sold comps map…
Walkable amenities ~0.75 mi
Loading nearby amenities…
Taxation est. · year 1
- Rental income
- $17,734
- − Mortgage interest
- −$7,556
- − Property taxes
- −$2,877
- − Insurance
- −$674
- − Repairs & maintenance
- −$1,419
- − Management
- −$1,419
- − Depreciation
- −$3,924
- Taxable loss
- −$136
- Est. tax savings @ 24.0%
- +$33
- After-tax cash flow
- $2,002/yr
For passive investors: Depreciation is non-cash, so a rental often shows a tax loss while cash-flowing — sheltering income. Rental losses are passive: they offset passive income freely, and up to $25,000/yr can offset ordinary (W-2) income if you actively participate and your MAGI is under $100k (phasing out to $0 by $150k); unused losses carry forward. On sale, claimed depreciation is recaptured at up to 25%, and gains may owe capital-gains tax (a 1031 exchange can defer both). Figures are a year-1 estimate at your 24.0% rate — not tax advice; consult a CPA.
Schools (NCES district)
- District
- Lincoln Park School District
- NCES district ID
- 2621600
- Math proficiency
- 15% ▼ -5.00%
- Reading proficiency
- 32% ▬ 0.00%
- Median HH income
- $41,486
- Composite
- 19.93/100
- National rank
- #8678
- State rank
- #440 of 540 in MI
Livability — Lincoln Park
- Score
- 80/100
- State rank
- #82
- US rank
- #1720
Category grades
Schools grade is shown separately in the Schools card above.
Census & demographics
- Census place
- Lincoln Park, MI
- County
- Wayne County · 1,562,939 people
- City population
- 39,257
- Metro
- Detroit-Warren-Dearborn, MI
- Population (ZIP)
- 39,257
- Household income
- $58,616
- Rent vs Own
- Severe rent burden
- 1142.0
Population outlook (Wayne County) Hauer SSP2
- Today (2025)
- 1,675,273 people
- By 2030
- 1,620,300 · -3.3%
- By 2040
- 1,502,341 · -10.3%
- By 2050
- 1,384,039 · -17.4%
- By 2075
- 1,124,592 · -32.9%
- By 2100
- 881,193 · -47.4%
Race, ethnicity, and origin ACS 2023
- Neighborhood character
- Diverse neighborhood (Simpson 0.57)
- Race & ethnicity
- White 60% Hispanic / Latino 25% Two or more races 12% Black 9% Native American 1%
- Hispanic origin (detail)
- Mexican 19% Puerto Rican 3%
- Common ancestry
- Romanian 6% Lithuanian 4% Slovak 1%
- Foreign-born
- 9% · Canada
- Languages at home
- 80% English-only · Spanish 17% Arabic 2%
Political lean MEDSL · Wayne
- 2024 margin
- Strong D (+29.0) · D 62.7% · R 33.7% · Other 3.6%
- 2008→2024 swing
- -20.5pp toward R · 2008: 49.5pp · 2024: 29.0pp
- All cycles
- 2024: D+29.0 2020: D+38.1 2016: D+37.3 2012: D+46.9 2008: D+49.5
Not yet ingested
- Civics
- —
Market trends
- HPI YoY
- ▼ -108.25%
- Current HPI
- 222.8545
- Rent YoY
- ▲ 4.65%
- Metro
- Detroit-Warren-Dearborn, MI
- State GDP YoY
- ▲ 1.37%
- F500 in state
- 28
Industry mix (Fortune 500 HQ in MI)
| Industry | F500 HQs | Revenue |
|---|---|---|
| Automotive Parts | 3 | $48B |
|
||
| Automotive | 2 | $372B |
|
||
| Chemicals | 1 | $45B |
|
||
| Automotive Retail | 1 | $29B |
|
||
| Healthcare / Medical Devices | 1 | $23B |
|
||
| Automotive Technology | 1 | $20B |
|
||
Price history
+217.4% since first listed24 events — show timeline
- 2026-05-15 Pending — MiRealSource-MiMLS
- 2026-05-15 Pending — REALCOMP
- 2026-05-11 Listed $134,900 REALCOMP
- 2026-05-11 Listed $134,900 MiRealSource-MiMLS
- 2022-02-04 Sold (Public Records) $155,000 Public Records
- 2012-07-05 Listing Removed — REALCOMP
- 2012-07-05 Listing Removed — MiRealSource-MiMLS
- 2012-06-06 Sold (Public Records) $47,000 Public Records
- 2012-05-13 Sold (MLS) $47,000 REALCOMP
- 2012-01-07 Listed $49,000 REALCOMP
- 2012-01-07 Listed $49,000 REALCOMP
- 2012-01-07 Listed $49,000 MiRealSource-MiMLS
- 2009-11-25 Sold (MLS) $18,700 MiRealSource-MiMLS
- 2009-11-25 Sold (MLS) $18,700 REALCOMP
- 2009-11-04 Listing Removed — MiRealSource-MiMLS
- 2009-08-11 Listed $18,700 MiRealSource-MiMLS
- 2009-08-11 Listed $18,700 REALCOMP
- 2002-01-25 Sold (Public Records) $92,900 Public Records
- 2001-11-21 Sold (MLS) $92,900 MiRealSource-MiMLS
- 2001-11-21 Sold (MLS) $92,900 REALCOMP
- 2001-10-21 Listing Removed — MiRealSource-MiMLS
- 2001-10-14 Listed $89,900 REALCOMP
- 2001-10-13 Listed $89,900 MiRealSource-MiMLS
- 1998-09-29 Sold (Public Records) $42,500 Public Records
Property tax history
+6.8%/yrLatest (2025): $2,877 · -12.8% YoY. Source: county tax records.
Cash-flow waterfall
monthlySold comps — $/sqft
last 12 mo · ≤1 miLoading sold comps…