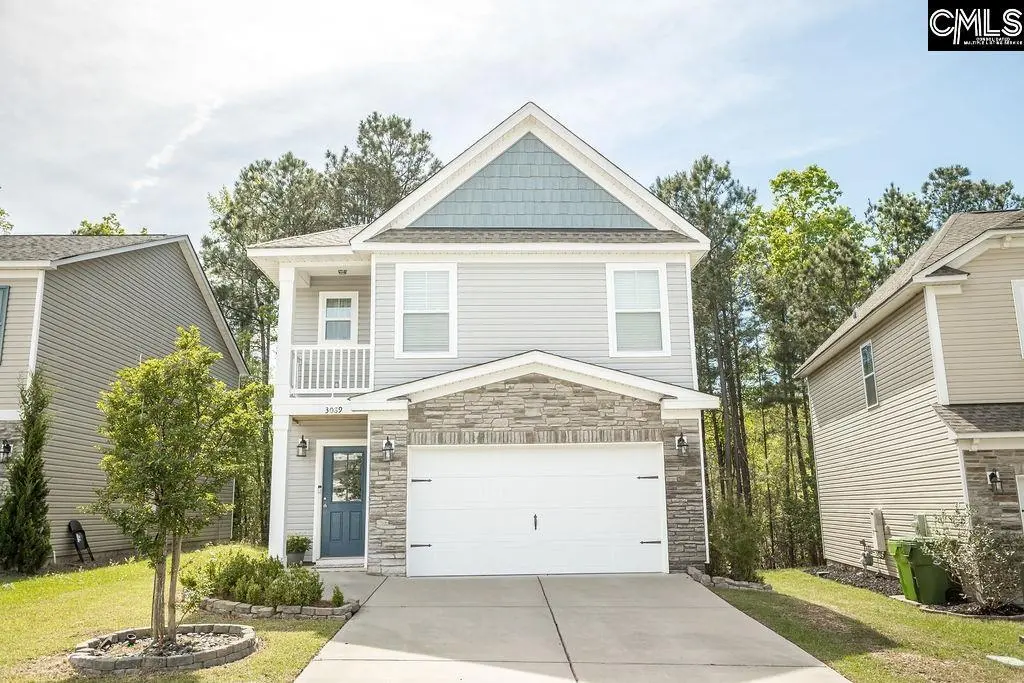
3089 Gedney Cir · Blythewood, SC
Flood risk 1/10 · Minimal
- FEMA flood zone
- X (unshaded)
- Chance of flooding over 30 yrs
- 0.0%
- Est. flood insurance / yr
- $507 – $1,088
Fire risk 3/10 · Minor
- Est. fire insurance / yr
- $783 – $1,453
Heat risk 6/10 · Moderate
- Hot days now (above 107°F)
- 7 days/yr
- Hot days in 30 yrs
- 16 days/yr
Wind risk 6/10 · Moderate
- Chance of severe wind over 30 yrs
- 61.0%
Air-quality risk 3/10 · Minor
- Unhealthy air days now
- 2 days/yr
- Unhealthy air days in 30 yrs
- 2 days/yr
Risk factors via First Street. Map © Google.
Why this score? — see what drove the C- grade
The composite is a weighted blend of 9 inputs, each scored 0–100. Each bar is that input's sub-score; the figure is the points it added to the 100-point composite (weight × sub-score).
- Cash flow +19.2/30.0
- ARV discount +10.2/15.0
- DSCR +6.0/10.0
- 1% rule +4.6/10.0
- Schools +3.6/10.0
- Livability +3.5/5.0
- Rent growth +2.5/5.0
- Condition / age +2.5/5.0
- Appreciation +0.0/10.0
$269,900
🖨 Deal sheet 📄 Offer letter ✓ Due diligence
Listing remarks
Open house Monday 6/8 2:30pm-4:30pm. Price Improvement! Don't miss this one! Looking for a home that gives you everyday convenience with a touch of privacy? This one delivers. Located in Blythewood Crossing and backing to a wooded common area, this 3-bedroom, 2.5-bath home offers a great blend of neighborhood living and a more peaceful backyard setting. The open layout on the main level makes everyday living easy and great for entertaining, with luxury vinyl plank floors, a cozy gas fireplace, and a kitchen that really is the heart of the home—complete with granite countertops, a large island, pantry, and an upgraded gas stove—perfect for anyone who loves to cook and gather. Ups
Key facts
- 3,920 sq ft lot
- 2 garage spots
- Built 2020
Property features AI
Finance
- HOA & community: Homeowners association present; association fees cover common area maintenance
Exterior
- Parking: Attached 2-car garage
- Utilities: Public water; Public sewer; Energy features: other (see remarks)
- Home design: Two-story single-family home; Partial brick above foundation with vinyl siding; Slab foundation
- Construction: Partial brick and vinyl exterior; Slab foundation
- Exterior features: Covered front porch; Deck; Rear privacy wood fence; Sprinkler system; Paved road access
Interior
- Kitchen: Island; Pantry; Granite countertops; Stained wood cabinets; Recessed lighting; Luxury vinyl plank flooring; Free-standing gas range; Microwave above stove; Dishwasher; Disposal; Refrigerator
- Bedrooms: Master bedroom (second floor) with private bath, separate shower, garden tub, double vanity, walk-in closet, balcony/deck; carpeted; Bedroom 2 (second floor) with private closet, shared bath; carpeted; Bedroom 3 (second floor) with private closet, shared bath; carpeted; Loft (second floor)
- Flooring: Carpet in bedrooms; Luxury vinyl plank in kitchen and great room
- Bathrooms: Two full bathrooms; One half bathroom; Two second full bathrooms
- Heating & cooling: Central heating; Central air conditioning
- Interior features: Ceiling fans throughout; Smoke detector; Attic access; Fireplace with natural gas log
- Laundry & utility: Washer and dryer included; Laundry closet on second floor; Tankless water heater
Neighborhood map
What this means for you Summary
Snapshot
- This is a 3-bed/3.0-bath single-family listed at $270k.
Deal economics
- At list price, monthly cash flow is $290 ($3k/yr) — positive.
- The deal already cash-flows at list — no discount required.
- To meet the 1% rule (rent ≥ 1% of price), the offer needs to be $260k (3.8% below list).
- Recommended offer: $254k (6.0% below list) — sets the bar for market timing.
Location & tenants
- Location reads 70/100 on livability (#58 in SC) — a middle-class / working-renter tenant base. Strengths: crime A+, employment A+, housing A+; Watch: amenities F, commute F, health & safety F.
- Richland 02 (suburban): math 35% / reading 47% proficiency, ranked #29 of 80 in SC (top 36%) — families likely to look elsewhere, expect single-tenant / working-renter base with shorter leases.
- Zoned schools: Langford Elementary (math 39% / reading 43%, grade F, #276 of 597 statewide, top 48%, 609 students, 64% FRL); Westwood High (math 47% / reading 87%, grade B, #73 of 196 statewide, top 41%, 1,684 students, 66% FRL) — zoned schools average 65% FRL vs 38% district-wide (26 pts higher); higher-poverty schools than district average — tighter screening recommended.
- Zoned-school proficiency averages 54% at this address vs 41% district-wide (+13 pts) — the actual schools serving this property are materially stronger than the Richland 02 average implies; a family-tenant draw the district grade alone would hide.
- Market conditions: 650 active listings in the ZIP; 2 comparable units currently listed for rent nearby; solid renter incomes; 3,472 units permitted in Richland County in 2024 (1,096 in 5+ unit buildings).
- This rent runs 33% of the median local income ($95k/yr) — at the standard rent-burdened threshold; future hikes will face affordability resistance.
Forward outlook
- Local home prices are declining (-3.0%/yr); year-one equity from $2k of loan paydown is wiped out by about $8k of value loss. Plan a longer hold.
- Richland County population projected at +30% by 2050 — long-run rental-demand tailwind backs the buy-and-hold thesis.
Negotiation context
- It's been on market 69 days — a 6% lower offer ($254k) is reasonable based on typical stale-listing flexibility.
- 3 sale attempts since 6y ago with the ask held roughly flat each time — persistent listings suggest the price (not the market) is what's stuck; bring a comps-based counter.
Risks & watch-outs
- Climate carrying-cost: major wind risk, 61% chance of damaging wind over 30y; extreme-heat days projected 7→16/yr by 2055 (HVAC capex compounding) — expect insurance premiums to compound above CPI over the hold.
Questions for the listing agent
- It's been on market 69 days. Have you received any prior offers? Is the seller open to a 6% concession, seller financing, or rate buy-down credit?
- What does the HOA fee cover, when was the last increase, and are there any pending special assessments or reserve-fund shortfalls?
- Why hasn't it sold? Are there any deal-killer items the seller is aware of (foundation, flood, title, zoning, code violations)?
- Is there a deadline driving the sale (1031 exchange, divorce, estate, relocation)? That informs how much negotiation room exists.
- Schools are B-rated — typically a magnet for longer-tenancy family renters. What's the average tenant stay here, and is there a school-zone premium baked into asking?
- What's the average days-on-market for RENTAL listings here right now (not sales)? A rising rental-DOM trend means longer vacancies and softer asking-rent achievability than the comps imply.
- What's the recent tenant-quality profile in this submarket — average credit score on applications, eviction rate, late-payment / NSF rate, and stable-employment percentage? A property-management company in the area should have these aggregated.
- How much new for-sale + rental construction is in the pipeline within 1–3 miles? Heavy new supply typically softens prices + rents 12–24 months out; constrained supply supports both.
Investment metrics
- 1% rule
- 0.96% ✗
- Cap rate
- 7.58%
- Cash-on-cash
- 4.60%
- DSCR
- 1.20
- GRM
- 8.7
CMA / ARV
- ARV (on-the-fly)
- $287,060
- Comps found
- 2
Show comp detail 2 sales within ~0.75 mi
| Address | Dist | Beds/Ba | Sqft | Sold | Price | $/sf | Match |
|---|---|---|---|---|---|---|---|
| 104 Potters View Rd | 0.21mi | 3/2.0 | 1,679 (-9%) | 13mo | $260,000 | $155 | 60 |
| 293 Hawkins Creek Rd | 0.45mi | 4/2.5 (+1) | 2,090 (+13%) | 5mo | $250,000 | $120 | 47 |
Match score weights: distance 35% · size 25% · config 20% · recency 20%. Top-matched comps best support the ARV.
Projected returns pro-forma
-3.0% appreciation · 3.0% rent growth · sell at horizon
- IRR
- -9.1%
- Equity multiple
- 0.67×
- Total profit
- $-25,316
- Equity at exit
- $40,243
- IRR
- 0.3%
- Equity multiple
- 1.02×
- Total profit
- $1,603
- Equity at exit
- $23,336
Cash invested: $75,572 (down + closing). Projections, not guarantees.
Landlord ↔ Tenant lean methodology
- Overall (STATE)
- 90 Strongly Landlord-Friendly
- State South Carolina
- 90 Strongly Landlord-Friendly · R+6
- County
- — inherits STATE
- City
- — inherits STATE
ZIP-level market 29016
- Home prices YoY
- -26.3%
- Active inventory
- 650
- Price-to-rent
- 8.7×
Monthly cashflow live
- Estimated rent
- $2,595 medium interval (Pro) →
- Mortgage (P&I)
- −$1,415
- Tax from tax record
- −$204 /mo · $2,448/yr
- Insurance
- −$112
- HOA
- −$29
- Vacancy / Maint / Mgmt
- −$545
- Net cashflow
- $290
Break-even live
UW: 25.0% down · 7.5% · 30yr · 1.5% tax · 5.0% vac · 8.0% maint · 8.0% mgmt
Financing live
Cash to close
- Down payment
- $67,475
- Closing costs
- $8,097
- Reserves months
- —
- Total cash needed
- —
Loan-product check · same deal, 3 products live
Conventional
25% down · 7.5% · 30yr
- Down + closing
- —
- Monthly P&I
- —
- Monthly cashflow
- —
- DSCR
- —
- Eligible?
- —
Personal DTI + credit; lowest rate.
DSCR
20% down · 8.5% · 30yr
- Down + closing
- —
- Monthly P&I
- —
- Monthly cashflow
- —
- DSCR
- —
- Eligible?
- —
No personal income docs; deal must DSCR.
Hard money
10% down · 12.0% · 12mo
- Down + closing
- —
- Monthly P&I
- —
- Monthly cashflow
- —
- DSCR
- —
- Eligible?
- —
Short-term bridge; refi at stabilization.
Rent comps 2 comps
| Address | Beds | Baths | Sqft | Rent | $/sqft | DOM | Units | Dist |
|---|---|---|---|---|---|---|---|---|
| 562 Vintage Pine Dr Blythewood, SC | 3.0 | 2.0 | 1814 | $2,195 | $1.21 | 23d | 1 | 0.59mi |
| 312 Joshua Tree Ct Blythewood, SC | 3.0 | 2.5 | 1731 | $1,945 | $1.12 | 23d | 1 | 0.69mi |
HOA detail
- Monthly dues
- $29 · $348/yr
- Likely covers
- gas
Listing history 24 events
-
2026-06-18days on market $269,900 Active 69 DOM
-
2026-06-17days on market $269,900 Active 68 DOM
-
2026-06-16days on market $269,900 Active 67 DOM
-
2026-06-15days on market $269,900 Active 66 DOM
-
2026-06-14days on market $269,900 Active 64 DOM
-
2026-06-13days on market $269,900 Active 63 DOM
-
2026-06-10days on market $269,900 Active 61 DOM
-
2026-06-09days on market $269,900 Active 60 DOM
-
2026-06-08remarks 687-char remark
-
2026-06-08days on market $269,900 Active 59 DOM
-
2026-06-07days on market $269,900 Active 58 DOM
-
2026-06-05days on market $269,900 Active 55 DOM
-
2026-06-03days on market $269,900 Active 54 DOM
-
2026-06-03days on market $269,900 Active 53 DOM
-
2026-06-01remarks 683-char remark
-
2026-06-01days on market $269,900 Active 52 DOM
-
2026-05-31days on market $269,900 Active 51 DOM
-
2026-05-01price $275,000
-
2026-04-10$280,000 Active
-
2022-06-04historical
-
2022-06-02$251,000 Active
-
2020-07-10historical
-
2020-06-18price $199,600
-
2020-05-11$197,130 Active
ⓘ Source: listings_history table (triggers on properties + properties_extension) + one-shot
backfill from property_details.listing_events for pre-trigger history.
Tax reassessment forecast SC · Resets to sale price
- Current annual tax
- $2,448 · $204/mo
- Projected year-2 tax
- $2,448 · $204/mo
- Expected delta
- $0/yr ($0/mo · 0.0%)
ⓘ Screening estimate from a state-policy table — verify with the county assessor before closing.
Climate risk First Street
- Flood 1/10 Low FEMA zone X (unshaded) · 0% chance over 30 yrs
- Wildfire 3/10 Moderate
- Heat 6/10 Major 7 d/yr ≥107°F today · 16 d/yr by 30 yrs out
- Wind 6/10 Major 61% chance of damaging wind over 30 yrs
- Air quality 3/10 Moderate 2 unhealthy d/yr today · 2 by 30 yrs out
Nearby sold comps map
Loading sold comps map…
Walkable amenities ~0.75 mi
Loading nearby amenities…
Taxation est. · year 1
- Rental income
- $31,146
- − Mortgage interest
- −$15,119
- − Property taxes
- −$2,448
- − Insurance
- −$1,350
- − Repairs & maintenance
- −$2,492
- − Management
- −$2,492
- − HOA
- −$348
- − Depreciation
- −$7,852
- Taxable loss
- −$953
- Est. tax savings @ 24.0%
- +$229
- After-tax cash flow
- $3,704/yr
For passive investors: Depreciation is non-cash, so a rental often shows a tax loss while cash-flowing — sheltering income. Rental losses are passive: they offset passive income freely, and up to $25,000/yr can offset ordinary (W-2) income if you actively participate and your MAGI is under $100k (phasing out to $0 by $150k); unused losses carry forward. On sale, claimed depreciation is recaptured at up to 25%, and gains may owe capital-gains tax (a 1031 exchange can defer both). Figures are a year-1 estimate at your 24.0% rate — not tax advice; consult a CPA.
Schools (NCES district)
- District
- Richland 02
- NCES district ID
- 4503390
- Math proficiency
- 35% ▼ -15.00%
- Reading proficiency
- 47% ▼ -5.00%
- Median HH income
- $59,684
- Composite
- 36.2/100
- National rank
- #4730
- State rank
- #29 of 80 in SC
Livability — Blythewood
- Score
- 70/100
- State rank
- #58
- US rank
- #7406
Category grades
Schools grade is shown separately in the Schools card above.
Census & demographics
- County
- Richland County · 389,530 people
- City population
- 30,454
- Metro
- Columbia, SC
- Population (ZIP)
- 30,454
- Household income
- $95,082
- Rent vs Own
- Severe rent burden
- 559.0
Population outlook (Richland County) Hauer SSP2
- Today (2025)
- 459,667 people
- By 2030
- 487,524 · +6.1%
- By 2040
- 542,035 · +17.9%
- By 2050
- 595,371 · +29.5%
- By 2075
- 732,998 · +59.5%
- By 2100
- 820,415 · +78.5%
Race, ethnicity, and origin ACS 2023
- Neighborhood character
- Diverse neighborhood (Simpson 0.64)
- Race & ethnicity
- Black 43% White 42% Two or more races 7% Hispanic / Latino 7% Asian 3%
- Hispanic origin (detail)
- Mexican 1% Puerto Rican 2%
- Common ancestry
- Lithuanian 2% Romanian 2% Slovak 2%
- Foreign-born
- 5% · Canada, China
- Languages at home
- 90% English-only · Spanish 5% Other Indo-European 1% German/W. Germanic 1%
Political lean MEDSL · Richland
- 2024 margin
- Solid D (+34.6) · D 66.4% · R 31.8% · Other 1.8%
- 2008→2024 swing
- +5.7pp toward D · 2008: 28.9pp · 2024: 34.6pp
- All cycles
- 2024: D+34.6 2020: D+38.3 2016: D+32.9 2012: D+33.3 2008: D+28.9
Not yet ingested
- Civics
- —
Market trends
- HPI YoY
- ▼ -65.48%
- Current HPI
- 183.5933
- Rent YoY
- —
- Metro
- Columbia, SC
- State GDP YoY
- ▲ 4.51%
- F500 in state
- 2
Industry mix (Fortune 500 HQ in SC)
| Industry | F500 HQs | Revenue |
|---|---|---|
| Packaging | 1 | $7B |
|
||
Price history
+39.5% since first listed7 events — show timeline
- 2026-05-01 Price Changed $275,000 Consolidated MLS
- 2026-04-10 Listed $280,000 Consolidated MLS
- 2022-06-04 Delisted — Consolidated MLS
- 2022-06-02 Listed $251,000 Consolidated MLS
- 2020-07-10 Delisted — Consolidated MLS
- 2020-06-18 Price Changed $199,600 Consolidated MLS
- 2020-05-11 Listed $197,130 Consolidated MLS
Property tax history
+35.0%/yrLatest (2025): $2,448 · +3.6% YoY. Source: county tax records.
Cash-flow waterfall
monthlySold comps — $/sqft
last 12 mo · ≤1 miLoading sold comps…