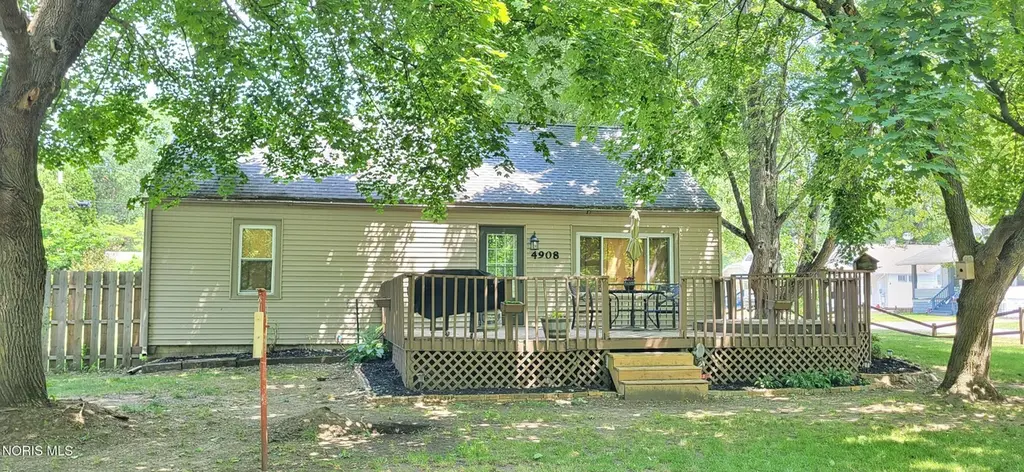
4908 Heather Pl · Sylvania, OH
Flood risk 1/10 · Minimal
- FEMA flood zone
- X (unshaded)
- Chance of flooding over 30 yrs
- 0.0%
- Est. flood insurance / yr
- $507 – $1,088
Fire risk 1/10 · Minimal
- Est. fire insurance / yr
- $713 – $1,323
Heat risk 3/10 · Minor
- Hot days now (above 100°F)
- 7 days/yr
- Hot days in 30 yrs
- 16 days/yr
Wind risk 2/10 · Minimal
- Chance of severe wind over 30 yrs
- —
Air-quality risk 2/10 · Minimal
- Unhealthy air days now
- 1 days/yr
- Unhealthy air days in 30 yrs
- 1 days/yr
Risk factors via First Street. Map © Google.
Why this score? — see what drove the D grade
The composite is a weighted blend of 9 inputs, each scored 0–100. Each bar is that input's sub-score; the figure is the points it added to the 100-point composite (weight × sub-score).
- Cash flow +16.5/30.0
- Schools +5.9/10.0
- DSCR +5.1/10.0
- Livability +4.4/5.0
- 1% rule +4.1/10.0
- Rent growth +2.5/5.0
- Condition / age +2.5/5.0
- ARV discount +0.0/15.0
- Appreciation +0.0/10.0
$219,000
🖨 Deal sheet (PDF) 📄 Offer letter ✓ Due diligence
Listing remarks MLS
CORPORATE LISTING! NEEDS TLC. CALL LISTER WHEN WRITING OFFERS.
Key facts
- Spacious backyard
- Granite countertops
- Expansive deck
Tags
Property features AI
Finance
- Other: Corner lot (approximately 0.31 acre)
Exterior
- Parking: Detached garage; Driveway; Gravel parking; On-street parking; Approximately 6 parking spaces (including garage with about 1.5 spaces)
- Utilities: Cable connected; Electricity connected; Natural gas connected; Well water; Septic sewer
- Home design: Single-family house; One and one-half story (2 total stories); Not attached; no common walls
- Construction: Vinyl siding; Shingle roof; Crawl space foundation; Built living area approximately 1,334
- Exterior features: Deck; Privacy fencing; Pergola
Interior
- Kitchen: Eat-in kitchen (11 x 19)
- Bedrooms: Bedroom 2 on the main level (11 x 11); Bedroom 3 on the upper level (11 x 15); Bedroom 4 on the upper level (10 x 19)
- Flooring: Carpet; Luxury vinyl
- Bathrooms: 1 full bathroom
- Heating & cooling: Forced air heating (natural gas); Window cooling units
- Interior features: Eat-in kitchen; Ceiling fan(s)
- Laundry & utility: Laundry on the main level
Neighborhood map
What this means for you Summary
Snapshot
- This is a 2-bed/1.0-bath single-family listed at $219k.
Deal economics
- At list price, monthly cash flow is $130 ($2k/yr) — positive.
- The deal already cash-flows at list — no discount required.
- To meet the 1% rule (rent ≥ 1% of price), the offer needs to be $200k (8.7% below list).
- Recommended offer: $200k (8.7% below list) — sets the bar for 1% rule.
- Cap rate 7.0% vs local median 2.8% in Sylvania — top-decile yield for the area; either an underpriced asset or a hidden risk that comps aren't pricing in. Stress-test before assuming the spread holds.
Location & tenants
- Location reads 88/100 on livability (#18 in OH, #191 nationally) — a professional / high-income tenant draw. Strengths: crime A+, employment A+, cost of living A+; Watch: amenities C-, commute F.
- Sylvania Schools (suburban): math 63% / reading 71% proficiency, ranked #157 of 656 in OH (top 24%) — acceptable for families but not a draw, mixed tenant base, ~2y average lease; only 18% free/reduced lunch — higher-income household profile.
- Zoned schools: Hill View Elementary School (math 67% / reading 73%, grade A-, #380 of 1,584 statewide, top 25%, 359 students, 32% FRL); Sylvania Northview High School (math 59% / reading 78%, grade B, #130 of 781 statewide, top 17%, 1,352 students, 20% FRL).
- Market conditions: 196 active listings in the ZIP; 3 comparable units currently listed for rent nearby; rentals at typical pace (median 25d on market — plan ~3-4 weeks tenant-placement turnaround); solid renter incomes; 415 units permitted in Lucas County in 2024 (122 in 5+ unit buildings).
Forward outlook
- Local home prices are declining (-3.0%/yr); year-one equity from $2k of loan paydown is wiped out by about $7k of value loss. Plan a longer hold.
- Lucas County population projected at -16% by 2050 — secular population decline; favor cash flow + early exit over multi-decade hold.
Negotiation context
- Only 12 days on market — expect competitive offers; lowballing is unlikely to land.
- 3 sale attempts since 23y ago; this cycle's ask is 37% above the opening price — seller raised mid-cycle; expect resistance to lowballs.
- Current owner paid $160k; 37% above their basis — modest negotiation headroom, anchor on the comps not their cost.
Risks & watch-outs
- Watch-outs: built in 1955 — expect roof / HVAC / electrical / plumbing capex.
Questions for the listing agent
- Built in 1955 — when were the roof, HVAC, electrical panel, plumbing, and water heater last replaced?
- Is there a deadline driving the sale (1031 exchange, divorce, estate, relocation)? That informs how much negotiation room exists.
- Schools are A-rated — typically a magnet for longer-tenancy family renters. What's the average tenant stay here, and is there a school-zone premium baked into asking?
- The area grade is low — what's the realistic commute time and amenity access for the typical tenant pool here? Any planned neighborhood developments (good or bad) we should know about?
- What's the average days-on-market for RENTAL listings here right now (not sales)? A rising rental-DOM trend means longer vacancies and softer asking-rent achievability than the comps imply.
- What's the recent tenant-quality profile in this submarket — average credit score on applications, eviction rate, late-payment / NSF rate, and stable-employment percentage? A property-management company in the area should have these aggregated.
- How much new for-sale + rental construction is in the pipeline within 1–3 miles? Heavy new supply typically softens prices + rents 12–24 months out; constrained supply supports both.
Investment metrics
- 1% rule
- 0.91% ✗
- Cap rate
- 7.00%
- Cash-on-cash
- 2.54%
- DSCR
- 1.11
- GRM
- 9.1
CMA / ARV
- ARV (on-the-fly)
- $180,090
- Comps found
- 8
Show comp detail 8 sales within ~0.75 mi
| Address | Dist | Beds/Ba | Sqft | Sold | Price | $/sf | Match |
|---|---|---|---|---|---|---|---|
| 5910 Whiteford Rd | 0.24mi | 3/1.0 (+1) | 1,428 (+7%) | 6mo | $172,000 | $120 | 67 |
| 4941 Gorham Pl | 0.08mi | 3/1.0 (+1) | 1,156 (-13%) | 5mo | $236,000 | $204 | 64 |
| 5736 Normandy Dr | 0.07mi | 3/2.0 (+1) | 1,518 (+14%) | 10mo | $230,000 | $152 | 57 |
| 5120 Janet Ave | 0.41mi | 3/2.0 (+1) | 1,316 (-1%) | 19mo | $168,000 | $128 | 54 |
| 5006 Argonne Pl | 0.08mi | 3/1.0 (+1) | 1,520 (+14%) | 21mo | $205,000 | $135 | 51 |
| 5728 Rudyard Rd | 0.73mi | 3/1.0 (+1) | 1,217 (-9%) | 11mo | $155,000 | $127 | 37 |
| 5036 Trellis Way | 0.73mi | 3/1.0 (+1) | 1,202 (-10%) | 11mo | $179,900 | $150 | 35 |
| 5822 Friedly Dr | 0.72mi | 3/1.5 (+1) | 1,523 (+14%) | 2mo | $152,775 | $100 | 34 |
Match score weights: distance 35% · size 25% · config 20% · recency 20%. Top-matched comps best support the ARV.
Projected returns pro-forma
-3.0% appreciation · 3.0% rent growth · sell at horizon
- IRR
- -12.3%
- Equity multiple
- 0.56×
- Total profit
- $-27,225
- Equity at exit
- $32,654
- IRR
- -3.2%
- Equity multiple
- 0.79×
- Total profit
- $-13,093
- Equity at exit
- $18,935
Cash invested: $61,320 (down + closing). Projections, not guarantees.
Landlord ↔ Tenant lean methodology
- Overall (STATE)
- 73 Landlord-Friendly
- State Ohio
- 73 Landlord-Friendly · R+6
- County
- — inherits STATE
- City
- — inherits STATE
ZIP-level market 43560
- Home prices YoY
- -31.7%
- Active inventory
- 196
- Price-to-rent
- 9.1×
Monthly cashflow live
- Estimated rent
- $2,000 medium interval (Pro) →
- Mortgage (P&I)
- −$1,148
- Tax from tax record
- −$210 /mo · $2,524/yr
- Insurance
- −$91
- HOA
- −$0
- Vacancy / Maint / Mgmt
- −$420
- Net cashflow
- $130
Break-even live
Sensitivity live
| Price | -10% $254 | -5% $192 | +0% $130 | +5% $68 | +10% $6 |
|---|---|---|---|---|---|
| Rent | -10% $-28 | -5% $51 | +0% $130 | +5% $209 | +10% $288 |
| Rate | -1.0pp $240 | -0.5pp $186 | base $130 | +0.5pp $73 | +1.0pp $15 |
UW: 25.0% down · 7.5% · 30yr · 1.5% tax · 5.0% vac · 8.0% maint · 8.0% mgmt
Financing live
Cash to close
- Down payment
- $54,750
- Closing costs
- $6,570
- Reserves months
- —
- Total cash needed
- —
Loan-product check · same deal, 3 products live
Conventional
25% down · 7.5% · 30yr
- Down + closing
- —
- Monthly P&I
- —
- Monthly cashflow
- —
- DSCR
- —
- Eligible?
- —
Personal DTI + credit; lowest rate.
DSCR
20% down · 8.5% · 30yr
- Down + closing
- —
- Monthly P&I
- —
- Monthly cashflow
- —
- DSCR
- —
- Eligible?
- —
No personal income docs; deal must DSCR.
Hard money
10% down · 12.0% · 12mo
- Down + closing
- —
- Monthly P&I
- —
- Monthly cashflow
- —
- DSCR
- —
- Eligible?
- —
Short-term bridge; refi at stabilization.
Rent comps 3 comps
| Address | Beds | Baths | Sqft | Rent | $/sqft | DOM | Units | Dist |
|---|---|---|---|---|---|---|---|---|
| 4828 Whiteford Rd Toledo, OH | 2.0 | 2.0 | 1157 | $1,947 | $1.68 | 45d | 1 | 1.15mi |
| 6022 Clover Ln Toledo, OH | 3.0 | 2.0 | 1296 | $1,750 | $1.35 | 22d | 1 | 1.21mi |
| 4842 Larkhaven Dr Toledo, OH | 3.0 | 3.0 | 1594 | $2,400 | $1.51 | 25d | 1 | 1.28mi |
Listing history 9 events
-
2026-06-21days on market $219,000 Coming Soon 12 DOM
-
2026-06-18days on market $219,000 Coming Soon 9 DOM
-
2026-06-17days on market $219,000 Coming Soon 8 DOM
-
2026-06-16days on market $219,000 Coming Soon 7 DOM
-
2026-06-15days on market $219,000 Coming Soon 6 DOM
-
2026-06-14days on market $219,000 Coming Soon 4 DOM
-
2026-06-13days on market $219,000 Coming Soon 3 DOM
-
2026-06-10remarks 693-char remark
-
2026-06-10$219,000 Coming Soon 1 DOM
ⓘ Source: listings_history table (triggers on properties + properties_extension) + one-shot
backfill from property_details.listing_events for pre-trigger history.
Tax reassessment forecast OH · Partial reset (capped growth)
- Current annual tax
- $2,524 · $210/mo
- Projected year-2 tax
- $2,970 · $248/mo
- Expected delta
- +$446/yr (+$37/mo · 17.7%)
ⓘ Screening estimate from a state-policy table — verify with the county assessor before closing.
Climate risk First Street
- Flood 1/10 Low FEMA zone X (unshaded) · 0% chance over 30 yrs
- Wildfire 1/10 Low
- Heat 3/10 Moderate 7 d/yr ≥100°F today · 16 d/yr by 30 yrs out
- Wind 2/10 Low
- Air quality 2/10 Low 1 unhealthy d/yr today · 1 by 30 yrs out
Nearby sold comps map
Loading sold comps map…
Walkable amenities ~0.75 mi
Loading nearby amenities…
Taxation est. · year 1
- Rental income
- $23,999
- − Mortgage interest
- −$12,267
- − Property taxes
- −$2,524
- − Insurance
- −$1,095
- − Repairs & maintenance
- −$1,920
- − Management
- −$1,920
- − Depreciation
- −$6,371
- Taxable loss
- −$2,099
- Est. tax savings @ 24.0%
- +$504
- After-tax cash flow
- $2,062/yr
For passive investors: Depreciation is non-cash, so a rental often shows a tax loss while cash-flowing — sheltering income. Rental losses are passive: they offset passive income freely, and up to $25,000/yr can offset ordinary (W-2) income if you actively participate and your MAGI is under $100k (phasing out to $0 by $150k); unused losses carry forward. On sale, claimed depreciation is recaptured at up to 25%, and gains may owe capital-gains tax (a 1031 exchange can defer both). Figures are a year-1 estimate at your 24.0% rate — not tax advice; consult a CPA.
Schools (NCES district)
- District
- Sylvania Schools
- NCES district ID
- 3904487
- Math proficiency
- 63% ▼ -12.00%
- Reading proficiency
- 71% ▼ -6.00%
- Median HH income
- $71,949
- Composite
- 58.95/100
- National rank
- #967
- State rank
- #157 of 656 in OH
Livability — Sylvania
- Score
- 88/100
- State rank
- #18
- US rank
- #191
Category grades
Schools grade is shown separately in the Schools card above.
Census & demographics
- County
- Lucas County · 380,724 people
- City population
- 33,286
- Metro
- Toledo, OH
- Population (ZIP)
- 33,286
- Household income
- $109,486
- Rent vs Own
- Severe rent burden
- 355.0
Population outlook (Lucas County) Hauer SSP2
- Today (2025)
- 420,751 people
- By 2030
- 410,187 · -2.5%
- By 2040
- 384,019 · -8.7%
- By 2050
- 355,125 · -15.6%
- By 2075
- 291,683 · -30.7%
- By 2100
- 233,670 · -44.5%
Race, ethnicity, and origin ACS 2023
- Neighborhood character
- Predominantly White (86%)
- Race & ethnicity
- White 86% Two or more races 4% Asian 4% Hispanic / Latino 3% Black 3%
- Common ancestry
- Romanian 10% Lithuanian 4% Slovak 2%
- Foreign-born
- 6% · China, Canada
- Languages at home
- 92% English-only · Other Indo-European 2% Arabic 2% Spanish 1%
Political lean MEDSL · Lucas
- 2024 margin
- D (+12.6) · D 55.8% · R 43.2%
- 2008→2024 swing
- -18.9pp toward R · 2008: 31.4pp · 2024: 12.6pp
- All cycles
- 2024: D+12.6 2020: D+16.8 2016: D+17.4 2012: D+30.4 2008: D+31.4
Not yet ingested
- Civics
- —
Market trends
- HPI YoY
- ▼ -99.73%
- Current HPI
- 215.2986
- Rent YoY
- —
- Metro
- Toledo, OH
- State GDP YoY
- ▲ 1.98%
- F500 in state
- 48
Industry mix (Fortune 500 HQ in OH)
| Industry | F500 HQs | Revenue |
|---|---|---|
| Insurance | 3 | $145B |
|
||
| Industrial Machinery | 3 | $49B |
|
||
| Financial Services | 3 | $24B |
|
||
| Consumer Goods | 2 | $93B |
|
||
| Aerospace / Defense | 2 | $47B |
|
||
| Utilities | 2 | $33B |
|
||
Price history
+242.2% since first listed14 events — show timeline
- 2026-06-10 Coming Soon $219,000 NORIS
- 2025-10-14 Price Changed $84,900 NORIS
- 2021-09-17 Sold (Public Records) $159,900 Public Records
- 2021-09-13 Sold (MLS) $159,900 NORIS
- 2021-08-04 Contingent — NORIS
- 2021-07-29 Listed $159,900 NORIS
- 2021-07-27 Coming Soon $159,900 NORIS
- 2004-09-03 Listing Removed — NORIS
- 2004-03-30 Listed $114,900 NORIS
- 2003-09-09 Sold (Public Records) $84,900 Public Records
- 2003-09-09 Sold (Public Records) $60,000 Public Records
- 2003-09-05 Sold (MLS) $84,900 NORIS
- 2003-05-02 Listed $89,900 NORIS
- 1997-06-19 Sold (Public Records) $64,000 Public Records
Property tax history
+1.7%/yrLatest (2025): $2,524 · +3.4% YoY. Source: county tax records.
Cash-flow waterfall
monthlySold comps — $/sqft
last 12 mo · ≤1 miLoading sold comps…