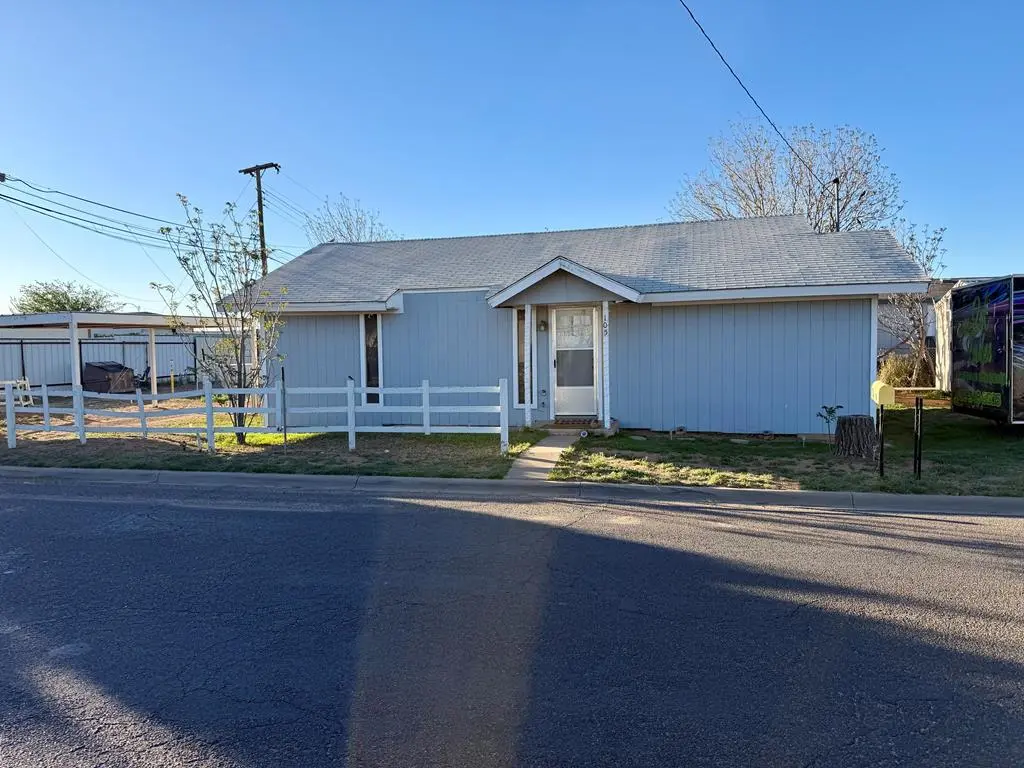
105 Carolyn Dr · Odessa, TX
Flood risk 1/10 · Minimal
- FEMA flood zone
- A
- Chance of flooding over 30 yrs
- 0.0%
- Est. flood insurance / yr
- $1,009 – $1,996
Fire risk 3/10 · Minor
- Est. fire insurance / yr
- $1,222 – $2,270
Heat risk 6/10 · Moderate
- Hot days now (above 101°F)
- 7 days/yr
- Hot days in 30 yrs
- 21 days/yr
Wind risk 2/10 · Minimal
- Chance of severe wind over 30 yrs
- 3.0%
Air-quality risk 1/10 · Minimal
- Unhealthy air days now
- 0 days/yr
- Unhealthy air days in 30 yrs
- 0 days/yr
Risk factors via First Street. Map © Google.
Why this score? — see what drove the D+ grade
The composite is a weighted blend of 9 inputs, each scored 0–100. Each bar is that input's sub-score; the figure is the points it added to the 100-point composite (weight × sub-score).
- Cash flow +24.3/30.0
- DSCR +7.8/10.0
- 1% rule +5.4/10.0
- Livability +3.8/5.0
- Rent growth +2.5/5.0
- Condition / age +2.5/5.0
- Schools +2.2/10.0
- ARV discount +0.0/15.0
- Appreciation +0.0/10.0
$145,000
🖨 Deal sheet (PDF) 📄 Offer letter ✓ Due diligence
Listing remarks MLS
Income-producing investment opportunity! This updated 2 bedroom, 1 bathroom home offers modern finishes including updated flooring, fresh paint, and a bright kitchen with ample cabinetry and counter space. The property is currently generating income and also includes an RV space beside the home that is rented, creating an additional revenue stream. Situated on a spacious lot with carport parking and easy access to nearby roads, this property is a great option for investors.
Key facts
- Bright kitchen
- Fresh paint
- Ample cabinetry
Tags
Neighborhood map
What this means for you Summary
Snapshot
- This is a 2-bed/1.0-bath single-family listed at $145k.
Deal economics
- At list price, monthly cash flow is $166 ($2k/yr) — positive.
- The deal already cash-flows at list — no discount required.
- Meets the 1% rule at list price ($2k rent vs $145k).
- Recommended offer: $132k (9.0% below list) — sets the bar for market timing.
Location & tenants
- Location reads 75/100 on livability (#132 in TX, #3,928 nationally) — a middle-class / working-renter tenant base. Strengths: cost of living A+, housing A+, health & safety A+; Watch: commute D+, amenities D.
- Ector County ISD (urban): math 22% / reading 27% proficiency, ranked #707 of 826 in TX (top 86%) — low school quality limits family demand, transient renter base, plan for 1-2y turnover.
- Zoned schools: Burleson El (math 17% / reading 16%, grade F, #3,946 of 4,322 statewide, top 92%, 413 students, 89% FRL); Bowie Middle (math 11% / reading 21%, grade F, #1,543 of 1,662 statewide, top 94%, 914 students, 74% FRL); Odessa H S (math 18% / reading 22%, grade F, #1,397 of 1,632 statewide, top 87%, 3,874 students, 68% FRL) — zoned schools average 77% FRL vs 56% district-wide (21 pts higher); higher-poverty schools than district average — tighter screening recommended.
- Market conditions: 110 active listings in the ZIP; 9 comparable units currently listed for rent nearby; rentals lingering (median 46d on market — plan ~5-8 weeks vacancy on turnover, expect pricing pressure); 56% of comp listings sitting > 30 days — soft ceiling on asking rent; 1,004 units permitted in Ector County in 2024 (0 in 5+ unit buildings).
Forward outlook
- Local home prices are declining (-3.0%/yr); year-one equity from $1k of loan paydown is wiped out by about $4k of value loss. Plan a longer hold.
- Ector County population projected at +78% by 2050 — long-run rental-demand tailwind backs the buy-and-hold thesis.
Negotiation context
- It's been on market 92 days — a 9% lower offer ($132k) is reasonable based on typical stale-listing flexibility.
Risks & watch-outs
- Watch-outs: flood insurance adds $125/mo; built in 1948 — expect roof / HVAC / electrical / plumbing capex.
- Climate carrying-cost: in FEMA flood zone A (mandatory federal flood insurance); extreme-heat days projected 7→21/yr by 2055 (HVAC capex compounding) — expect insurance premiums to compound above CPI over the hold.
Questions for the listing agent
- It's been on market 92 days. Have you received any prior offers? Is the seller open to a 9% concession, seller financing, or rate buy-down credit?
- Built in 1948 — when were the roof, HVAC, electrical panel, plumbing, and water heater last replaced?
- What's the actual annual flood-insurance premium (NFIP or private), and is the property in a SFHA with mandatory coverage?
- Why hasn't it sold? Are there any deal-killer items the seller is aware of (foundation, flood, title, zoning, code violations)?
- Is there a deadline driving the sale (1031 exchange, divorce, estate, relocation)? That informs how much negotiation room exists.
- Schools are F-rated, which usually means shorter tenancies and higher turnover. Who's the typical renter profile here, and what's been the actual vacancy rate?
- The area grade is low — what's the realistic commute time and amenity access for the typical tenant pool here? Any planned neighborhood developments (good or bad) we should know about?
- What's the average days-on-market for RENTAL listings here right now (not sales)? A rising rental-DOM trend means longer vacancies and softer asking-rent achievability than the comps imply.
- What's the recent tenant-quality profile in this submarket — average credit score on applications, eviction rate, late-payment / NSF rate, and stable-employment percentage? A property-management company in the area should have these aggregated.
- How much new for-sale + rental construction is in the pipeline within 1–3 miles? Heavy new supply typically softens prices + rents 12–24 months out; constrained supply supports both.
Investment metrics
- 1% rule
- 1.04% ✓
- Cap rate
- 8.70%
- Cash-on-cash
- 8.61%
- DSCR
- 1.38
- GRM
- 8.0
CMA / ARV
- ARV (median comp)
- $97,697
- List price
- $145,000
- Delta
- 48.42%
- Verdict
- OVERPRICED
- Comps
- 8 within 2.0 mi
Show comp detail 1 sale within ~0.75 mi
| Address | Dist | Beds/Ba | Sqft | Sold | Price | $/sf | Match |
|---|---|---|---|---|---|---|---|
| 2519 Adams Ave | 0.73mi | 3/1.0 (+1) | 1,026 (+8%) | 20mo | $175,000 | $171 | 31 |
Match score weights: distance 35% · size 25% · config 20% · recency 20%. Top-matched comps best support the ARV.
Projected returns pro-forma
-3.0% appreciation · 3.0% rent growth · sell at horizon
- IRR
- -8.6%
- Equity multiple
- 0.68×
- Total profit
- $-12,889
- Equity at exit
- $21,620
- IRR
- 0.9%
- Equity multiple
- 1.06×
- Total profit
- $2,544
- Equity at exit
- $12,537
Cash invested: $40,600 (down + closing). Projections, not guarantees.
Landlord ↔ Tenant lean methodology
- Overall (STATE)
- 87 Strongly Landlord-Friendly
- State Texas
- 87 Strongly Landlord-Friendly · R+5
- County
- — inherits STATE
- City
- — inherits STATE
ZIP-level market 79764
- Home prices YoY
- -28.0%
- Active inventory
- 110
- Price-to-rent
- 8.0×
Monthly cashflow live
- Estimated rent
- $1,512 high interval (Pro) →
- Mortgage (P&I)
- −$760
- Tax from tax record
- −$83 /mo · $995/yr
- Insurance
- −$60
- Flood insurance flood zone
- −$125 /mo · $1,502/yr
- HOA
- −$0
- Vacancy / Maint / Mgmt
- −$318
- Net cashflow
- $166
Break-even live
Sensitivity live
| Price | -10% $248 | -5% $207 | +0% $166 | +5% $125 | +10% $84 |
|---|---|---|---|---|---|
| Rent | -10% $46 | -5% $106 | +0% $166 | +5% $226 | +10% $285 |
| Rate | -1.0pp $239 | -0.5pp $203 | base $166 | +0.5pp $128 | +1.0pp $90 |
UW: 25.0% down · 7.5% · 30yr · 1.5% tax · 5.0% vac · 8.0% maint · 8.0% mgmt
Financing live
Cash to close
- Down payment
- $36,250
- Closing costs
- $4,350
- Reserves months
- —
- Total cash needed
- —
Loan-product check · same deal, 3 products live
Conventional
25% down · 7.5% · 30yr
- Down + closing
- —
- Monthly P&I
- —
- Monthly cashflow
- —
- DSCR
- —
- Eligible?
- —
Personal DTI + credit; lowest rate.
DSCR
20% down · 8.5% · 30yr
- Down + closing
- —
- Monthly P&I
- —
- Monthly cashflow
- —
- DSCR
- —
- Eligible?
- —
No personal income docs; deal must DSCR.
Hard money
10% down · 12.0% · 12mo
- Down + closing
- —
- Monthly P&I
- —
- Monthly cashflow
- —
- DSCR
- —
- Eligible?
- —
Short-term bridge; refi at stabilization.
Rent comps 9 comps
| Address | Beds | Baths | Sqft | Rent | $/sqft | DOM | Units | Dist |
|---|---|---|---|---|---|---|---|---|
| 3727 Andrews Hwy Odessa, TX | 1.0–2.0 | 1.0–2.0 | 800 | $1,350 | $1.69 | 15d | 18 | 0.25mi |
| 3800 N Golder Ave Odessa, TX | 3.0 | 2.0 | 1050 | $1,600 | $1.52 | 23d | 1 | 0.28mi |
| 4312 N Dixie Blvd Unit 72C Odessa, TX | 2.0 | 2.0 | 980 | $1,450 | $1.48 | 45d | 1 | 0.88mi |
| 1202 E 42nd St Odessa, TX | 3.0 | 1.0 | 1100 | $1,650 | $1.50 | 45d | 1 | 0.94mi |
| 1909 N Hancock Ave Odessa, TX | 2.0 | 1.0 | 672 | $1,600 | $2.38 | 45d | 1 | 1.04mi |
| 803 E 18th St Odessa, TX | 1.0 | 1.0 | 675 | $1,200 | $1.78 | 15d | 1 | 1.16mi |
| 1409 E 23rd St Odessa, TX | 2.0 | 1.0 | 1032 | $2,400 | $2.33 | 45d | 1 | 1.26mi |
| 1501 N Texas Ave Unit A Odessa, TX | 2.0 | 1.0 | 925 | $1,450 | $1.57 | 15d | 1 | 1.35mi |
| 1101 W 19th St Unit 1 Odessa, TX | 1.0 | 1.0 | 700 | $1,000 | $1.43 | 45d | 1 | 1.44mi |
Listing history 23 events
-
2026-06-21days on market $145,000 Active 92 DOM
-
2026-06-19days on market $145,000 Active 90 DOM
-
2026-06-18days on market $145,000 Active 89 DOM
-
2026-06-17days on market $145,000 Active 88 DOM
-
2026-06-16days on market $145,000 Active 87 DOM
-
2026-06-15days on market $145,000 Active 86 DOM
-
2026-06-14days on market $145,000 Active 84 DOM
-
2026-06-13days on market $145,000 Active 83 DOM
-
2026-06-10days on market $145,000 Active 81 DOM
-
2026-06-09days on market $145,000 Active 80 DOM
-
2026-06-08days on market $145,000 Active 79 DOM
-
2026-06-07days on market $145,000 Active 78 DOM
-
2026-06-03days on market $145,000 Active 73 DOM
-
2026-06-01days on market $145,000 Active 72 DOM
-
2026-05-31days on market $145,000 Active 71 DOM
-
2026-05-30days on market $145,000 Active 70 DOM
-
2026-05-18price $145,000 478-char remark
Show marketing remark (478 chars)
Income-producing investment opportunity! This updated 2 bedroom, 1 bathroom home offers modern finishes including updated flooring, fresh paint, and a bright kitchen with ample cabinetry and counter space. The property is currently generating income and also includes an RV space beside the home that is rented, creating an additional revenue stream. Situated on a spacious lot with carport parking and easy access to nearby roads, this property is a great option for investors.
-
2026-03-21$150,000 Active 478-char remark
Show marketing remark (478 chars)
Income-producing investment opportunity! This updated 2 bedroom, 1 bathroom home offers modern finishes including updated flooring, fresh paint, and a bright kitchen with ample cabinetry and counter space. The property is currently generating income and also includes an RV space beside the home that is rented, creating an additional revenue stream. Situated on a spacious lot with carport parking and easy access to nearby roads, this property is a great option for investors.
-
2025-10-04price $129,900
-
2025-08-19price $139,900
-
2025-08-14price $149,900
-
2024-12-27soldstatus
-
2011-07-25soldstatus
ⓘ Source: listings_history table (triggers on properties + properties_extension) + one-shot
backfill from property_details.listing_events for pre-trigger history.
Tax reassessment forecast TX · Resets to sale price
- Current annual tax
- $995 · $83/mo
- Projected year-2 tax
- $2,654 · $221/mo
- Expected delta
- +$1,659/yr (+$138/mo · 166.8%)
ⓘ Screening estimate from a state-policy table — verify with the county assessor before closing.
Climate risk First Street
- Flood 1/10 Low FEMA zone A · 0% chance over 30 yrs
- Wildfire 3/10 Moderate
- Heat 6/10 Major 7 d/yr ≥101°F today · 21 d/yr by 30 yrs out
- Wind 2/10 Low 3% chance of damaging wind over 30 yrs
- Air quality 1/10 Low 0 unhealthy d/yr today · 0 by 30 yrs out
Nearby sold comps map
Loading sold comps map…
Walkable amenities ~0.75 mi
Loading nearby amenities…
Taxation est. · year 1
- Rental income
- $18,150
- − Mortgage interest
- −$8,122
- − Property taxes
- −$995
- − Insurance
- −$2,228
- − Repairs & maintenance
- −$1,452
- − Management
- −$1,452
- − Depreciation
- −$4,218
- Taxable loss
- −$317
- Est. tax savings @ 24.0%
- +$76
- After-tax cash flow
- $2,067/yr
For passive investors: Depreciation is non-cash, so a rental often shows a tax loss while cash-flowing — sheltering income. Rental losses are passive: they offset passive income freely, and up to $25,000/yr can offset ordinary (W-2) income if you actively participate and your MAGI is under $100k (phasing out to $0 by $150k); unused losses carry forward. On sale, claimed depreciation is recaptured at up to 25%, and gains may owe capital-gains tax (a 1031 exchange can defer both). Figures are a year-1 estimate at your 24.0% rate — not tax advice; consult a CPA.
Schools (NCES district)
- District
- Ector County ISD
- NCES district ID
- 4818000
- Math proficiency
- 22% ▼ -9.00%
- Reading proficiency
- 27% ▼ -4.00%
- Median HH income
- $52,740
- Composite
- 21.89/100
- National rank
- #8233
- State rank
- #707 of 826 in TX
Livability — Odessa
- Score
- 75/100
- State rank
- #132
- US rank
- #3928
Category grades
Schools grade is shown separately in the Schools card above.
Census & demographics
- Census place
- Odessa, TX
- City population
- 131,169
- Population (ZIP)
- 26,805
Population outlook (Ector County) Hauer SSP2
- Today (2025)
- 212,765 people
- By 2030
- 241,962 · +13.7%
- By 2040
- 306,582 · +44.1%
- By 2050
- 379,755 · +78.5%
- By 2075
- 568,991 · +167.4%
- By 2100
- 709,829 · +233.6%
Race, ethnicity, and origin ACS 2023
- Neighborhood character
- Majority Hispanic (59%)
- Race & ethnicity
- Hispanic / Latino 59% White 37% Two or more races 17% Black 3% Asian 1%
- Hispanic origin (detail)
- Mexican 54%
- Common ancestry
- Slovak 1%
- Foreign-born
- 20% · Canada, Vietnam
- Languages at home
- 54% English-only · Spanish 45% Vietnamese 1%
Political lean MEDSL · Ector
- 2024 margin
- Solid R (+52.9) · D 23.2% · R 76.1%
- 2008→2024 swing
- -4.9pp toward R · 2008: -48.0pp · 2024: -52.9pp
- All cycles
- 2024: R+52.9 2020: R+47.8 2016: R+40.6 2012: R+48.9 2008: R+48.0
Not yet ingested
- Civics
- —
Market trends
- HPI YoY
- ▼ -92.67%
- Current HPI
- 238.7065
- Rent YoY
- —
- Metro
- —
- State GDP YoY
- ▲ 3.95%
- F500 in state
- 110
Industry mix (Fortune 500 HQ in TX)
| Industry | F500 HQs | Revenue |
|---|---|---|
| Energy | 16 | $1,198B |
|
||
| Technology | 5 | $198B |
|
||
| Engineering / Construction | 4 | $72B |
|
||
| Energy Services | 3 | $60B |
|
||
| Utilities | 3 | $41B |
|
||
| Healthcare | 2 | $330B |
|
||
Price history
-3.3% since first listed7 events — show timeline
- 2026-05-18 Price Changed $145,000 ODMLS
- 2026-03-21 Listed $150,000 ODMLS
- 2025-10-04 Price Changed $129,900 ODMLS
- 2025-08-19 Price Changed $139,900 ODMLS
- 2025-08-14 Price Changed $149,900 ODMLS
- 2024-12-27 Sold (Public Records) — Public Records
- 2011-07-25 Sold (Public Records) — Public Records
Property tax history
+3.1%/yrLatest (2025): $995 · +907.5% YoY. Source: county tax records.
Cash-flow waterfall
monthlySold comps — $/sqft
last 12 mo · ≤1 miLoading sold comps…