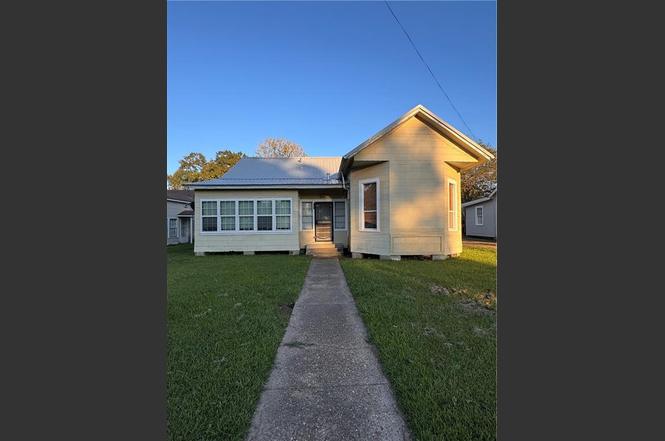
501 & 503 S Lexington Ave · Bunkie, LA
Flood risk 1/10 · Minimal
- FEMA flood zone
- X
- Chance of flooding over 30 yrs
- 0.0%
- Est. flood insurance / yr
- $507 – $1,088
Fire risk 1/10 · Minimal
- Est. fire insurance / yr
- $1,269 – $2,357
Heat risk 8/10 · Major
- Hot days now (above 111°F)
- 7 days/yr
- Hot days in 30 yrs
- 19 days/yr
Wind risk 8/10 · Major
- Chance of severe wind over 30 yrs
- 99.0%
Air-quality risk 1/10 · Minimal
- Unhealthy air days now
- 0 days/yr
- Unhealthy air days in 30 yrs
- 0 days/yr
Risk factors via First Street. Map © Google.
Why this score? — see what drove the C grade
The composite is a weighted blend of 9 inputs, each scored 0–100. Each bar is that input's sub-score; the figure is the points it added to the 100-point composite (weight × sub-score).
- Cash flow +23.8/30.0
- DSCR +7.7/10.0
- ARV discount +7.5/15.0
- Appreciation +6.0/10.0
- 1% rule +4.9/10.0
- Livability +3.0/5.0
- Rent growth +2.5/5.0
- Condition / age +2.5/5.0
- Schools +2.1/10.0
$135,000
🖨 Deal sheet 📄 Offer letter ✓ Due diligence
Listing remarks
Prime opportunity for someone looking to enter the residential rental business. These two well-kept homes are on the market and priced to sell. No improvements needed. They are ready for tenants. Roof on both homes are only 16 months old. Great condition and great location. Schedule your showing today.
Key facts
- 0.26 acre lot
- Built 1970
- Listed 202 days
Property features AI
Exterior
- Home design: Single family residence
- Construction: Wood siding construction; Composition and metal roof
- Exterior features: Wood siding; Composition and metal roofing
Interior
- Bathrooms: 2 full bathrooms; 2 half bathrooms
- Heating & cooling: Has heating (type listed as Other); Window Unit(s) for cooling
- Interior features: Window cooling units
Neighborhood map
What this means for you Summary
Snapshot
- This is a 6-bed/3.0-bath single-family listed at $135k.
Deal economics
- At list price, monthly cash flow is $259 ($3k/yr) — positive.
- The deal already cash-flows at list — no discount required.
- To meet the 1% rule (rent ≥ 1% of price), the offer needs to be $134k (0.7% below list).
- Recommended offer: $119k (12.0% below list) — sets the bar for market timing.
Location & tenants
- Location reads 59/100 on livability (#267 in LA) — a working-class tenant base; expect higher turnover. Strengths: cost of living A+, housing B+; Watch: schools C-, health & safety C-, amenities F.
- Avoyelles Parish (rural): math 22% / reading 30% proficiency, ranked #56 of 98 in LA (top 57%) — low school quality limits family demand, transient renter base, plan for 1-2y turnover; 75% free/reduced lunch — lower-income household profile, screen leases tightly.
- Market conditions: 23 active listings in the ZIP; 15 units permitted in Avoyelles Parish in 2024 (0 in 5+ unit buildings).
Forward outlook
- In year one you build about $4k of equity ($933 loan paydown + $3k appreciation (1.9% local appreciation)).
- Avoyelles County population projected at -18% by 2050 — secular population decline; favor cash flow + early exit over multi-decade hold.
- At projected returns (1.9% appreciation + 3.0% rent growth), your $38k cash investment doubles in ~5 years — after that, you're playing with house money.
- By year 9, paydown + projected appreciation supports a ~$31k cash-out refi (75% LTV) — recoverable capital for the next deal without selling this one.
Negotiation context
- It's been on market 202 days — a 12% lower offer ($119k) is reasonable based on typical stale-listing flexibility.
- 2 sale attempts since 2y ago with the ask held roughly flat each time — persistent listings suggest the price (not the market) is what's stuck; bring a comps-based counter.
- Current owner paid $85k; list at $135k implies a 59% gain — meaningful room to come down on a strong offer.
Risks & watch-outs
- Climate carrying-cost: severe wind risk, 99% chance of damaging wind over 30y; extreme-heat days projected 7→19/yr by 2055 (HVAC capex compounding) — expect insurance premiums to compound above CPI over the hold.
Questions for the listing agent
- It's been on market 202 days. Have you received any prior offers? Is the seller open to a 12% concession, seller financing, or rate buy-down credit?
- Built in 1970 — when were the roof, HVAC, electrical panel, plumbing, and water heater last replaced?
- Why hasn't it sold? Are there any deal-killer items the seller is aware of (foundation, flood, title, zoning, code violations)?
- Is there a deadline driving the sale (1031 exchange, divorce, estate, relocation)? That informs how much negotiation room exists.
- What's the average days-on-market for RENTAL listings here right now (not sales)? A rising rental-DOM trend means longer vacancies and softer asking-rent achievability than the comps imply.
- What's the recent tenant-quality profile in this submarket — average credit score on applications, eviction rate, late-payment / NSF rate, and stable-employment percentage? A property-management company in the area should have these aggregated.
- How much new for-sale + rental construction is in the pipeline within 1–3 miles? Heavy new supply typically softens prices + rents 12–24 months out; constrained supply supports both.
Investment metrics
- 1% rule
- 0.99% ✗
- Cap rate
- 8.60%
- Cash-on-cash
- 8.22%
- DSCR
- 1.37
- GRM
- 8.4
CMA / ARV
No comps found within radius.
Projected returns pro-forma
1.94% appreciation · 3.0% rent growth · sell at horizon
- IRR
- 12.4%
- Equity multiple
- 1.67×
- Total profit
- $25,262
- Equity at exit
- $52,787
- IRR
- 15.2%
- Equity multiple
- 3.02×
- Total profit
- $76,414
- Equity at exit
- $75,663
Cash invested: $37,800 (down + closing). Projections, not guarantees.
Landlord ↔ Tenant lean methodology
- Overall (STATE)
- 90 Strongly Landlord-Friendly
- State Louisiana
- 90 Strongly Landlord-Friendly · R+12
- County
- — inherits STATE
- City
- — inherits STATE
ZIP-level market 71322
- Home prices YoY
- 2.4%
- Active inventory
- 23
- Price-to-rent
- 8.4×
Monthly cashflow live
- Estimated rent
- $1,341 medium interval (Pro) →
- Mortgage (P&I)
- −$708
- Tax from tax record
- −$36 /mo · $432/yr
- Insurance
- −$56
- HOA
- −$0
- Vacancy / Maint / Mgmt
- −$282
- Net cashflow
- $259
Break-even live
UW: 25.0% down · 7.5% · 30yr · 1.5% tax · 5.0% vac · 8.0% maint · 8.0% mgmt
Financing live
Cash to close
- Down payment
- $33,750
- Closing costs
- $4,050
- Reserves months
- —
- Total cash needed
- —
Loan-product check · same deal, 3 products live
Conventional
25% down · 7.5% · 30yr
- Down + closing
- —
- Monthly P&I
- —
- Monthly cashflow
- —
- DSCR
- —
- Eligible?
- —
Personal DTI + credit; lowest rate.
DSCR
20% down · 8.5% · 30yr
- Down + closing
- —
- Monthly P&I
- —
- Monthly cashflow
- —
- DSCR
- —
- Eligible?
- —
No personal income docs; deal must DSCR.
Hard money
10% down · 12.0% · 12mo
- Down + closing
- —
- Monthly P&I
- —
- Monthly cashflow
- —
- DSCR
- —
- Eligible?
- —
Short-term bridge; refi at stabilization.
Listing history 23 events
-
2026-06-19days on market $135,000 Active 202 DOM
-
2026-06-18days on market $135,000 Active 201 DOM
-
2026-06-17days on market $135,000 Active 200 DOM
-
2026-06-16days on market $135,000 Active 199 DOM
-
2026-06-15days on market $135,000 Active 198 DOM
-
2026-06-14days on market $135,000 Active 196 DOM
-
2026-06-13days on market $135,000 Active 195 DOM
-
2026-06-10days on market $135,000 Active 193 DOM
-
2026-06-09days on market $135,000 Active 192 DOM
-
2026-06-08days on market $135,000 Active 191 DOM
-
2026-06-07days on market $135,000 Active 190 DOM
-
2026-06-03days on market $135,000 Active 186 DOM
-
2026-06-02days on market $135,000 Active 185 DOM
-
2026-06-01days on market $135,000 Active 184 DOM
-
2026-05-31days on market $135,000 Active 183 DOM
-
2026-05-30days on market $135,000 Active 182 DOM
-
2025-11-14$135,000 Active
-
2024-07-01soldstatus $85,000
-
2024-03-21$125,000
-
2020-09-10soldstatus $55,000
-
2012-07-27soldstatus $27,500
-
2004-02-18soldstatus
-
2004-02-18soldstatus
ⓘ Source: listings_history table (triggers on properties + properties_extension) + one-shot
backfill from property_details.listing_events for pre-trigger history.
Tax reassessment forecast LA · Resets to sale price
- Current annual tax
- $432 · $36/mo
- Projected year-2 tax
- $742 · $62/mo
- Expected delta
- +$311/yr (+$26/mo · 72.1%)
ⓘ Screening estimate from a state-policy table — verify with the county assessor before closing.
Climate risk First Street
- Flood 1/10 Low FEMA zone X · 0% chance over 30 yrs
- Wildfire 1/10 Low
- Heat 8/10 Severe 7 d/yr ≥111°F today · 19 d/yr by 30 yrs out
- Wind 8/10 Severe 99% chance of damaging wind over 30 yrs
- Air quality 1/10 Low 0 unhealthy d/yr today · 0 by 30 yrs out
Nearby sold comps map
Loading sold comps map…
Walkable amenities ~0.75 mi
Loading nearby amenities…
Taxation est. · year 1
- Rental income
- $16,090
- − Mortgage interest
- −$7,562
- − Property taxes
- −$432
- − Insurance
- −$675
- − Repairs & maintenance
- −$1,287
- − Management
- −$1,287
- − Depreciation
- −$3,927
- Taxable income
- $919
- Est. tax owed @ 24.0%
- −$221
- After-tax cash flow
- $2,888/yr
For passive investors: Depreciation is non-cash, so a rental often shows a tax loss while cash-flowing — sheltering income. Rental losses are passive: they offset passive income freely, and up to $25,000/yr can offset ordinary (W-2) income if you actively participate and your MAGI is under $100k (phasing out to $0 by $150k); unused losses carry forward. On sale, claimed depreciation is recaptured at up to 25%, and gains may owe capital-gains tax (a 1031 exchange can defer both). Figures are a year-1 estimate at your 24.0% rate — not tax advice; consult a CPA.
Schools (NCES district)
- District
- Avoyelles Parish
- NCES district ID
- 2200150
- Math proficiency
- 22% ▼ -32.00%
- Reading proficiency
- 30% ▼ -29.00%
- Median HH income
- $33,891
- Composite
- 21.32/100
- National rank
- #8378
- State rank
- #56 of 98 in LA
Livability — Bunkie
- Score
- 59/100
- State rank
- #267
- US rank
- #19665
Category grades
Schools grade is shown separately in the Schools card above.
Census & demographics
- Census place
- Bunkie, LA
- Population (ZIP)
- 5,257
Population outlook (Avoyelles County) Hauer SSP2
- Today (2025)
- 39,084 people
- By 2030
- 37,784 · -3.3%
- By 2040
- 35,049 · -10.3%
- By 2050
- 32,225 · -17.5%
- By 2075
- 25,695 · -34.3%
- By 2100
- 18,985 · -51.4%
Race, ethnicity, and origin ACS 2023
- Neighborhood character
- Diverse neighborhood (Simpson 0.55)
- Race & ethnicity
- Black 51% White 43% Two or more races 4% Hispanic / Latino 2%
- Common ancestry
- Lithuanian 10% Slovak 2% Italian 1%
- Foreign-born
- 1% · Canada
- Languages at home
- 95% English-only · Spanish 3% French/Haitian/Cajun 2%
Political lean MEDSL · Avoyelles
- 2024 margin
- Solid R (+43.1) · D 27.8% · R 71.0% · Other 1.2%
- 2008→2024 swing
- -20.1pp toward R · 2008: -23.1pp · 2024: -43.1pp
- All cycles
- 2024: R+43.1 2020: R+40.8 2016: R+37.0 2012: R+27.0 2008: R+23.1
Not yet ingested
- Civics
- —
Market trends
- HPI YoY
- ▲ 1.94%
- Current HPI
- 82.0658
- Rent YoY
- —
- Metro
- —
- State GDP YoY
- ▲ 3.29%
- F500 in state
- 10
Industry mix (Fortune 500 HQ in LA)
| Industry | F500 HQs | Revenue |
|---|---|---|
| Telecommunications | 2 | $23B |
|
||
| Utilities | 1 | $12B |
|
||
| Wholesale / Distribution | 1 | $5B |
|
||
| Advertising | 1 | $2B |
|
||
Price history
+390.9% since first listed7 events — show timeline
- 2025-11-14 Listed $135,000 AcadianaMLS
- 2024-07-01 Sold (Public Records) $85,000 Public Records
- 2024-03-21 Listed $125,000 AcadianaMLS
- 2020-09-10 Sold (Public Records) $55,000 Public Records
- 2012-07-27 Sold (Public Records) $27,500 Public Records
- 2004-02-18 Sold (Public Records) — Public Records
- 2004-02-18 Sold (Public Records) — Public Records
Property tax history
+2.2%/yrLatest (2025): $432 · +0.0% YoY. Source: county tax records.
Cash-flow waterfall
monthlySold comps — $/sqft
last 12 mo · ≤1 miLoading sold comps…