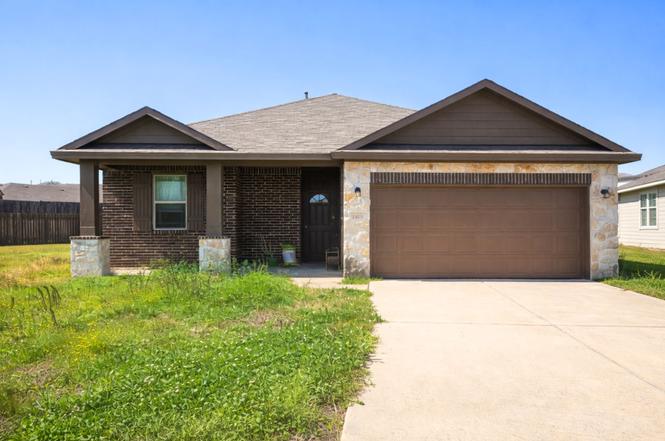
14101 Kamilia Rd · Cut and Shoot, TX
Flood risk 1/10 · Minimal
- FEMA flood zone
- X (unshaded)
- Chance of flooding over 30 yrs
- 0.0%
- Est. flood insurance / yr
- $507 – $1,088
Fire risk 6/10 · Moderate
- Est. fire insurance / yr
- $1,222 – $2,270
Heat risk 8/10 · Major
- Hot days now (above 111°F)
- 7 days/yr
- Hot days in 30 yrs
- 25 days/yr
Wind risk 9/10 · Severe
- Chance of severe wind over 30 yrs
- 99.0%
Air-quality risk 2/10 · Minimal
- Unhealthy air days now
- 2 days/yr
- Unhealthy air days in 30 yrs
- 2 days/yr
Risk factors via First Street. Map © Google.
Why this score? — see what drove the B- grade
The composite is a weighted blend of 9 inputs, each scored 0–100. Each bar is that input's sub-score; the figure is the points it added to the 100-point composite (weight × sub-score).
- Cash flow +23.4/30.0
- ARV discount +15.0/15.0
- DSCR +7.5/10.0
- 1% rule +7.4/10.0
- Schools +5.1/10.0
- Livability +2.8/5.0
- Rent growth +2.5/5.0
- Condition / age +2.5/5.0
- Appreciation +0.0/10.0
$170,000
🖨 Deal sheet 📄 Offer letter ✓ Due diligence
Listing remarks
Welcome to 14101 Kamilia Road, a charming home in the peaceful Conroe area. This stunning home features a modern layout with comfortable living spaces, perfect for families or anyone seeking a relaxed lifestyle. Enjoy the convenience of being close to outdoor activities at Lake Conroe, along with nearby parks and trails for year-round recreation. Located within the Conroe Independent School District, this home offers easy access to great schools and a welcoming community atmosphere. With nearby amenities, including shopping, dining, and entertainment, everything you need is just minutes away. The well-maintained neighborhood enhances your quality of life, offering peace of mind and long-ter
Key facts
- Nearby amenities
- Modern layout
- 0.27 acre lot
Tags
Neighborhood map
What this means for you Summary
Snapshot
- This is a 3-bed/2.0-bath single-family listed at $170k.
Deal economics
- At list price, monthly cash flow is $313 ($4k/yr) — positive.
- The deal already cash-flows at list — no discount required.
- Meets the 1% rule at list price ($2k rent vs $170k).
- Recommended offer: $167k (1.5% below list) — sets the bar for market timing.
- Cap rate 8.5% vs local median 4.8% in Cut and Shoot — top-decile yield for the area; either an underpriced asset or a hidden risk that comps aren't pricing in. Stress-test before assuming the spread holds.
Location & tenants
- Location reads 56/100 on livability (#1,326 in TX) — a working-class tenant base; expect higher turnover. Strengths: cost of living A+, housing A+; Watch: crime D-, amenities F, commute F.
- Conroe ISD (other): math 57% / reading 57% proficiency, ranked #69 of 826 in TX (top 8%) — acceptable for families but not a draw, mixed tenant base, ~2y average lease.
- Zoned schools: Caney Creek H S (math 33% / reading 42%, grade F, #888 of 1,632 statewide, top 55%, 2,504 students, 79% FRL) — zoned schools average 79% FRL vs 34% district-wide (45 pts higher); higher-poverty schools than district average — tighter screening recommended.
- Zoned-school proficiency averages 38% at this address vs 57% district-wide (-20 pts) — the specific schools serving this property underperform the Conroe ISD average; the district grade overstates school quality for this exact location.
- Market conditions: 414 active listings in the ZIP; 3 comparable units currently listed for rent nearby; rentals lingering (median 44d on market — plan ~5-8 weeks vacancy on turnover, expect pricing pressure); 67% of comp listings sitting > 30 days — soft ceiling on asking rent; solid renter incomes; 13,259 units permitted in Montgomery County in 2024 (1,402 in 5+ unit buildings).
- This rent runs 33% of the median local income ($76k/yr) — at the standard rent-burdened threshold; future hikes will face affordability resistance.
Forward outlook
- Local home prices are declining (-3.0%/yr); year-one equity from $1k of loan paydown is wiped out by about $5k of value loss. Plan a longer hold.
- Montgomery County population projected at +65% by 2050 — long-run rental-demand tailwind backs the buy-and-hold thesis.
Negotiation context
- It's been on market 18 days — a 2% lower offer ($167k) is reasonable based on typical stale-listing flexibility.
- 2 sale attempts with the ask held roughly flat each time — persistent listings suggest the price (not the market) is what's stuck; bring a comps-based counter.
Risks & watch-outs
- Watch-outs: property tax is 2.6% of price.
- Climate carrying-cost: severe wind risk, 99% chance of damaging wind over 30y; major wildfire risk; extreme-heat days projected 7→25/yr by 2055 (HVAC capex compounding) — expect insurance premiums to compound above CPI over the hold.
Questions for the listing agent
- Property tax is high relative to price — has the assessment been appealed recently, and will the sale trigger a re-assessment?
- What does the HOA fee cover, when was the last increase, and are there any pending special assessments or reserve-fund shortfalls?
- Is there a deadline driving the sale (1031 exchange, divorce, estate, relocation)? That informs how much negotiation room exists.
- Schools are F-rated, which usually means shorter tenancies and higher turnover. Who's the typical renter profile here, and what's been the actual vacancy rate?
- Crime grade is D in this area — have there been break-ins, vandalism, or insurance claims at this property in the last 3 years? What carrier currently insures it and at what premium?
- What's the average days-on-market for RENTAL listings here right now (not sales)? A rising rental-DOM trend means longer vacancies and softer asking-rent achievability than the comps imply.
- What's the recent tenant-quality profile in this submarket — average credit score on applications, eviction rate, late-payment / NSF rate, and stable-employment percentage? A property-management company in the area should have these aggregated.
- How much new for-sale + rental construction is in the pipeline within 1–3 miles? Heavy new supply typically softens prices + rents 12–24 months out; constrained supply supports both.
Investment metrics
- 1% rule
- 1.24% ✓
- Cap rate
- 8.50%
- Cash-on-cash
- 7.89%
- DSCR
- 1.35
- GRM
- 6.7
CMA / ARV
- ARV (on-the-fly)
- $266,000
- Comps found
- 12
Show comp detail 12 sales within ~0.75 mi
| Address | Dist | Beds/Ba | Sqft | Sold | Price | $/sf | Match |
|---|---|---|---|---|---|---|---|
| 3579 Korina Way | 0.08mi | 3/2.0 | 1,604 (-8%) | 0mo | $235,000 | $147 | 82 |
| 855 Waukegan Rd | 0.51mi | 4/2.0 (+1) | 1,691 (-3%) | 2mo | $279,990 | $166 | 64 |
| 14749 S Ascot Bend Cir | 0.46mi | 3/2.0 | 1,560 (-11%) | 3mo | $249,967 | $160 | 58 |
| 2702 Pheasant Hill Ct | 0.49mi | 3/2.0 | 1,560 (-11%) | 3mo | $238,386 | $153 | 56 |
| 14744 S Ascot Bend Cir | 0.46mi | 4/2.0 (+1) | 1,535 (-12%) | 3mo | $241,065 | $157 | 51 |
| 14892 North Ascot Bend Cir | 0.57mi | 4/2.0 (+1) | 1,607 (-8%) | 7mo | $247,990 | $154 | 49 |
| 14881 North Ascot Bend Cir | 0.60mi | 4/2.0 (+1) | 1,607 (-8%) | 7mo | $243,990 | $152 | 47 |
| 14861 North Ascot Bend Cir | 0.63mi | 4/2.0 (+1) | 1,607 (-8%) | 7mo | $243,990 | $152 | 46 |
| 14708 South Ascot Bend Cir | 0.51mi | 4/2.5 (+1) | 1,979 (+13%) | 2mo | $256,990 | $130 | 46 |
| 14880 North Ascot Bend Cir | 0.59mi | 4/2.5 (+1) | 1,979 (+13%) | 7mo | $255,990 | $129 | 38 |
| 14860 North Ascot Bend Cir | 0.61mi | 4/2.5 (+1) | 1,979 (+13%) | 7mo | $255,990 | $129 | 37 |
| 14869 North Ascot Bend Cir | 0.62mi | 4/2.5 (+1) | 1,979 (+13%) | 7mo | $255,990 | $129 | 36 |
Match score weights: distance 35% · size 25% · config 20% · recency 20%. Top-matched comps best support the ARV.
Projected returns pro-forma
-3.0% appreciation · 3.0% rent growth · sell at horizon
- IRR
- -4.2%
- Equity multiple
- 0.84×
- Total profit
- $-7,474
- Equity at exit
- $25,348
- IRR
- 5.6%
- Equity multiple
- 1.41×
- Total profit
- $19,725
- Equity at exit
- $14,698
Cash invested: $47,600 (down + closing). Projections, not guarantees.
Landlord ↔ Tenant lean methodology
- Overall (STATE)
- 87 Strongly Landlord-Friendly
- State Texas
- 87 Strongly Landlord-Friendly · R+5
- County
- — inherits STATE
- City
- — inherits STATE
ZIP-level market 77306
- Home prices YoY
- -4.1%
- Active inventory
- 414
- Price-to-rent
- 6.7×
Monthly cashflow live
- Estimated rent
- $2,104 medium interval (Pro) →
- Mortgage (P&I)
- −$891
- Tax from tax record
- −$362 /mo · $4,345/yr
- Insurance
- −$71
- HOA
- −$25
- Vacancy / Maint / Mgmt
- −$442
- Net cashflow
- $313
Break-even live
UW: 25.0% down · 7.5% · 30yr · 1.5% tax · 5.0% vac · 8.0% maint · 8.0% mgmt
Financing live
Cash to close
- Down payment
- $42,500
- Closing costs
- $5,100
- Reserves months
- —
- Total cash needed
- —
Loan-product check · same deal, 3 products live
Conventional
25% down · 7.5% · 30yr
- Down + closing
- —
- Monthly P&I
- —
- Monthly cashflow
- —
- DSCR
- —
- Eligible?
- —
Personal DTI + credit; lowest rate.
DSCR
20% down · 8.5% · 30yr
- Down + closing
- —
- Monthly P&I
- —
- Monthly cashflow
- —
- DSCR
- —
- Eligible?
- —
No personal income docs; deal must DSCR.
Hard money
10% down · 12.0% · 12mo
- Down + closing
- —
- Monthly P&I
- —
- Monthly cashflow
- —
- DSCR
- —
- Eligible?
- —
Short-term bridge; refi at stabilization.
Rent comps 3 comps
| Address | Beds | Baths | Sqft | Rent | $/sqft | DOM | Units | Dist |
|---|---|---|---|---|---|---|---|---|
| 15141 Meadow Gln S Conroe, TX | 3.0 | 3.0 | 1864 | $1,961 | $1.05 | 22d | 1 | 0.39mi |
| 14990 N Ascot Bend Cir Conroe, TX | 4.0 | 2.0 | 1607 | $2,400 | $1.49 | 43d | 1 | 0.44mi |
| 14918 N Ascot Bend Cir Conroe, TX | 4.0 | 2.5 | 1979 | $1,955 | $0.99 | 43d | 1 | 0.50mi |
HOA detail
- Monthly dues
- $25 · $300/yr
Listing history 6 events
-
2026-05-08status Pending
-
2026-04-28status Pending
-
2026-04-22status Active
-
2026-03-02status Pending
-
2026-02-27$170,000 Active
-
2020-06-30soldstatus
ⓘ Source: listings_history table (triggers on properties + properties_extension) + one-shot
backfill from property_details.listing_events for pre-trigger history.
Tax reassessment forecast TX · Resets to sale price
- Current annual tax
- $4,345 · $362/mo
- Projected year-2 tax
- $4,345 · $362/mo
- Expected delta
- $0/yr ($0/mo · 0.0%)
ⓘ Screening estimate from a state-policy table — verify with the county assessor before closing.
Climate risk First Street
- Flood 1/10 Low FEMA zone X (unshaded) · 0% chance over 30 yrs
- Wildfire 6/10 Major
- Heat 8/10 Severe 7 d/yr ≥111°F today · 25 d/yr by 30 yrs out
- Wind 9/10 Extreme 99% chance of damaging wind over 30 yrs
- Air quality 2/10 Low 2 unhealthy d/yr today · 2 by 30 yrs out
Nearby sold comps map
Loading sold comps map…
Walkable amenities ~0.75 mi
Loading nearby amenities…
Taxation est. · year 1
- Rental income
- $25,252
- − Mortgage interest
- −$9,523
- − Property taxes
- −$4,345
- − Insurance
- −$850
- − Repairs & maintenance
- −$2,020
- − Management
- −$2,020
- − HOA
- −$300
- − Depreciation
- −$4,945
- Taxable income
- $1,248
- Est. tax owed @ 24.0%
- −$300
- After-tax cash flow
- $3,456/yr
For passive investors: Depreciation is non-cash, so a rental often shows a tax loss while cash-flowing — sheltering income. Rental losses are passive: they offset passive income freely, and up to $25,000/yr can offset ordinary (W-2) income if you actively participate and your MAGI is under $100k (phasing out to $0 by $150k); unused losses carry forward. On sale, claimed depreciation is recaptured at up to 25%, and gains may owe capital-gains tax (a 1031 exchange can defer both). Figures are a year-1 estimate at your 24.0% rate — not tax advice; consult a CPA.
Schools (NCES district)
- District
- Conroe ISD
- NCES district ID
- 4815000
- Math proficiency
- 57% ▼ -6.00%
- Reading proficiency
- 57% ▼ -1.00%
- Median HH income
- $71,541
- Composite
- 50.65/100
- National rank
- #1833
- State rank
- #69 of 826 in TX
Livability — Cut and Shoot
- Score
- 56/100
- State rank
- #1326
- US rank
- #22835
Category grades
Schools grade is shown separately in the Schools card above.
Census & demographics
- County
- Montgomery County · 663,713 people
- Metro
- Houston-The Woodlands-Sugar Land, TX
- Population (ZIP)
- 18,086
- Household income
- $76,257
- Rent vs Own
- Severe rent burden
- 231.0
Population outlook (Montgomery County) Hauer SSP2
- Today (2025)
- 713,896 people
- By 2030
- 805,263 · +12.8%
- By 2040
- 992,708 · +39.1%
- By 2050
- 1,179,590 · +65.2%
- By 2075
- 1,628,084 · +128.1%
- By 2100
- 1,937,880 · +171.5%
Race, ethnicity, and origin ACS 2023
- Neighborhood character
- Majority Hispanic (55%)
- Race & ethnicity
- Hispanic / Latino 55% White 41% Two or more races 11% Black 2%
- Hispanic origin (detail)
- Mexican 51%
- Common ancestry
- Iranian 1% Slovak 1% Lithuanian 1%
- Foreign-born
- 21% · Canada
- Languages at home
- 53% English-only · Spanish 45% German/W. Germanic 1%
Political lean MEDSL · Montgomery
- 2024 margin
- Solid R (+45.5) · D 26.8% · R 72.3%
- 2008→2024 swing
- +7.2pp toward D · 2008: -52.7pp · 2024: -45.5pp
- All cycles
- 2024: R+45.5 2020: R+43.8 2016: R+51.4 2012: R+60.7 2008: R+52.7
Not yet ingested
- Civics
- —
Market trends
- HPI YoY
- ▼ -13.02%
- Current HPI
- 306.3801
- Rent YoY
- —
- Metro
- Houston-The Woodlands-Sugar Land, TX
- State GDP YoY
- ▲ 3.95%
- F500 in state
- 110
Industry mix (Fortune 500 HQ in TX)
| Industry | F500 HQs | Revenue |
|---|---|---|
| Energy | 16 | $1,198B |
|
||
| Technology | 5 | $198B |
|
||
| Engineering / Construction | 4 | $72B |
|
||
| Energy Services | 3 | $60B |
|
||
| Utilities | 3 | $41B |
|
||
| Healthcare | 2 | $330B |
|
||
Price history
6 events — show timeline
- 2026-05-08 Pending — HARMLS
- 2026-04-28 Pending — HARMLS
- 2026-04-22 Relisted — HARMLS
- 2026-03-02 Pending — HARMLS
- 2026-02-27 Listed $170,000 HARMLS
- 2020-06-30 Sold (Public Records) — Public Records
Property tax history
+73.4%/yrLatest (2025): $4,345 · -6.4% YoY. Source: county tax records.
Cash-flow waterfall
monthlySold comps — $/sqft
last 12 mo · ≤1 miLoading sold comps…