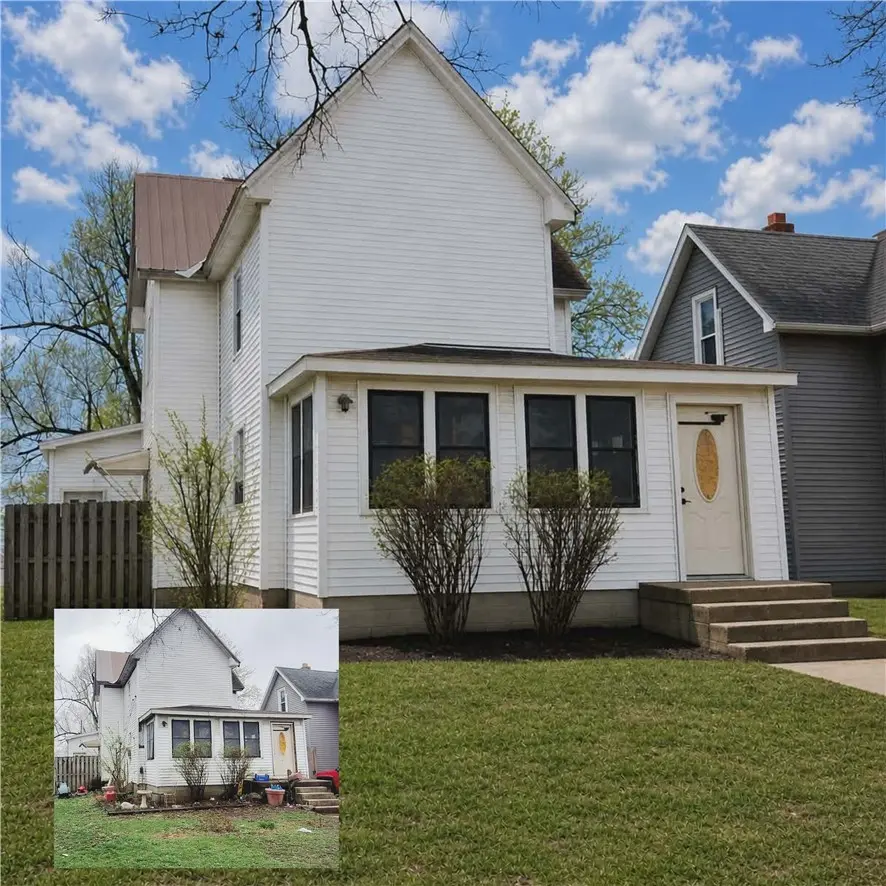
619 E Chestnut St · Hoopeston, IL
Flood risk 1/10 · Minimal
- FEMA flood zone
- X (unshaded)
- Chance of flooding over 30 yrs
- 0.0%
- Est. flood insurance / yr
- $473 – $860
Fire risk 1/10 · Minimal
- Est. fire insurance / yr
- $804 – $1,492
Heat risk 3/10 · Minor
- Hot days now (above 103°F)
- 7 days/yr
- Hot days in 30 yrs
- 18 days/yr
Wind risk 2/10 · Minimal
- Chance of severe wind over 30 yrs
- 1.0%
Air-quality risk 2/10 · Minimal
- Unhealthy air days now
- 1 days/yr
- Unhealthy air days in 30 yrs
- 1 days/yr
Risk factors via First Street. Map © Google.
Why this score? — see what drove the D+ grade
The composite is a weighted blend of 9 inputs, each scored 0–100. Each bar is that input's sub-score; the figure is the points it added to the 100-point composite (weight × sub-score).
- Cash flow +15.0/30.0
- ARV discount +7.5/15.0
- Appreciation +6.4/10.0
- 1% rule +5.0/10.0
- DSCR +5.0/10.0
- Livability +2.9/5.0
- Rent growth +2.5/5.0
- Condition / age +2.5/5.0
- Schools +1.0/10.0
$24,700
🖨 Deal sheet 📄 Offer letter ✓ Due diligence
Listing remarks
Located in the heart of Hoopeston, this spacious fixer-upper offers incredible potential for investors, flippers, or buyers looking to create their dream home. Featuring 4 bedrooms with a bonus room that could serve as a 5th bedroom, office, or hobby space, this property provides flexibility and room to grow. The home also includes a full basement offering additional storage. Outside, you’ll find a large fenced-in yard with plenty of space for pets, entertaining, or outdoor activities. This photo was virtually enhanced. With solid square footage and endless possibilities, this property is ready for someone with vision to bring it back to life. Whether you’re searching for your n
Key facts
- 0.31 acre lot
- Built 1920
- Listed 38 days
Property features AI
Exterior
- Utilities: Public water; Public sewer
- Home design: Single-family residence; Two-story
- Construction: Vinyl siding; Metal/other roof
- Exterior features: Front porch; Fenced yard; Gravel road access
Interior
- Kitchen: Oven
- Bathrooms: 1 full bathroom
- Heating & cooling: Natural gas heating; Window AC unit(s)
- Interior features: Gas water heater; Oven; Unfinished full basement
- Laundry & utility: Laundry on main level
Neighborhood map
What this means for you Summary
Snapshot
- This is a 4-bed/1.5-bath single-family listed at $25k.
Deal economics
- At list price, monthly cash flow is $935 ($11k/yr) — positive.
- The deal already cash-flows at list — no discount required.
- Meets the 1% rule at list price ($1k rent vs $25k).
- Recommended offer: $24k (3.0% below list) — sets the bar for market timing.
- Cap rate 51.7% vs local median 7.1% in Hoopeston — top-decile yield for the area; either an underpriced asset or a hidden risk that comps aren't pricing in. Stress-test before assuming the spread holds.
Location & tenants
- Location reads 57/100 on livability (#1,152 in IL) — a working-class tenant base; expect higher turnover. Strengths: cost of living A+, housing B+; Watch: crime D+, schools F, amenities F.
- Hoopeston Area CUSD 11 (town): math 9% / reading 15% proficiency, ranked #559 of 620 in IL (top 90%) — low school quality limits family demand, transient renter base, plan for 1-2y turnover.
- Market conditions: 40 active listings in the ZIP; 8 units permitted in Vermilion County in 2024 (0 in 5+ unit buildings).
Forward outlook
- In year one you build about $855 of equity ($171 loan paydown + $684 appreciation (2.8% local appreciation)).
- Vermilion County population projected at -24% by 2050 — secular population decline; favor cash flow + early exit over multi-decade hold.
- At projected returns (2.8% appreciation + 3.0% rent growth), your $7k cash investment doubles in ~1 year — after that, you're playing with house money.
Negotiation context
- It's been on market 39 days — a 3% lower offer ($24k) is reasonable based on typical stale-listing flexibility.
Risks & watch-outs
- Watch-outs: built in 1920 — expect roof / HVAC / electrical / plumbing capex.
Questions for the listing agent
- It's been on market 39 days. Have you received any prior offers? Is the seller open to a 3% concession, seller financing, or rate buy-down credit?
- Built in 1920 — when were the roof, HVAC, electrical panel, plumbing, and water heater last replaced?
- Is there a deadline driving the sale (1031 exchange, divorce, estate, relocation)? That informs how much negotiation room exists.
- Schools are F-rated, which usually means shorter tenancies and higher turnover. Who's the typical renter profile here, and what's been the actual vacancy rate?
- Crime grade is D in this area — have there been break-ins, vandalism, or insurance claims at this property in the last 3 years? What carrier currently insures it and at what premium?
- The area grade is low — what's the realistic commute time and amenity access for the typical tenant pool here? Any planned neighborhood developments (good or bad) we should know about?
- What's the average days-on-market for RENTAL listings here right now (not sales)? A rising rental-DOM trend means longer vacancies and softer asking-rent achievability than the comps imply.
- What's the recent tenant-quality profile in this submarket — average credit score on applications, eviction rate, late-payment / NSF rate, and stable-employment percentage? A property-management company in the area should have these aggregated.
- How much new for-sale + rental construction is in the pipeline within 1–3 miles? Heavy new supply typically softens prices + rents 12–24 months out; constrained supply supports both.
Investment metrics
- 1% rule
- 5.75% ✓
- Cap rate
- 51.71%
- Cash-on-cash
- 162.20%
- DSCR
- 8.22
- GRM
- 1.4
CMA / ARV
- ARV (median comp)
- $137,871
- List price
- $24,700
- Delta
- -82.08%
- Verdict
- UNDERPRICED
- Comps
- 20 within 1.0 mi
Show comp detail 10 sales within ~0.75 mi
| Address | Dist | Beds/Ba | Sqft | Sold | Price | $/sf | Match |
|---|---|---|---|---|---|---|---|
| 816 E Elm St | 0.19mi | 3/2.5 (-1) | 2,424 (-7%) | 1mo | $140,000 | $58 | 70 |
| 402 Euclid Ave | 0.36mi | 4/2.5 | 2,730 (+5%) | 7mo | $225,000 | $82 | 65 |
| 602 S 4th St | 0.20mi | 3/1.5 (-1) | 2,400 (-8%) | 16mo | $98,000 | $41 | 59 |
| 626 E Washington St | 0.37mi | 5/1.5 (+1) | 2,568 (-1%) | 20mo | $80,000 | $31 | 59 |
| 207 E Lincoln St | 0.44mi | 5/1.5 (+1) | 2,500 (-4%) | 15mo | $30,000 | $12 | 56 |
| 518 S Market St | 0.38mi | 4/2.0 | 2,242 (-14%) | 3mo | $139,000 | $62 | 55 |
| 801 E Washington St | 0.35mi | 3/2.0 (-1) | 2,450 (-6%) | 21mo | $187,500 | $77 | 50 |
| 859 E Washington St | 0.51mi | 5/1.5 (+1) | 2,324 (-11%) | 15mo | $133,000 | $57 | 41 |
| 846 E Penn St | 0.50mi | 3/1.5 (-1) | 2,365 (-9%) | 21mo | $104,120 | $44 | 39 |
| 750 E Main St | 0.55mi | 4/2.0 | 2,218 (-15%) | 16mo | $109,000 | $49 | 35 |
Match score weights: distance 35% · size 25% · config 20% · recency 20%. Top-matched comps best support the ARV.
Projected returns pro-forma
2.77% appreciation · 3.0% rent growth · sell at horizon
- IRR
- —
- Equity multiple
- 10.00×
- Total profit
- $62,247
- Equity at exit
- $10,788
- IRR
- —
- Equity multiple
- 21.04×
- Total profit
- $138,574
- Equity at exit
- $16,382
Cash invested: $6,916 (down + closing). Projections, not guarantees.
Landlord ↔ Tenant lean methodology
- Overall (STATE)
- 43 Moderately Tenant-Leaning
- State Illinois
- 43 Moderately Tenant-Leaning · D+7
- County
- — inherits STATE
- City
- — inherits STATE
ZIP-level market 60942
- Home prices YoY
- 1.4%
- Active inventory
- 40
- Price-to-rent
- 1.4×
Monthly cashflow live
- Estimated rent
- $1,421 medium interval (Pro) →
- Mortgage (P&I)
- −$130
- Tax from tax record
- −$48 /mo · $571/yr
- Insurance
- −$10
- HOA
- −$0
- Vacancy / Maint / Mgmt
- −$298
- Net cashflow
- $935
Break-even live
UW: 25.0% down · 7.5% · 30yr · 1.5% tax · 5.0% vac · 8.0% maint · 8.0% mgmt
Financing live
Cash to close
- Down payment
- $6,175
- Closing costs
- $741
- Reserves months
- —
- Total cash needed
- —
Loan-product check · same deal, 3 products live
Conventional
25% down · 7.5% · 30yr
- Down + closing
- —
- Monthly P&I
- —
- Monthly cashflow
- —
- DSCR
- —
- Eligible?
- —
Personal DTI + credit; lowest rate.
DSCR
20% down · 8.5% · 30yr
- Down + closing
- —
- Monthly P&I
- —
- Monthly cashflow
- —
- DSCR
- —
- Eligible?
- —
No personal income docs; deal must DSCR.
Hard money
10% down · 12.0% · 12mo
- Down + closing
- —
- Monthly P&I
- —
- Monthly cashflow
- —
- DSCR
- —
- Eligible?
- —
Short-term bridge; refi at stabilization.
Listing history 13 events
-
2026-06-15days on market $24,700 Active 39 DOM
-
2026-06-13days on market $24,700 Active 37 DOM
-
2026-06-12days on market $24,700 Active 36 DOM
-
2026-06-09days on market $24,700 Active 33 DOM
-
2026-06-08days on market $24,700 Active 32 DOM
-
2026-06-07days on market $24,700 Active 31 DOM
-
2026-06-07days on market $24,700 Active 30 DOM
-
2026-06-04pricedays on market $24,700 Active 27 DOM
-
2026-06-02days on market $29,900 Active 26 DOM
-
2026-06-01days on market $29,900 Active 25 DOM
-
2026-05-31days on market $29,900 Active 24 DOM
-
2026-05-31days on market $29,900 Active 23 DOM
-
2026-05-07$34,900 Active 794-char remark
ⓘ Source: listings_history table (triggers on properties + properties_extension) + one-shot
backfill from property_details.listing_events for pre-trigger history.
Tax reassessment forecast IL · Partial reset (capped growth)
- Current annual tax
- $571 · $48/mo
- Projected year-2 tax
- $571 · $48/mo
- Expected delta
- $0/yr ($0/mo · 0.0%)
ⓘ Screening estimate from a state-policy table — verify with the county assessor before closing.
Climate risk First Street
- Flood 1/10 Low FEMA zone X (unshaded) · 0% chance over 30 yrs
- Wildfire 1/10 Low
- Heat 3/10 Moderate 7 d/yr ≥103°F today · 18 d/yr by 30 yrs out
- Wind 2/10 Low 100% chance of damaging wind over 30 yrs
- Air quality 2/10 Low 1 unhealthy d/yr today · 1 by 30 yrs out
Nearby sold comps map
Loading sold comps map…
Walkable amenities ~0.75 mi
Loading nearby amenities…
Taxation est. · year 1
- Rental income
- $17,047
- − Mortgage interest
- −$1,384
- − Property taxes
- −$571
- − Insurance
- −$124
- − Repairs & maintenance
- −$1,364
- − Management
- −$1,364
- − Depreciation
- −$719
- Taxable income
- $11,522
- Est. tax owed @ 24.0%
- −$2,765
- After-tax cash flow
- $8,452/yr
For passive investors: Depreciation is non-cash, so a rental often shows a tax loss while cash-flowing — sheltering income. Rental losses are passive: they offset passive income freely, and up to $25,000/yr can offset ordinary (W-2) income if you actively participate and your MAGI is under $100k (phasing out to $0 by $150k); unused losses carry forward. On sale, claimed depreciation is recaptured at up to 25%, and gains may owe capital-gains tax (a 1031 exchange can defer both). Figures are a year-1 estimate at your 24.0% rate — not tax advice; consult a CPA.
Schools (NCES district)
- District
- Hoopeston Area CUSD 11
- NCES district ID
- 1719660
- Math proficiency
- 9% ▼ -7.00%
- Reading proficiency
- 15% ▼ -3.00%
- Median HH income
- $40,897
- Composite
- 10.39/100
- National rank
- #9786
- State rank
- #559 of 620 in IL
Livability — Hoopeston
- Score
- 57/100
- State rank
- #1152
- US rank
- #21789
Category grades
Schools grade is shown separately in the Schools card above.
Census & demographics
- Census place
- Hoopeston, IL
- City population
- 5,635
- Population (ZIP)
- 5,635
Population outlook (Vermilion County) Hauer SSP2
- Today (2025)
- 72,775 people
- By 2030
- 69,235 · -4.9%
- By 2040
- 62,360 · -14.3%
- By 2050
- 55,539 · -23.7%
- By 2075
- 40,606 · -44.2%
- By 2100
- 26,985 · -62.9%
Race, ethnicity, and origin ACS 2023
- Neighborhood character
- Predominantly White (91%)
- Race & ethnicity
- White 91% Hispanic / Latino 5% Two or more races 4% Black 2% Asian 1%
- Common ancestry
- Portuguese 4% Slovak 2% Italian 2%
- Foreign-born
- 1% · Canada, South Korea
- Languages at home
- 96% English-only · Spanish 4% Other Indo-European 1%
Political lean MEDSL · Vermilion
- 2024 margin
- Solid R (+35.7) · D 31.4% · R 67.0% · Other 1.6%
- 2008→2024 swing
- -36.2pp toward R · 2008: 0.6pp · 2024: -35.7pp
- All cycles
- 2024: R+35.7 2020: R+32.9 2016: R+29.2 2012: R+15.7 2008: D+0.6
Not yet ingested
- Civics
- —
Market trends
- HPI YoY
- ▲ 2.77%
- Current HPI
- 193.4089
- Rent YoY
- —
- Metro
- —
- State GDP YoY
- ▲ 1.59%
- F500 in state
- 60
Industry mix (Fortune 500 HQ in IL)
| Industry | F500 HQs | Revenue |
|---|---|---|
| Insurance | 4 | $201B |
|
||
| Consumer Goods | 4 | $87B |
|
||
| Industrial Machinery | 3 | $64B |
|
||
| Healthcare | 2 | $55B |
|
||
| Retail / Pharmacy | 1 | $148B |
|
||
| Agriculture / Food | 1 | $86B |
|
||
Price history
-29.2% since first listed3 events — show timeline
- 2026-06-03 Price Changed $24,700 CIBR
- 2026-05-20 Price Changed $29,900 CIBR
- 2026-05-07 Listed $34,900 CIBR
Property tax history
-5.1%/yrLatest (2024): $571 · +20.5% YoY. Source: county tax records.
Cash-flow waterfall
monthlySold comps — $/sqft
last 12 mo · ≤1 miLoading sold comps…