2646 N Hwy 903 N · Maury, NC
Flood risk 1/10 · Minimal
- FEMA flood zone
- X (unshaded)
- Chance of flooding over 30 yrs
- 0.0%
- Est. flood insurance / yr
- $507 – $1,088
Fire risk 3/10 · Minor
- Est. fire insurance / yr
- $906 – $1,684
Heat risk 7/10 · Major
- Hot days now (above 107°F)
- 7 days/yr
- Hot days in 30 yrs
- 17 days/yr
Wind risk 8/10 · Major
- Chance of severe wind over 30 yrs
- 80.0%
Air-quality risk 3/10 · Minor
- Unhealthy air days now
- 2 days/yr
- Unhealthy air days in 30 yrs
- 3 days/yr
Risk factors via First Street. Map © Google.
Why this score? — see what drove the B grade
The composite is a weighted blend of 9 inputs, each scored 0–100. Each bar is that input's sub-score; the figure is the points it added to the 100-point composite (weight × sub-score).
- Cash flow +30.0/30.0
- 1% rule +10.0/10.0
- DSCR +10.0/10.0
- ARV discount +7.5/15.0
- Appreciation +6.5/10.0
- Livability +2.9/5.0
- Rent growth +2.5/5.0
- Condition / age +2.5/5.0
- Schools +2.4/10.0
$65,000
🖨 Deal sheet (PDF) 📄 Offer letter ✓ Due diligence
Listing remarks MLS
Property is located directly across from Eastern Correction Institution. SOLD AS IS NO WARRANTIES OR REPRESENTATIONS BY SELLER. NO CONTINGENT OFFERS. Exempt from NC Residential Disclosure. Contact Agent prior to writing an offer.
Key facts
- 0.46 acre lot
- Built 1950
- Listed 8 days
Property features AI
Exterior
- Parking: Unpaved parking
- Utilities: Water available
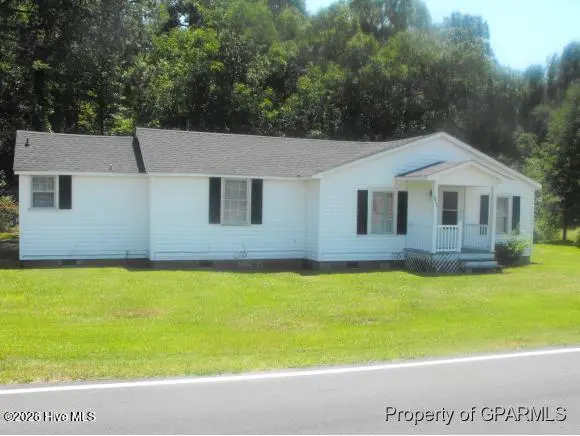
- Home design: Single-family residence; One story (entry level: 1)
- Construction: Vinyl siding and frame construction; Shingle roof; Built on crawl space foundation
- Exterior features: Front porch; Chain link fencing; Paved road access
Interior
- Bedrooms: Total of 6 rooms (bedrooms/other rooms combined)
- Bathrooms: 1 full bathroom; 1 half bathroom
- Heating & cooling: Heat pump for heating and cooling; Electric heating
- Interior features: Crawl space basement; Has a view
Neighborhood map
What this means for you Summary
Snapshot
- This is a 3-bed/1.5-bath single-family listed at $65k.
Deal economics
- At list price, monthly cash flow is $465 ($6k/yr) — positive.
- The deal already cash-flows at list — no discount required.
- Meets the 1% rule at list price ($1k rent vs $65k).
Location & tenants
- Location reads 57/100 on livability (#606 in NC) — a working-class tenant base; expect higher turnover. Strengths: cost of living A+, housing A+, crime B+; Watch: amenities F, commute F, employment F.
- Greene County Schools (rural): math 25% / reading 32% proficiency, ranked #151 of 178 in NC (top 85%) — low school quality limits family demand, transient renter base, plan for 1-2y turnover; 77% free/reduced lunch — lower-income household profile, screen leases tightly.
- Zoned schools: Greene County Intermediate (math 22% / reading 28%, grade F, #1,101 of 1,410 statewide, top 79%, 358 students, 99% FRL); Greene County Middle (math 21% / reading 32%, grade F, #381 of 475 statewide, top 81%, 680 students, 100% FRL); Greene Central High (math 42% / reading 32%, grade F, #414 of 535 statewide, top 79%, 752 students, 100% FRL) — zoned schools average 99% FRL vs 77% district-wide (22 pts higher); higher-poverty schools than district average — tighter screening recommended.
- Market conditions: 35 active listings in the ZIP; 52 units permitted in Greene County in 2024 (0 in 5+ unit buildings).
Forward outlook
- In year one you build about $2k of equity ($449 loan paydown + $2k appreciation (2.9% local appreciation)).
- Greene County population projected at -14% by 2050 — secular population decline; favor cash flow + early exit over multi-decade hold.
- At projected returns (2.9% appreciation + 3.0% rent growth), your $18k cash investment doubles in ~3 years — after that, you're playing with house money.
Negotiation context
- Only 9 days on market — expect competitive offers; lowballing is unlikely to land.
- 4 sale attempts since 13y ago with the ask held roughly flat each time — persistent listings suggest the price (not the market) is what's stuck; bring a comps-based counter.
- Current owner paid $40k; list at $65k implies a 62% gain — meaningful room to come down on a strong offer.
Risks & watch-outs
- Watch-outs: built in 1950 — expect roof / HVAC / electrical / plumbing capex.
- Climate carrying-cost: severe wind risk, 80% chance of damaging wind over 30y; extreme-heat days projected 7→17/yr by 2055 (HVAC capex compounding) — expect insurance premiums to compound above CPI over the hold.
Questions for the listing agent
- Built in 1950 — when were the roof, HVAC, electrical panel, plumbing, and water heater last replaced?
- Is there a deadline driving the sale (1031 exchange, divorce, estate, relocation)? That informs how much negotiation room exists.
- Schools are F-rated, which usually means shorter tenancies and higher turnover. Who's the typical renter profile here, and what's been the actual vacancy rate?
- What's the average days-on-market for RENTAL listings here right now (not sales)? A rising rental-DOM trend means longer vacancies and softer asking-rent achievability than the comps imply.
- What's the recent tenant-quality profile in this submarket — average credit score on applications, eviction rate, late-payment / NSF rate, and stable-employment percentage? A property-management company in the area should have these aggregated.
- How much new for-sale + rental construction is in the pipeline within 1–3 miles? Heavy new supply typically softens prices + rents 12–24 months out; constrained supply supports both.
Investment metrics
- 1% rule
- 1.73% ✓
- Cap rate
- 14.87%
- Cash-on-cash
- 30.65%
- DSCR
- 2.36
- GRM
- 4.8
CMA / ARV
No comps found within radius.
Projected returns pro-forma
2.93% appreciation · 3.0% rent growth · sell at horizon
- IRR
- 36.3%
- Equity multiple
- 3.04×
- Total profit
- $37,190
- Equity at exit
- $28,963
- IRR
- 36.5%
- Equity multiple
- 6.01×
- Total profit
- $91,224
- Equity at exit
- $44,431
Cash invested: $18,200 (down + closing). Projections, not guarantees.
Landlord ↔ Tenant lean methodology
- Overall (STATE)
- 85 Strongly Landlord-Friendly
- State North Carolina
- 85 Strongly Landlord-Friendly · R+3
- County
- — inherits STATE
- City
- — inherits STATE
ZIP-level market 28580
- Home prices YoY
- 1.5%
- Active inventory
- 35
- Price-to-rent
- 4.8×
Monthly cashflow live
- Estimated rent
- $1,128 medium interval (Pro) →
- Mortgage (P&I)
- −$341
- Tax from tax record
- −$58 /mo · $697/yr
- Insurance
- −$27
- HOA
- −$0
- Vacancy / Maint / Mgmt
- −$237
- Net cashflow
- $465
Break-even live
Sensitivity live
| Price | -10% $502 | -5% $483 | +0% $465 | +5% $446 | +10% $428 |
|---|---|---|---|---|---|
| Rent | -10% $376 | -5% $420 | +0% $465 | +5% $509 | +10% $554 |
| Rate | -1.0pp $498 | -0.5pp $481 | base $465 | +0.5pp $448 | +1.0pp $431 |
UW: 25.0% down · 7.5% · 30yr · 1.5% tax · 5.0% vac · 8.0% maint · 8.0% mgmt
Financing live
Cash to close
- Down payment
- $16,250
- Closing costs
- $1,950
- Reserves months
- —
- Total cash needed
- —
Loan-product check · same deal, 3 products live
Conventional
25% down · 7.5% · 30yr
- Down + closing
- —
- Monthly P&I
- —
- Monthly cashflow
- —
- DSCR
- —
- Eligible?
- —
Personal DTI + credit; lowest rate.
DSCR
20% down · 8.5% · 30yr
- Down + closing
- —
- Monthly P&I
- —
- Monthly cashflow
- —
- DSCR
- —
- Eligible?
- —
No personal income docs; deal must DSCR.
Hard money
10% down · 12.0% · 12mo
- Down + closing
- —
- Monthly P&I
- —
- Monthly cashflow
- —
- DSCR
- —
- Eligible?
- —
Short-term bridge; refi at stabilization.
Listing history 8 events
-
2026-06-21days on market $65,000 Active 9 DOM
-
2026-06-19days on market $65,000 Active 7 DOM
-
2026-06-18days on market $65,000 Active 6 DOM
-
2026-06-17days on market $65,000 Active 5 DOM
-
2026-06-16days on market $65,000 Active 4 DOM
-
2026-06-15days on market $65,000 Active 3 DOM
-
2026-06-13remarks 119-char remark
-
2026-06-13$65,000 Active 1 DOM
ⓘ Source: listings_history table (triggers on properties + properties_extension) + one-shot
backfill from property_details.listing_events for pre-trigger history.
Tax reassessment forecast NC · Resets to sale price
- Current annual tax
- $697 · $58/mo
- Projected year-2 tax
- $697 · $58/mo
- Expected delta
- $0/yr ($0/mo · 0.0%)
ⓘ Screening estimate from a state-policy table — verify with the county assessor before closing.
Climate risk First Street
- Flood 1/10 Low FEMA zone X (unshaded) · 0% chance over 30 yrs
- Wildfire 3/10 Moderate
- Heat 7/10 Severe 7 d/yr ≥107°F today · 17 d/yr by 30 yrs out
- Wind 8/10 Severe 80% chance of damaging wind over 30 yrs
- Air quality 3/10 Moderate 2 unhealthy d/yr today · 3 by 30 yrs out
Nearby sold comps map
Loading sold comps map…
Walkable amenities ~0.75 mi
Loading nearby amenities…
Taxation est. · year 1
- Rental income
- $13,533
- − Mortgage interest
- −$3,641
- − Property taxes
- −$697
- − Insurance
- −$325
- − Repairs & maintenance
- −$1,083
- − Management
- −$1,083
- − Depreciation
- −$1,891
- Taxable income
- $4,813
- Est. tax owed @ 24.0%
- −$1,155
- After-tax cash flow
- $4,423/yr
For passive investors: Depreciation is non-cash, so a rental often shows a tax loss while cash-flowing — sheltering income. Rental losses are passive: they offset passive income freely, and up to $25,000/yr can offset ordinary (W-2) income if you actively participate and your MAGI is under $100k (phasing out to $0 by $150k); unused losses carry forward. On sale, claimed depreciation is recaptured at up to 25%, and gains may owe capital-gains tax (a 1031 exchange can defer both). Figures are a year-1 estimate at your 24.0% rate — not tax advice; consult a CPA.
Schools (NCES district)
- District
- Greene County Schools
- NCES district ID
- 3701830
- Math proficiency
- 25% ▬ 0.00%
- Reading proficiency
- 32% ▲ 2.00%
- Median HH income
- $38,566
- Composite
- 23.84/100
- National rank
- #7806
- State rank
- #151 of 178 in NC
Livability — Maury
- Score
- 57/100
- State rank
- #606
- US rank
- #21987
Category grades
Schools grade is shown separately in the Schools card above.
Census & demographics
- Census place
- Maury, NC
- City population
- 77
- Population (ZIP)
- 12,048
Population outlook (Greene County) Hauer SSP2
- Today (2025)
- 21,070 people
- By 2030
- 20,745 · -1.5%
- By 2040
- 19,582 · -7.1%
- By 2050
- 18,104 · -14.1%
- By 2075
- 14,181 · -32.7%
- By 2100
- 9,573 · -54.6%
Race, ethnicity, and origin ACS 2023
- Neighborhood character
- Diverse neighborhood (Simpson 0.68)
- Race & ethnicity
- White 42% Black 36% Hispanic / Latino 14% Two or more races 13%
- Hispanic origin (detail)
- Mexican 11% Puerto Rican 2%
- Common ancestry
- Italian 2% Slovak 1%
- Foreign-born
- 5% · Canada
- Languages at home
- 86% English-only · Spanish 13%
Political lean MEDSL · Greene
- 2024 margin
- R (+18.1) · D 40.7% · R 58.8%
- 2008→2024 swing
- -12.2pp toward R · 2008: -5.9pp · 2024: -18.1pp
- All cycles
- 2024: R+18.1 2020: R+11.9 2016: R+9.8 2012: R+7.7 2008: R+5.9
Not yet ingested
- Civics
- —
Market trends
- HPI YoY
- ▲ 2.93%
- Current HPI
- 197.4523
- Rent YoY
- —
- Metro
- —
- State GDP YoY
- ▲ 3.28%
- F500 in state
- 26
Industry mix (Fortune 500 HQ in NC)
| Industry | F500 HQs | Revenue |
|---|---|---|
| Financial Services | 2 | $213B |
|
||
| Retail | 2 | $95B |
|
||
| Industrial Conglomerate | 1 | $38B |
|
||
| Metals / Steel | 1 | $35B |
|
||
| Utilities | 1 | $30B |
|
||
| Industrial Machinery | 1 | $19B |
|
||
Price history
+62.5% since first listed10 events — show timeline
- 2026-06-12 Listed $65,000 Hive MLS
- 2023-10-20 Rental Removed $1,100 LEASESTAR
- 2023-10-17 Listed for Rent $1,100 LEASESTAR
- 2015-12-31 Listing Removed — Hive MLS
- 2015-08-10 Listed $35,500 Hive MLS
- 2015-05-05 Sold (Public Records) $40,000 Public Records
- 2014-02-27 Sold (Public Records) $40,000 Public Records
- 2014-02-26 Sold (MLS) $5,000 Hive MLS
- 2013-02-18 Listed $11,000 Hive MLS
- 2008-02-22 Sold (Public Records) $40,000 Public Records
Property tax history
+0.3%/yrLatest (2025): $697 · +1.5% YoY. Source: county tax records.
Cash-flow waterfall
monthlySold comps — $/sqft
last 12 mo · ≤1 miLoading sold comps…