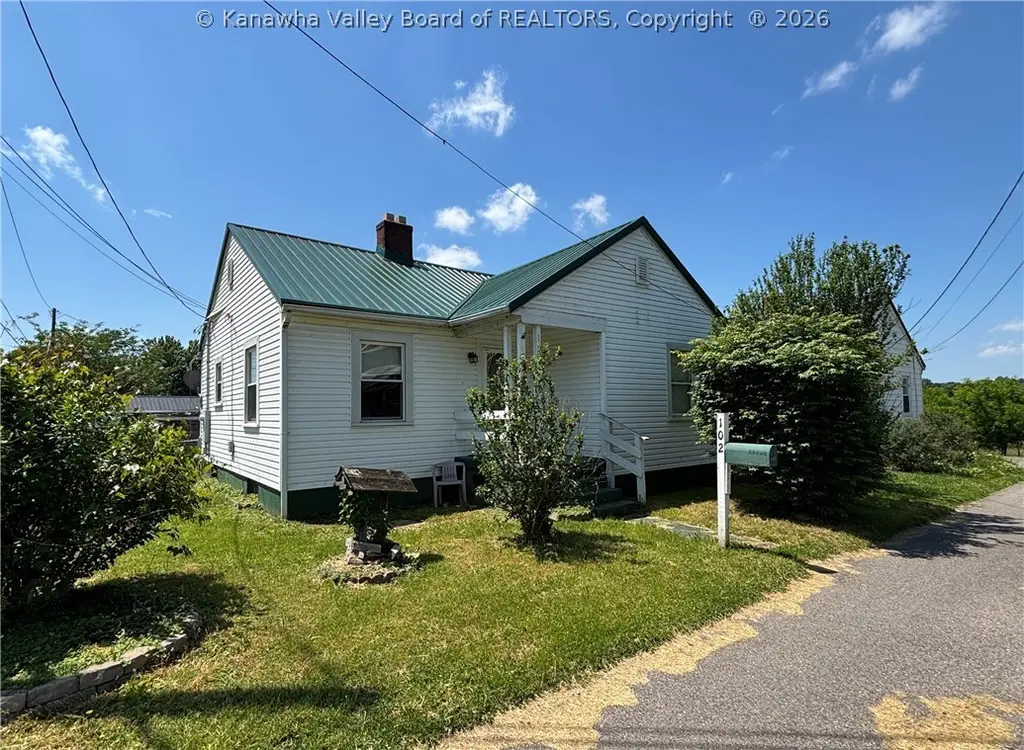
102 Marietta St · Point Pleasant, WV
Flood risk 6/10 · Moderate
- FEMA flood zone
- X (unshaded)
- Chance of flooding over 30 yrs
- 0.33%
- Est. flood insurance / yr
- $473 – $860
Fire risk 4/10 · Minor
- Est. fire insurance / yr
- $787 – $1,461
Heat risk 4/10 · Minor
- Hot days now (above 101°F)
- 7 days/yr
- Hot days in 30 yrs
- 18 days/yr
Wind risk 2/10 · Minimal
- Chance of severe wind over 30 yrs
- 1.0%
Air-quality risk 1/10 · Minimal
- Unhealthy air days now
- 0 days/yr
- Unhealthy air days in 30 yrs
- 0 days/yr
Risk factors via First Street. Map © Google.
Why this score? — see what drove the B grade
The composite is a weighted blend of 9 inputs, each scored 0–100. Each bar is that input's sub-score; the figure is the points it added to the 100-point composite (weight × sub-score).
- Cash flow +30.0/30.0
- 1% rule +10.0/10.0
- DSCR +10.0/10.0
- Appreciation +10.0/10.0
- Livability +3.4/5.0
- Rent growth +2.5/5.0
- Condition / age +2.5/5.0
- Schools +2.2/10.0
- ARV discount +0.0/15.0
$89,000
🖨 Deal sheet 📄 Offer letter ✓ Due diligence
Listing remarks MLS
INVESTMENT OPPORTUNITY! 2 Bedroom/1 Bath MOVE IN READY & PRICED TO SELL! Conveniently located on a corner lot with a fenced in backyard with two storage buildings. Newer metal roof, gas heat & central A/C. FULL basement for great storage! Well-kept & ready for immediate occupancy. No Appliances. AS-IS.
Key facts
- Metal roof
- Fenced in backyard
- Gas heat
Tags
Property features AI
Exterior
- Utilities: Public water; Public sewer
- Home design: Single-family residence; Residential property
- Construction: Frame and plaster construction
- Exterior features: Fenced yard; Metal roof; Lot dimensions approximately 50 x 50 x 80 x 80
Interior
- Flooring: Hardwood floors
- Bathrooms: 1 full bathroom
- Heating & cooling: Central air conditioning; Forced air heating
- Interior features: Eat-in kitchen; Insulated windows; Fireplace (1)
Neighborhood map
What this means for you Summary
Snapshot
- This is a 2-bed/1.0-bath single-family listed at $89k.
Deal economics
- At list price, monthly cash flow is $740 ($9k/yr) — positive.
- The deal already cash-flows at list — no discount required.
- Meets the 1% rule at list price ($2k rent vs $89k).
- Cap rate 16.3% vs local median 6.1% in Point Pleasant — top-decile yield for the area; either an underpriced asset or a hidden risk that comps aren't pricing in. Stress-test before assuming the spread holds.
Location & tenants
- Location reads 67/100 on livability (#95 in WV) — a middle-class / working-renter tenant base. Strengths: cost of living A+, housing A+, crime A; Watch: health & safety C-, employment D, amenities F.
- Mason County Schools (town): math 20% / reading 33% proficiency, ranked #44 of 55 in WV (top 80%) — low school quality limits family demand, transient renter base, plan for 1-2y turnover.
- Zoned schools: Pt. Pleasant Primary (351 students, 0% FRL); Point Pleasant Junior/Senior High School (math 13% / reading 35%, grade F, #95 of 110 statewide, top 86%, 1,107 students, 0% FRL) — zoned schools average 0% FRL vs 47% district-wide (47 pts lower); this property's tenant base skews higher-income than the district average.
- Market conditions: 58 active listings in the ZIP; 4 comparable units currently listed for rent nearby; rentals lingering (median 44d on market — plan ~5-8 weeks vacancy on turnover, expect pricing pressure); 100% of comp listings sitting > 30 days — soft ceiling on asking rent; 3 units permitted in Mason County in 2024 (0 in 5+ unit buildings).
Forward outlook
- In year one you build about $10k of equity ($615 loan paydown + $9k appreciation (10.0% local appreciation)).
- Mason County population projected at -14% by 2050 — secular population decline; favor cash flow + early exit over multi-decade hold.
- At projected returns (10.0% appreciation + 3.0% rent growth), your $25k cash investment doubles in ~2 years — after that, you're playing with house money.
- By year 4, paydown + projected appreciation supports a ~$34k cash-out refi (75% LTV) — recoverable capital for the next deal without selling this one.
Negotiation context
- Only 3 days on market — expect competitive offers; lowballing is unlikely to land.
- 2 sale attempts since 5y ago with the ask held roughly flat each time — persistent listings suggest the price (not the market) is what's stuck; bring a comps-based counter.
- Current owner paid $54k; list at $89k implies a 65% gain — meaningful room to come down on a strong offer.
Risks & watch-outs
- Watch-outs: built in 1940 — expect roof / HVAC / electrical / plumbing capex.
- Climate carrying-cost: major flood risk — expect insurance premiums to compound above CPI over the hold.
Questions for the listing agent
- Built in 1940 — when were the roof, HVAC, electrical panel, plumbing, and water heater last replaced?
- Is there a deadline driving the sale (1031 exchange, divorce, estate, relocation)? That informs how much negotiation room exists.
- Schools are F-rated, which usually means shorter tenancies and higher turnover. Who's the typical renter profile here, and what's been the actual vacancy rate?
- What's the average days-on-market for RENTAL listings here right now (not sales)? A rising rental-DOM trend means longer vacancies and softer asking-rent achievability than the comps imply.
- What's the recent tenant-quality profile in this submarket — average credit score on applications, eviction rate, late-payment / NSF rate, and stable-employment percentage? A property-management company in the area should have these aggregated.
- How much new for-sale + rental construction is in the pipeline within 1–3 miles? Heavy new supply typically softens prices + rents 12–24 months out; constrained supply supports both.
Investment metrics
- 1% rule
- 1.82% ✓
- Cap rate
- 16.27%
- Cash-on-cash
- 35.64%
- DSCR
- 2.59
- GRM
- 4.6
CMA / ARV
- ARV (on-the-fly)
- $70,752
- Comps found
- 3
Show comp detail 3 sales within ~0.75 mi
| Address | Dist | Beds/Ba | Sqft | Sold | Price | $/sf | Match |
|---|---|---|---|---|---|---|---|
| 2219 Jefferson Ave | 0.37mi | 2/1.0 | 830 (+3%) | 8mo | $121,000 | $146 | 71 |
| 2109 Lincoln Ave | 0.26mi | 2/1.0 | 849 (+6%) | 13mo | $75,000 | $88 | 67 |
| 2615 Lincoln Ave | 0.58mi | 2/1.0 | 825 (+3%) | 22mo | $30,000 | $36 | 50 |
Match score weights: distance 35% · size 25% · config 20% · recency 20%. Top-matched comps best support the ARV.
Projected returns pro-forma
10.0% appreciation · 3.0% rent growth · sell at horizon
- IRR
- 51.6%
- Equity multiple
- 4.84×
- Total profit
- $95,590
- Equity at exit
- $80,178
- IRR
- 45.3%
- Equity multiple
- 10.81×
- Total profit
- $244,377
- Equity at exit
- $172,907
Cash invested: $24,920 (down + closing). Projections, not guarantees.
Landlord ↔ Tenant lean methodology
- Overall (STATE)
- 83 Strongly Landlord-Friendly
- State West Virginia
- 83 Strongly Landlord-Friendly · R+22
- County
- — inherits STATE
- City
- — inherits STATE
ZIP-level market 25550
- Home prices YoY
- 6.7%
- Active inventory
- 58
- Price-to-rent
- 4.6×
Monthly cashflow live
- Estimated rent
- $1,616 medium interval (Pro) →
- Mortgage (P&I)
- −$467
- Tax from tax record
- −$33 /mo · $392/yr
- Insurance
- −$37
- HOA
- −$0
- Vacancy / Maint / Mgmt
- −$339
- Net cashflow
- $740
Break-even live
UW: 25.0% down · 7.5% · 30yr · 1.5% tax · 5.0% vac · 8.0% maint · 8.0% mgmt
Financing live
Cash to close
- Down payment
- $22,250
- Closing costs
- $2,670
- Reserves months
- —
- Total cash needed
- —
Loan-product check · same deal, 3 products live
Conventional
25% down · 7.5% · 30yr
- Down + closing
- —
- Monthly P&I
- —
- Monthly cashflow
- —
- DSCR
- —
- Eligible?
- —
Personal DTI + credit; lowest rate.
DSCR
20% down · 8.5% · 30yr
- Down + closing
- —
- Monthly P&I
- —
- Monthly cashflow
- —
- DSCR
- —
- Eligible?
- —
No personal income docs; deal must DSCR.
Hard money
10% down · 12.0% · 12mo
- Down + closing
- —
- Monthly P&I
- —
- Monthly cashflow
- —
- DSCR
- —
- Eligible?
- —
Short-term bridge; refi at stabilization.
Rent comps 4 comps
| Address | Beds | Baths | Sqft | Rent | $/sqft | DOM | Units | Dist |
|---|---|---|---|---|---|---|---|---|
| 2422 Jackson Ave Point Pleasant, WV | 1.0 | 1.0 | 1000 | $1,600 | $1.60 | 43d | 1 | 0.55mi |
| 224 N Park Dr Point Pleasant, WV | 1.0 | 1.0 | 1000 | $1,600 | $1.60 | 43d | 1 | 0.57mi |
| S Park Dr Point Pleasant, WV | 1.0 | 1.0 | 1000 | $1,650 | $1.65 | 43d | 1 | 0.59mi |
| 1151 Evergreen Dr Point Pleasant, WV | 2.0–3.0 | 1.5 | 730 | $340 | $0.47 | 43d | 1 | 1.07mi |
Listing history 5 events
-
2026-05-22status Pending
-
2026-05-19$89,000 Active
-
2022-03-04soldstatus $54,000 321-char remark
Show marketing remark (321 chars)
INVESTMENT OPPORTUNITY! 2 Bedroom/1 Bath MOVE IN READY & PRICED TO SELL! Conveniently located on a corner lot with a fenced in backyard with two storage buildings. Newer metal roof, gas heat & central A/C. FULL basement for great storage! Well-kept & ready for immediate occupancy. No Appliances. AS-IS.
-
2021-11-04$54,000 321-char remark
Show marketing remark (321 chars)
INVESTMENT OPPORTUNITY! 2 Bedroom/1 Bath MOVE IN READY & PRICED TO SELL! Conveniently located on a corner lot with a fenced in backyard with two storage buildings. Newer metal roof, gas heat & central A/C. FULL basement for great storage! Well-kept & ready for immediate occupancy. No Appliances. AS-IS.
-
1979-11-20soldstatus $30,000
ⓘ Source: listings_history table (triggers on properties + properties_extension) + one-shot
backfill from property_details.listing_events for pre-trigger history.
Tax reassessment forecast WV · Resets to sale price
- Current annual tax
- $392 · $33/mo
- Projected year-2 tax
- $525 · $44/mo
- Expected delta
- +$133/yr (+$11/mo · 33.9%)
ⓘ Screening estimate from a state-policy table — verify with the county assessor before closing.
Climate risk First Street
- Flood 6/10 Major FEMA zone X (unshaded) · 33% chance over 30 yrs
- Wildfire 4/10 Moderate
- Heat 4/10 Moderate 7 d/yr ≥101°F today · 18 d/yr by 30 yrs out
- Wind 2/10 Low 100% chance of damaging wind over 30 yrs
- Air quality 1/10 Low 0 unhealthy d/yr today · 0 by 30 yrs out
Nearby sold comps map
Loading sold comps map…
Walkable amenities ~0.75 mi
Loading nearby amenities…
Taxation est. · year 1
- Rental income
- $19,392
- − Mortgage interest
- −$4,985
- − Property taxes
- −$392
- − Insurance
- −$445
- − Repairs & maintenance
- −$1,551
- − Management
- −$1,551
- − Depreciation
- −$2,589
- Taxable income
- $7,878
- Est. tax owed @ 24.0%
- −$1,891
- After-tax cash flow
- $6,991/yr
For passive investors: Depreciation is non-cash, so a rental often shows a tax loss while cash-flowing — sheltering income. Rental losses are passive: they offset passive income freely, and up to $25,000/yr can offset ordinary (W-2) income if you actively participate and your MAGI is under $100k (phasing out to $0 by $150k); unused losses carry forward. On sale, claimed depreciation is recaptured at up to 25%, and gains may owe capital-gains tax (a 1031 exchange can defer both). Figures are a year-1 estimate at your 24.0% rate — not tax advice; consult a CPA.
Schools (NCES district)
- District
- Mason County Schools
- NCES district ID
- 5400780
- Math proficiency
- 20% ▼ -13.00%
- Reading proficiency
- 33% ▼ -10.00%
- Median HH income
- $37,623
- Composite
- 22.07/100
- National rank
- #8191
- State rank
- #44 of 55 in WV
Livability — Point Pleasant
- Score
- 67/100
- State rank
- #95
- US rank
- #10881
Category grades
Schools grade is shown separately in the Schools card above.
Census & demographics
- Census place
- Point Pleasant, WV
- County
- Mason · 14,594 people
- Population (ZIP)
- 8,925
- Household income
- $49,940
- Rent vs Own
- Severe rent burden
- 10.6
Population outlook (Mason County) Hauer SSP2
- Today (2025)
- 26,174 people
- By 2030
- 25,482 · -2.6%
- By 2040
- 23,934 · -8.6%
- By 2050
- 22,432 · -14.3%
- By 2075
- 19,241 · -26.5%
- By 2100
- 15,427 · -41.1%
Race, ethnicity, and origin ACS 2023
- Neighborhood character
- Predominantly White (95%)
- Race & ethnicity
- White 95% Two or more races 2% Hispanic / Latino 2% Black 2%
- Common ancestry
- Slovak 1% Serbian 1% Lithuanian 1%
- Foreign-born
- 0%
Political lean MEDSL · Mason
- 2024 margin
- Solid R (+58.0) · D 20.0% · R 78.0% · Other 1.9%
- 2008→2024 swing
- -45.1pp toward R · 2008: -12.9pp · 2024: -58.0pp
- All cycles
- 2024: R+58.0 2020: R+53.2 2016: R+54.7 2012: R+20.3 2008: R+12.9
Not yet ingested
- Civics
- —
Market trends
- HPI YoY
- ▲ 11.63%
- Current HPI
- 185.6226
- Rent YoY
- —
- Metro
- —
- State GDP YoY
- —
- F500 in state
- 0
Price history
+196.7% since first listed5 events — show timeline
- 2026-05-22 Pending — KVBOR
- 2026-05-19 Listed $89,000 KVBOR
- 2022-03-04 Sold (MLS) $54,000 KVBOR
- 2021-11-04 Listed $54,000 KVBOR
- 1979-11-20 Sold (Public Records) $30,000 Public Records
Property tax history
-3.0%/yrLatest (2025): $392 · -3.2% YoY. Source: county tax records.
Cash-flow waterfall
monthlySold comps — $/sqft
last 12 mo · ≤1 miLoading sold comps…