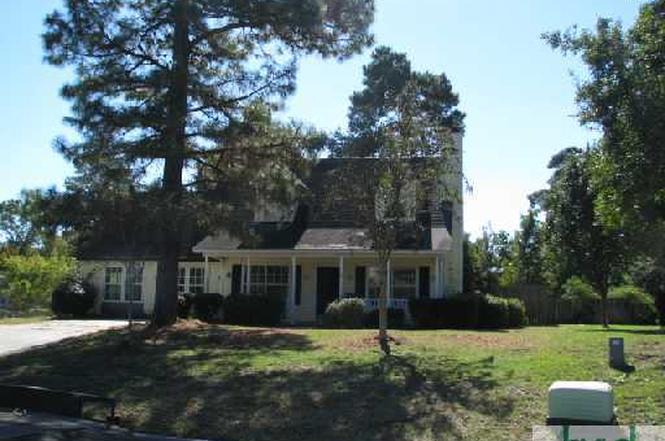
105 Mapmaker Ln · Whitemarsh Island, GA
Flood risk 5/10 · Moderate
- FEMA flood zone
- X (shaded)
- Chance of flooding over 30 yrs
- 0.32%
- Est. flood insurance / yr
- $507 – $1,088
Fire risk 3/10 · Minor
- Est. fire insurance / yr
- $963 – $1,789
Heat risk 10/10 · Severe
- Hot days now (above 106°F)
- 7 days/yr
- Hot days in 30 yrs
- 18 days/yr
Wind risk 9/10 · Severe
- Chance of severe wind over 30 yrs
- 99.0%
Air-quality risk 2/10 · Minimal
- Unhealthy air days now
- 2 days/yr
- Unhealthy air days in 30 yrs
- 2 days/yr
Risk factors via First Street. Map © Google.
Why this score? — see what drove the C- grade
The composite is a weighted blend of 9 inputs, each scored 0–100. Each bar is that input's sub-score; the figure is the points it added to the 100-point composite (weight × sub-score).
- Cash flow +16.6/30.0
- ARV discount +15.0/15.0
- DSCR +5.1/10.0
- 1% rule +4.2/10.0
- Livability +3.5/5.0
- Rent growth +3.0/5.0
- Condition / age +2.5/5.0
- Schools +2.0/10.0
- Appreciation +0.0/10.0
$250,000
🖨 Deal sheet (PDF) 📄 Offer letter ✓ Due diligence
Listing remarks MLS
Great deal in Battery Point! Large bonus room over the enclosed & finished two-car garage. Privacy fenced backyard with deck. This is a MUST SEE!!! Property being sold "AS-IS".
Key facts
- Near schools
- Near shopping
- Near restaurants
Tags
Property features AI
Finance
- HOA & community: Community amenities include a lake and street lights
Exterior
- Parking: Off-street parking
- Utilities: Public water; Public sewer; Cable available; Underground utilities
- Home design: Single family residence; Two-story home
- Construction: Frame construction with vinyl siding; Asphalt roof; Slab foundation; Built with energy-efficient windows
- Exterior features: Deck; Front porch; Privacy fencing; Fenced yard; Storage structure; Has a view; Corner lot with back yard, private setting; Paved public road access
Interior
- Kitchen: Dishwasher; Oven; Range; Range hood; Garbage disposal; Electric water heater
- Bedrooms: One bedroom on the main level
- Bathrooms: Two full bathrooms (one on the main level)
- Heating & cooling: Central heating (electric); Central air conditioning (electric)
- Interior features: Ceiling fans; Pantry; Double pane windows; Wood-burning fireplace in the family room
- Laundry & utility: Washer hookup
Neighborhood map
What this means for you Summary
Snapshot
- This is a 3-bed/2.0-bath single-family listed at $250k.
Deal economics
- At list price, monthly cash flow is $149 ($2k/yr) — positive.
- The deal already cash-flows at list — no discount required.
- To meet the 1% rule (rent ≥ 1% of price), the offer needs to be $230k (7.9% below list).
- Recommended offer: $230k (7.9% below list) — sets the bar for 1% rule.
- Cap rate 7.0% vs local median 2.3% in Whitemarsh Island — top-decile yield for the area; either an underpriced asset or a hidden risk that comps aren't pricing in. Stress-test before assuming the spread holds.
Location & tenants
- Location reads 69/100 on livability (#127 in GA) — a middle-class / working-renter tenant base. Strengths: crime A+, employment A+, housing A+; Watch: amenities F, commute F, health & safety F.
- Savannah-Chatham County (urban): math 20% / reading 26% proficiency, ranked #134 of 174 in GA (top 77%) — low school quality limits family demand, transient renter base, plan for 1-2y turnover.
- Market conditions: Rents rising (+1.8%/yr); 193 active listings in the ZIP; 8 comparable units currently listed for rent nearby; rentals lingering (median 46d on market — plan ~5-8 weeks vacancy on turnover, expect pricing pressure); 50% of comp listings sitting > 30 days — soft ceiling on asking rent; solid renter incomes; 2,694 units permitted in Chatham County in 2024 (973 in 5+ unit buildings).
Forward outlook
- Local home prices are declining (-3.0%/yr); year-one equity from $2k of loan paydown is wiped out by about $8k of value loss. Plan a longer hold.
- Chatham County population projected at +33% by 2050 — long-run rental-demand tailwind backs the buy-and-hold thesis.
Negotiation context
- Only 3 days on market — expect competitive offers; lowballing is unlikely to land.
- 2 sale attempts since 18y ago with the ask held roughly flat each time — persistent listings suggest the price (not the market) is what's stuck; bring a comps-based counter.
- Current owner paid $126k; list at $250k implies a 98% gain — meaningful room to come down on a strong offer.
Risks & watch-outs
- Climate carrying-cost: moderate flood risk; severe wind risk, 99% chance of damaging wind over 30y; extreme-heat days projected 7→18/yr by 2055 (HVAC capex compounding) — expect insurance premiums to compound above CPI over the hold.
Questions for the listing agent
- Is there a deadline driving the sale (1031 exchange, divorce, estate, relocation)? That informs how much negotiation room exists.
- Schools are B-rated — typically a magnet for longer-tenancy family renters. What's the average tenant stay here, and is there a school-zone premium baked into asking?
- What's the average days-on-market for RENTAL listings here right now (not sales)? A rising rental-DOM trend means longer vacancies and softer asking-rent achievability than the comps imply.
- What's the recent tenant-quality profile in this submarket — average credit score on applications, eviction rate, late-payment / NSF rate, and stable-employment percentage? A property-management company in the area should have these aggregated.
- How much new for-sale + rental construction is in the pipeline within 1–3 miles? Heavy new supply typically softens prices + rents 12–24 months out; constrained supply supports both.
Investment metrics
- 1% rule
- 0.92% ✗
- Cap rate
- 7.01%
- Cash-on-cash
- 2.56%
- DSCR
- 1.11
- GRM
- 9.0
CMA / ARV
- ARV (on-the-fly)
- $488,835
- Comps found
- 12
Show comp detail 12 sales within ~0.75 mi
| Address | Dist | Beds/Ba | Sqft | Sold | Price | $/sf | Match |
|---|---|---|---|---|---|---|---|
| 103 Redan Dr | 0.02mi | 3/3.0 | 1,742 (-9%) | 9mo | $364,900 | $209 | 73 |
| 106 Blockade Ct | 0.18mi | 3/2.0 | 1,696 (-12%) | 4mo | $445,000 | $262 | 69 |
| 27 Bryan Wood Cir | 0.48mi | 3/2.0 | 1,883 (-2%) | 11mo | $525,000 | $279 | 66 |
| 107 Penrose Dr | 0.39mi | 3/2.0 | 1,904 (-1%) | 19mo | $589,000 | $309 | 65 |
| 108 Gunpowder Dr | 0.16mi | 4/2.0 (+1) | 1,756 (-8%) | 18mo | $349,998 | $199 | 58 |
| 310 Mapmaker Ln | 0.30mi | 4/3.0 (+1) | 1,692 (-12%) | 2mo | $390,000 | $230 | 56 |
| 120 Turnbuckle Ct | 0.31mi | 4/2.0 (+1) | 1,791 (-7%) | 21mo | $399,900 | $223 | 52 |
| 5 Bowsprit Ct | 0.27mi | 4/3.0 (+1) | 2,163 (+13%) | 7mo | $389,000 | $180 | 51 |
| 1008 Charlene St | 0.69mi | 3/2.0 | 1,926 (+0%) | 21mo | $459,000 | $238 | 49 |
| 1005 Charlene St | 0.73mi | 4/2.0 (+1) | 1,800 (-6%) | 2mo | $470,000 | $261 | 49 |
| 1106 Juanita St | 0.72mi | 3/2.0 | 1,843 (-4%) | 20mo | $470,000 | $255 | 43 |
| 132 Penrose Dr | 0.43mi | 3/2.0 | 1,643 (-14%) | 23mo | $468,500 | $285 | 37 |
Match score weights: distance 35% · size 25% · config 20% · recency 20%. Top-matched comps best support the ARV.
Projected returns pro-forma
-3.0% appreciation · 1.84% rent growth · sell at horizon
- IRR
- -13.5%
- Equity multiple
- 0.52×
- Total profit
- $-33,674
- Equity at exit
- $37,276
- IRR
- -6.5%
- Equity multiple
- 0.60×
- Total profit
- $-27,752
- Equity at exit
- $21,615
Cash invested: $70,000 (down + closing). Projections, not guarantees.
Landlord ↔ Tenant lean methodology
- Overall (STATE)
- 90 Strongly Landlord-Friendly
- State Georgia
- 90 Strongly Landlord-Friendly · R+3
- County
- — inherits STATE
- City
- — inherits STATE
ZIP-level market 31410
- Rents YoY
- 1.8%
- Active inventory
- 193
- Price-to-rent
- 9.0×
Monthly cashflow live
- Estimated rent
- $2,304 high interval (Pro) →
- Mortgage (P&I)
- −$1,311
- Tax from tax record
- −$256 /mo · $3,067/yr
- Insurance
- −$104
- HOA
- −$0
- Vacancy / Maint / Mgmt
- −$484
- Net cashflow
- $149
Break-even live
Sensitivity live
| Price | -10% $291 | -5% $220 | +0% $149 | +5% $78 | +10% $8 |
|---|---|---|---|---|---|
| Rent | -10% $-33 | -5% $58 | +0% $149 | +5% $240 | +10% $331 |
| Rate | -1.0pp $275 | -0.5pp $213 | base $149 | +0.5pp $84 | +1.0pp $18 |
UW: 25.0% down · 7.5% · 30yr · 1.5% tax · 5.0% vac · 8.0% maint · 8.0% mgmt
Financing live
Cash to close
- Down payment
- $62,500
- Closing costs
- $7,500
- Reserves months
- —
- Total cash needed
- —
Loan-product check · same deal, 3 products live
Conventional
25% down · 7.5% · 30yr
- Down + closing
- —
- Monthly P&I
- —
- Monthly cashflow
- —
- DSCR
- —
- Eligible?
- —
Personal DTI + credit; lowest rate.
DSCR
20% down · 8.5% · 30yr
- Down + closing
- —
- Monthly P&I
- —
- Monthly cashflow
- —
- DSCR
- —
- Eligible?
- —
No personal income docs; deal must DSCR.
Hard money
10% down · 12.0% · 12mo
- Down + closing
- —
- Monthly P&I
- —
- Monthly cashflow
- —
- DSCR
- —
- Eligible?
- —
Short-term bridge; refi at stabilization.
Rent comps 8 comps
| Address | Beds | Baths | Sqft | Rent | $/sqft | DOM | Units | Dist |
|---|---|---|---|---|---|---|---|---|
| 108 Blockade Ln Savannah, GA | 3.0 | 2.0 | 1475 | $2,200 | $1.49 | 45d | 1 | 0.12mi |
| 3 Gunpowder Ct Savannah, GA | 3.0 | 2.0 | 1866 | $2,200 | $1.18 | 15d | 1 | 0.15mi |
| 137 Ropemaker Ln Savannah, GA | 3.0 | 2.0 | 1481 | $2,150 | $1.45 | 45d | 1 | 0.18mi |
| 8307 Walden Park Dr Savannah, GA | 3.0 | 2.0 | 1556 | $1,900 | $1.22 | 25d | 1 | 0.56mi |
| 1202 Walden Park Dr Savannah, GA | 2.0 | 2.0 | 1314 | $1,900 | $1.45 | 45d | 1 | 0.57mi |
| 1008 Charlene St Savannah, GA | 3.0 | 2.0 | 1926 | $2,950 | $1.53 | 23d | 1 | 0.70mi |
| 5 Cutty Sark Rd Savannah, GA | 3.0 | 2.0 | 1489 | $3,500 | $2.35 | 45d | 1 | 0.85mi |
| 25 Johnny Mercer Blvd Savannah, GA | 1.0–3.0 | 1.0–2.0 | 1093 | $2,473 | $2.26 | 15d | 24 | 0.85mi |
Listing history 3 events
-
2026-06-21days on market $250,000 Active 3 DOM
-
2026-06-18remarks 693-char remark
-
2026-06-18$250,000 Active 1 DOM
ⓘ Source: listings_history table (triggers on properties + properties_extension) + one-shot
backfill from property_details.listing_events for pre-trigger history.
Tax reassessment forecast GA · Resets to sale price
- Current annual tax
- $3,067 · $256/mo
- Projected year-2 tax
- $3,067 · $256/mo
- Expected delta
- $0/yr ($0/mo · 0.0%)
ⓘ Screening estimate from a state-policy table — verify with the county assessor before closing.
Climate risk First Street
- Flood 5/10 Major FEMA zone X (shaded) · 32% chance over 30 yrs
- Wildfire 3/10 Moderate
- Heat 10/10 Extreme 7 d/yr ≥106°F today · 18 d/yr by 30 yrs out
- Wind 9/10 Extreme 99% chance of damaging wind over 30 yrs
- Air quality 2/10 Low 2 unhealthy d/yr today · 2 by 30 yrs out
Nearby sold comps map
Loading sold comps map…
Walkable amenities ~0.75 mi
Loading nearby amenities…
Taxation est. · year 1
- Rental income
- $27,644
- − Mortgage interest
- −$14,004
- − Property taxes
- −$3,067
- − Insurance
- −$1,250
- − Repairs & maintenance
- −$2,212
- − Management
- −$2,212
- − Depreciation
- −$7,273
- Taxable loss
- −$2,373
- Est. tax savings @ 24.0%
- +$570
- After-tax cash flow
- $2,359/yr
For passive investors: Depreciation is non-cash, so a rental often shows a tax loss while cash-flowing — sheltering income. Rental losses are passive: they offset passive income freely, and up to $25,000/yr can offset ordinary (W-2) income if you actively participate and your MAGI is under $100k (phasing out to $0 by $150k); unused losses carry forward. On sale, claimed depreciation is recaptured at up to 25%, and gains may owe capital-gains tax (a 1031 exchange can defer both). Figures are a year-1 estimate at your 24.0% rate — not tax advice; consult a CPA.
Schools (NCES district)
- District
- Savannah-Chatham County
- NCES district ID
- 1301020
- Math proficiency
- 20% ▼ -11.00%
- Reading proficiency
- 26% ▼ -5.00%
- Median HH income
- $47,443
- Composite
- 20.14/100
- National rank
- #8639
- State rank
- #134 of 174 in GA
Livability — Whitemarsh Island
- Score
- 69/100
- State rank
- #127
- US rank
- #9034
Category grades
Schools grade is shown separately in the Schools card above.
Census & demographics
- Census place
- Whitemarsh Island, GA
- County
- Chatham County · 271,602 people
- Metro
- Savannah, GA
- Population (ZIP)
- 22,214
- Household income
- $97,807
- Rent vs Own
- Severe rent burden
- 437.0
Population outlook (Chatham County) Hauer SSP2
- Today (2025)
- 332,584 people
- By 2030
- 355,508 · +6.9%
- By 2040
- 400,030 · +20.3%
- By 2050
- 443,019 · +33.2%
- By 2075
- 534,579 · +60.7%
- By 2100
- 583,863 · +75.6%
Race, ethnicity, and origin ACS 2023
- Neighborhood character
- Predominantly White (88%)
- Race & ethnicity
- White 88% Two or more races 5% Hispanic / Latino 3% Black 3% Asian 2%
- Common ancestry
- Slovak 4% Lithuanian 3% Italian 2%
- Foreign-born
- 4% · Canada, China, Vietnam
- Languages at home
- 95% English-only · Spanish 2% Other Indo-European 1% German/W. Germanic 1%
Political lean MEDSL · Chatham
- 2024 margin
- D (+18.0) · D 58.6% · R 40.6%
- 2008→2024 swing
- +3.6pp toward D · 2008: 14.4pp · 2024: 18.0pp
- All cycles
- 2024: D+18.0 2020: D+18.8 2016: D+14.5 2012: D+12.0 2008: D+14.4
Not yet ingested
- Civics
- —
Market trends
- HPI YoY
- ▼ -336.14%
- Current HPI
- 319.8615
- Rent YoY
- ▲ 1.84%
- Metro
- Savannah, GA
- State GDP YoY
- ▲ 2.66%
- F500 in state
- 28
Industry mix (Fortune 500 HQ in GA)
| Industry | F500 HQs | Revenue |
|---|---|---|
| Paper / Packaging | 2 | $29B |
|
||
| Retail | 1 | $160B |
|
||
| Transportation / Logistics | 1 | $91B |
|
||
| Airlines | 1 | $62B |
|
||
| Consumer Goods | 1 | $47B |
|
||
| Utilities | 1 | $25B |
|
||
Price history
+124.8% since first listed6 events — show timeline
- 2026-06-18 Listed $250,000 Hive MLS
- 2009-06-22 Sold (MLS) $126,160 Hive MLS
- 2008-10-28 Listed $126,160 Hive MLS
- 2005-01-06 Sold (Public Records) $163,900 Public Records
- 2003-11-21 Sold (Public Records) $139,900 Public Records
- 2001-12-31 Sold (Public Records) $111,200 Public Records
Property tax history
+4.8%/yrLatest (2025): $3,067 · +1.1% YoY. Source: county tax records.
Cash-flow waterfall
monthlySold comps — $/sqft
last 12 mo · ≤1 miLoading sold comps…