 Duplex
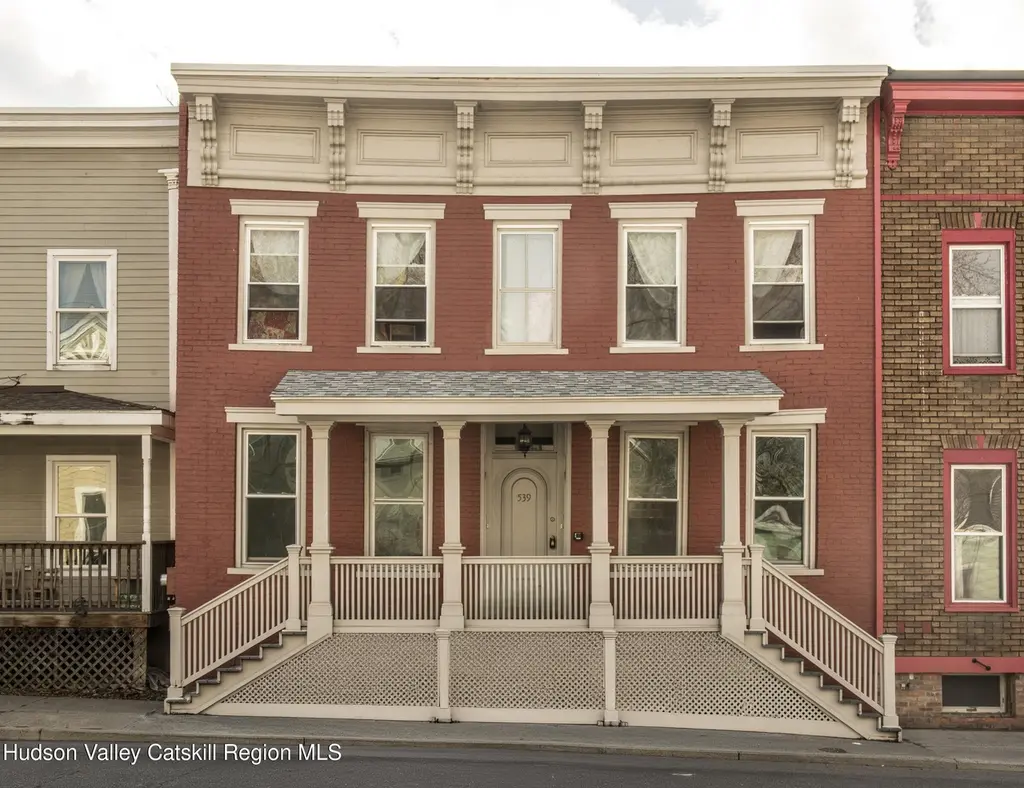
539 State St · Hudson, NY
Flood risk 1/10 · Minimal
- FEMA flood zone
- X
- Chance of flooding over 30 yrs
- 0.0%
- Est. flood insurance / yr
- $473 – $860
Fire risk 4/10 · Minor
- Est. fire insurance / yr
- $691 – $1,283
Heat risk 4/10 · Minor
- Hot days now (above 98°F)
- 7 days/yr
- Hot days in 30 yrs
- 17 days/yr
Wind risk 3/10 · Minor
- Chance of severe wind over 30 yrs
- 8.0%
Air-quality risk 2/10 · Minimal
- Unhealthy air days now
- 0 days/yr
- Unhealthy air days in 30 yrs
- 1 days/yr
Risk factors via First Street. Map © Google.
Why this score? — see what drove the C- grade
The composite is a weighted blend of 9 inputs, each scored 0–100. Each bar is that input's sub-score; the figure is the points it added to the 100-point composite (weight × sub-score).
- Cash flow +17.1/30.0
- Appreciation +10.0/10.0
- DSCR +5.3/10.0
- Rent growth +5.0/5.0
- 1% rule +4.5/10.0
- Schools +3.6/10.0
- Livability +3.5/5.0
- Condition / age +2.5/5.0
- ARV discount +0.0/15.0
$550,000
🖨 Deal sheet 📄 Offer letter ✓ Due diligence
Multi-family units
County records classify this as Multi-Family (2-4 Unit). Listing-text estimate: 2 units. confirmed
Listing remarks
Whether you are an investor looking for a high-yield asset or a buyer seeking the ultimate ''house-hack'' in the Hudson Valley, a duplex on State Street offers a premier opportunity in one of New York's most sought-after river towns. This recently renovated, two unit building has two bedroom one bathroom apartments with porches, a rear garden and an off street, one car alley garage that is 440 square feet and can be used as studio if not your car. State Street is the quiet, residential backbone of Hudson, sitting just two blocks parallel to the locally-famous Warren Street. This location provides the perfect balance: the tranquility of a historic neighborhood with immediate, ''no-car-needed
Key facts
- Rear garden
- Off street garage
- Recently renovated
Tags
Neighborhood map
What this means for you Summary
Snapshot
- This is a 2 × 2-bed/1.0-bath units multifamily listed at $550k.
Deal economics
- At list price, monthly cash flow is $378 ($5k/yr) — positive. Per door: $189/mo.
- The deal already cash-flows at list — no discount required.
- To meet the 1% rule (rent ≥ 1% of price), the offer needs to be $522k (5.1% below list).
- Recommended offer: $522k (5.1% below list) — sets the bar for 1% rule.
- Cap rate 7.1% vs local median 3.3% in Hudson — top-decile yield for the area; either an underpriced asset or a hidden risk that comps aren't pricing in. Stress-test before assuming the spread holds.
Location & tenants
- Location reads 70/100 on livability (#430 in NY) — a middle-class / working-renter tenant base. Strengths: amenities A+, health & safety A+; Watch: schools C-, commute F, employment F.
- Hudson City School District (town): math 38% / reading 47% proficiency, ranked #494 of 590 in NY (top 84%) — families likely to look elsewhere, expect single-tenant / working-renter base with shorter leases.
- Market conditions: Rents rising fast (+10.9%/yr); 161 active listings in the ZIP; 3 comparable units currently listed for rent nearby; rentals at typical pace (median 24d on market — plan ~3-4 weeks tenant-placement turnaround); 136 units permitted in Columbia County in 2024 (0 in 5+ unit buildings).
- At $5,220/mo this rent would consume 86% of the median local household income ($73k/yr) (locally 1083% of renters already pay >50% of income on rent) — very limited rent-growth headroom before tenants either downsize or default.
Forward outlook
- In year one you build about $59k of equity ($4k loan paydown + $55k appreciation (10.0% local appreciation)).
- Columbia County population projected at -22% by 2050 — secular population decline; favor cash flow + early exit over multi-decade hold.
- At projected returns (10.0% appreciation + 8.0% rent growth), your $154k cash investment doubles in ~3 years — after that, you're playing with house money.
- By year 2, paydown + projected appreciation supports a ~$95k cash-out refi (75% LTV) — recoverable capital for the next deal without selling this one.
Negotiation context
- Only 13 days on market — expect competitive offers; lowballing is unlikely to land.
- 4 sale attempts since 3y ago with the ask held roughly flat each time — persistent listings suggest the price (not the market) is what's stuck; bring a comps-based counter.
- Current owner paid $250k; list at $550k implies a 120% gain — meaningful room to come down on a strong offer.
Risks & watch-outs
- Watch-outs: built in 1890 — expect roof / HVAC / electrical / plumbing capex.
Questions for the listing agent
- Can we see the unit-by-unit rent roll, current vacancy, and any below-market leases? What's the average tenancy length?
- What capital expenditures (roof, boiler, parking lot, exteriors) have been made in the last 5 years, and what's planned in the next 2?
- Built in 1890 — when were the roof, HVAC, electrical panel, plumbing, and water heater last replaced?
- Is there a deadline driving the sale (1031 exchange, divorce, estate, relocation)? That informs how much negotiation room exists.
- What's the average days-on-market for RENTAL listings here right now (not sales)? A rising rental-DOM trend means longer vacancies and softer asking-rent achievability than the comps imply.
- What's the recent tenant-quality profile in this submarket — average credit score on applications, eviction rate, late-payment / NSF rate, and stable-employment percentage? A property-management company in the area should have these aggregated.
- How much new apartment / multifamily construction is in the pipeline within 1–3 miles? Heavy new supply (>2% of stock underway) typically softens rents 12–24 months out; light construction supports rent growth.
Investment metrics
- 1% rule
- 0.95% ✗
- Cap rate
- 7.12%
- Cash-on-cash
- 2.95%
- DSCR
- 1.13
- GRM
- 8.8
CMA / ARV
- ARV (on-the-fly)
- $397,440
- Comps found
- 6
Show comp detail 6 sales within ~0.75 mi
| Address | Dist | Beds/Ba | Sqft | Sold | Price | $/sf | Match |
|---|---|---|---|---|---|---|---|
| 534 Washington St | 0.14mi | 4/2.0 | 1,990 (+4%) | 14mo | $469,000 | $236 | 75 |
| 5 Worth Ave | 0.38mi | 4/— | 1,888 (-2%) | 15mo | $300,000 | $159 | 68 |
| 19 8th St | 0.25mi | 3/2.0 (-1) | 2,058 (+7%) | 4mo | $799,000 | $388 | 67 |
| 316 State St | 0.39mi | 4/— | 2,112 (+10%) | 6mo | $425,000 | $201 | 60 |
| 309 - 311 Union St | 0.43mi | 4/— | 2,088 (+9%) | 18mo | $380,000 | $182 | 50 |
| 28 Glenwood Blvd | 0.63mi | 3/3.0 (-1) | 1,852 (-4%) | 19mo | $382,500 | $207 | 40 |
Match score weights: distance 35% · size 25% · config 20% · recency 20%. Top-matched comps best support the ARV.
Projected returns pro-forma
10.0% appreciation · 8.0% rent growth · sell at horizon
- IRR
- 28.3%
- Equity multiple
- 3.28×
- Total profit
- $351,281
- Equity at exit
- $495,484
- IRR
- 26.1%
- Equity multiple
- 8.04×
- Total profit
- $1,083,939
- Equity at exit
- $1,068,529
Cash invested: $154,000 (down + closing). Projections, not guarantees.
Landlord ↔ Tenant lean methodology
- Overall (STATE)
- 15 Strongly Tenant-Friendly
- State New York
- 15 Strongly Tenant-Friendly · D+10
- County
- — inherits STATE
- City
- — inherits STATE
ZIP-level market 12534
- Home prices YoY
- 5.6%
- Rents YoY
- 10.9%
- Active inventory
- 161
- Price-to-rent
- 17.6×
Monthly cashflow live
- Estimated rent
- $5,220 high interval (Pro) →
- Mortgage (P&I)
- −$2,884
- Tax from tax record
- −$632 /mo · $7,583/yr
- Insurance
- −$229
- HOA
- −$0
- Vacancy / Maint / Mgmt
- −$1,096
- Net cashflow
- $378
Break-even live
2-unit breakdown (identical units grouped — click to expand)
| Units | Beds | Baths | Est. rent |
|---|---|---|---|
| 2× units | 2 | 1 | $5,220 |
| #1 | 2 | 1 | $2,610 |
| #2 | 2 | 1 | $2,610 |
| Total (2 units) | $5,220 | ||
UW: 25.0% down · 7.5% · 30yr · 1.5% tax · 5.0% vac · 8.0% maint · 8.0% mgmt
Financing live
Cash to close
- Down payment
- $137,500
- Closing costs
- $16,500
- Reserves months
- —
- Total cash needed
- —
Loan-product check · same deal, 3 products live
Conventional
25% down · 7.5% · 30yr
- Down + closing
- —
- Monthly P&I
- —
- Monthly cashflow
- —
- DSCR
- —
- Eligible?
- —
Personal DTI + credit; lowest rate.
DSCR
20% down · 8.5% · 30yr
- Down + closing
- —
- Monthly P&I
- —
- Monthly cashflow
- —
- DSCR
- —
- Eligible?
- —
No personal income docs; deal must DSCR.
Hard money
10% down · 12.0% · 12mo
- Down + closing
- —
- Monthly P&I
- —
- Monthly cashflow
- —
- DSCR
- —
- Eligible?
- —
Short-term bridge; refi at stabilization.
Rent comps 3 comps
| Address | Beds | Baths | Sqft | Rent | $/sqft | DOM | Units | Dist |
|---|---|---|---|---|---|---|---|---|
| 437 State St Hudson, NY | 3.0 | 3.0 | 1800 | $8,000 | $4.44 | 44d | 1 | 0.13mi |
| 258 Warren St Hudson, NY | 3.0 | 2.0 | 2464 | $5,300 | $2.15 | 23d | 1 | 0.43mi |
| 227 Warren St Unit 3 Hudson, NY | 3.0 | 1.0 | 1400 | $2,600 | $1.86 | 23d | 1 | 0.51mi |
Listing history 13 events
-
2026-04-09status Pending
-
2026-04-05historical Active Under Contract
-
2026-03-26$550,000 Active
-
2024-08-01historical $2,300
-
2024-07-26$2,300
-
2024-04-28historical $2,300
-
2024-04-02$2,300
-
2024-04-01historical $2,300
-
2023-12-22$2,300
-
2016-10-06soldstatus $250,000
-
2006-10-25soldstatus $240,000
-
2002-12-13soldstatus $83,600
-
2002-06-07soldstatus $50,000
ⓘ Source: listings_history table (triggers on properties + properties_extension) + one-shot
backfill from property_details.listing_events for pre-trigger history.
Tax reassessment forecast NY · Partial reset (capped growth)
- Current annual tax
- $7,583 · $632/mo
- Projected year-2 tax
- $8,439 · $703/mo
- Expected delta
- +$856/yr (+$71/mo · 11.3%)
ⓘ Screening estimate from a state-policy table — verify with the county assessor before closing.
Climate risk First Street
- Flood 1/10 Low FEMA zone X · 0% chance over 30 yrs
- Wildfire 4/10 Moderate
- Heat 4/10 Moderate 7 d/yr ≥98°F today · 17 d/yr by 30 yrs out
- Wind 3/10 Moderate 8% chance of damaging wind over 30 yrs
- Air quality 2/10 Low 0 unhealthy d/yr today · 1 by 30 yrs out
Nearby sold comps map
Loading sold comps map…
Walkable amenities ~0.75 mi
Loading nearby amenities…
Taxation est. · year 1
- Rental income
- $62,640
- − Mortgage interest
- −$30,809
- − Property taxes
- −$7,583
- − Insurance
- −$2,750
- − Repairs & maintenance
- −$5,011
- − Management
- −$5,011
- − Depreciation
- −$16,000
- Taxable loss
- −$4,524
- Est. tax savings @ 24.0%
- +$1,086
- After-tax cash flow
- $5,627/yr
For passive investors: Depreciation is non-cash, so a rental often shows a tax loss while cash-flowing — sheltering income. Rental losses are passive: they offset passive income freely, and up to $25,000/yr can offset ordinary (W-2) income if you actively participate and your MAGI is under $100k (phasing out to $0 by $150k); unused losses carry forward. On sale, claimed depreciation is recaptured at up to 25%, and gains may owe capital-gains tax (a 1031 exchange can defer both). Figures are a year-1 estimate at your 24.0% rate — not tax advice; consult a CPA.
Schools (NCES district)
- District
- Hudson City School District
- NCES district ID
- 3614940
- Math proficiency
- 38% ▲ 4.00%
- Reading proficiency
- 47% ▲ 7.00%
- Median HH income
- $44,663
- Composite
- 36.03/100
- National rank
- #4779
- State rank
- #494 of 590 in NY
Livability — Hudson
- Score
- 70/100
- State rank
- #430
- US rank
- #7443
Category grades
Schools grade is shown separately in the Schools card above.
Census & demographics
- Census place
- Hudson, NY
- County
- Columbia County · 17,176 people
- City population
- 17,176
- Metro
- Hudson, NY
- Population (ZIP)
- 17,176
- Household income
- $72,741
- Rent vs Own
- Severe rent burden
- 1083.0
Population outlook (Columbia County) Hauer SSP2
- Today (2025)
- 58,662 people
- By 2030
- 56,557 · -3.6%
- By 2040
- 51,324 · -12.5%
- By 2050
- 45,790 · -21.9%
- By 2075
- 35,232 · -39.9%
- By 2100
- 25,846 · -55.9%
Race, ethnicity, and origin ACS 2023
- Neighborhood character
- Predominantly White (74%)
- Race & ethnicity
- White 74% Two or more races 7% Black 7% Hispanic / Latino 7% Asian 6%
- Hispanic origin (detail)
- Mexican 2% Puerto Rican 1%
- Common ancestry
- Lithuanian 4% Romanian 4% Iranian 3%
- Foreign-born
- 10% · Canada, China
- Languages at home
- 88% English-only · Spanish 5% Other Indo-European 3% Chinese 1%
Political lean MEDSL · Columbia
- 2024 margin
- D (+14.7) · D 57.4% · R 42.6%
- 2008→2024 swing
- +1.3pp toward D · 2008: 13.4pp · 2024: 14.7pp
- All cycles
- 2024: D+14.7 2020: D+16.7 2016: D+1.4 2012: D+11.7 2008: D+13.4
Not yet ingested
- Civics
- —
Market trends
- HPI YoY
- ▲ 25.98%
- Current HPI
- 490.0412
- Rent YoY
- ▲ 10.88%
- Metro
- Hudson, NY
- State GDP YoY
- ▲ 2.60%
- F500 in state
- 92
Industry mix (Fortune 500 HQ in NY)
| Industry | F500 HQs | Revenue |
|---|---|---|
| Financial Services | 10 | $950B |
|
||
| Consumer Goods | 9 | $162B |
|
||
| Insurance | 4 | $225B |
|
||
| Telecommunications | 2 | $144B |
|
||
| Pharmaceuticals | 2 | $112B |
|
||
| Media / Entertainment | 2 | $69B |
|
||
Price history
+1000.0% since first listed13 events — show timeline
- 2026-04-09 Pending — HVCRMLS
- 2026-04-05 Contingent — HVCRMLS
- 2026-03-26 Listed $550,000 HVCRMLS
- 2024-08-01 Rental Removed $2,300 CGNDMLS
- 2024-07-26 Listed for Rent $2,300 CGNDMLS
- 2024-04-28 Rental Removed $2,300 CGNDMLS
- 2024-04-02 Listed for Rent $2,300 CGNDMLS
- 2024-04-01 Rental Removed $2,300 CGNDMLS
- 2023-12-22 Listed for Rent $2,300 CGNDMLS
- 2016-10-06 Sold (Public Records) $250,000 Public Records
- 2006-10-25 Sold (Public Records) $240,000 Public Records
- 2002-12-13 Sold (Public Records) $83,600 Public Records
- 2002-06-07 Sold (Public Records) $50,000 Public Records
Property tax history
+16.0%/yrLatest (2025): $7,583 · -3.7% YoY. Source: county tax records.
Cash-flow waterfall
monthlySold comps — $/sqft
last 12 mo · ≤1 miLoading sold comps…