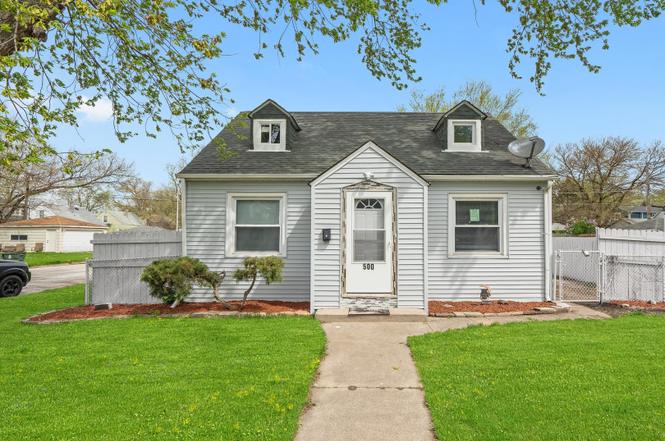
500 Engle St · Dolton, IL
Flood risk 4/10 · Minor
- FEMA flood zone
- X (unshaded)
- Chance of flooding over 30 yrs
- 0.22%
- Est. flood insurance / yr
- $507 – $1,088
Fire risk 1/10 · Minimal
- Est. fire insurance / yr
- $804 – $1,492
Heat risk 3/10 · Minor
- Hot days now (above 101°F)
- 7 days/yr
- Hot days in 30 yrs
- 15 days/yr
Wind risk 2/10 · Minimal
- Chance of severe wind over 30 yrs
- —
Air-quality risk 4/10 · Minor
- Unhealthy air days now
- 4 days/yr
- Unhealthy air days in 30 yrs
- 5 days/yr
Risk factors via First Street. Map © Google.
Why this score? — see what drove the C- grade
The composite is a weighted blend of 9 inputs, each scored 0–100. Each bar is that input's sub-score; the figure is the points it added to the 100-point composite (weight × sub-score).
- Cash flow +21.9/30.0
- ARV discount +7.5/15.0
- DSCR +7.0/10.0
- 1% rule +5.5/10.0
- Rent growth +4.9/5.0
- Livability +3.7/5.0
- Condition / age +2.5/5.0
- Schools +0.7/10.0
- Appreciation +0.0/10.0
$134,900
🖨 Deal sheet (PDF) 📄 Offer letter ✓ Due diligence
Listing remarks
Polished and Professional describe this beautifully renovated 2 bedroom 1 bath home, with spacious family room and stunning kitchen. The 1 bedroom on the 1st floor has hardwood floors and the 2nd bedroom (entire 2nd floor space), has wood laminate flooring. All bedrooms are spacious, with ceiling fan and blinds. The bathroom has been beautifully updated. You will love the modern finishes in the living room with tray ceiling, fresh paint, hardwood floors, sleek light fixtures and abundant natural light. The updated kitchen boasts sleek granite countertops, tiled back splash, new cabinetry and stainless steel appliances (refrigerator, oven and microwave oven). In addition, enjoy the family ro
Key facts
- Updated kitchen
- New cabinetry
- Granite countertops
Tags
Property features AI
Finance
- Other: Possession at closing; Earnest money held
- Financial info: Homeowner tax exemptions (2025)
- HOA & community: No master association fee required
Exterior
- Parking: Detached garage (1 garage space, 1 total parking space); Garage owned
- Utilities: Public water; Sewer: other
- Home design: Detached single-family home; 1.5-story layout; Fee simple ownership; Rehab completed in 2025; Property built approximately 81–90 years ago; Built before 1978
- Construction: Cedar construction
- Exterior features: Lot approximately 25 x 125; Lot less than 0.25 acre
Interior
- Kitchen: Eating area/table space; Custom cabinetry; Granite counters; Updated kitchen; Range, Microwave, Refrigerator (stainless steel appliances)
- Bedrooms: Two bedrooms (one on main level, one on second level)
- Flooring: Hardwood flooring in living room and master bedroom; Wood laminate flooring in family room, kitchen, second bedroom and laundry
- Bathrooms: One full bathroom
- Heating & cooling: Natural gas forced air heating; Central air conditioning
- Interior features: Five total rooms
- Laundry & utility: Main-level laundry room
Neighborhood map
What this means for you Summary
Snapshot
- This is a 2-bed/1.0-bath single-family listed at $135k.
Deal economics
- At list price, monthly cash flow is $213 ($3k/yr) — positive.
- The deal already cash-flows at list — no discount required.
- Meets the 1% rule at list price ($1k rent vs $135k).
Location & tenants
- Location reads 74/100 on livability (#263 in IL, #4,883 nationally) — a middle-class / working-renter tenant base. Strengths: commute A+, cost of living A+, housing A+; Watch: employment C-, health & safety C-, schools F.
- Thornton Twp Hsd 205 (suburban): math 7% / reading 8% proficiency, ranked #594 of 620 in IL (top 96%) — low school quality limits family demand, transient renter base, plan for 1-2y turnover.
- Market conditions: Rents rising fast (+9.7%/yr); 129 active listings in the ZIP; 5 comparable units currently listed for rent nearby; rentals leasing fast (median 4d on market — plan ~1-2 weeks tenant-placement turnaround); 6,272 units permitted in Cook County in 2024 (4,658 in 5+ unit buildings).
Forward outlook
- Local home prices are declining (-3.0%/yr); year-one equity from $933 of loan paydown is wiped out by about $4k of value loss. Plan a longer hold.
- At projected returns (-3.0% appreciation + 8.0% rent growth), your $38k cash investment doubles in ~9 years — after that, you're playing with house money.
Negotiation context
- Only 11 days on market — expect competitive offers; lowballing is unlikely to land.
- 11 sale attempts since 11y ago with the ask held roughly flat each time — persistent listings suggest the price (not the market) is what's stuck; bring a comps-based counter.
- Current owner paid $19k; list at $135k implies a 603% gain — meaningful room to come down on a strong offer.
Risks & watch-outs
- Watch-outs: built in 1939 — expect roof / HVAC / electrical / plumbing capex.
Questions for the listing agent
- Built in 1939 — when were the roof, HVAC, electrical panel, plumbing, and water heater last replaced?
- Is there a deadline driving the sale (1031 exchange, divorce, estate, relocation)? That informs how much negotiation room exists.
- Schools are F-rated, which usually means shorter tenancies and higher turnover. Who's the typical renter profile here, and what's been the actual vacancy rate?
- Crime grade is D in this area — have there been break-ins, vandalism, or insurance claims at this property in the last 3 years? What carrier currently insures it and at what premium?
- What's the average days-on-market for RENTAL listings here right now (not sales)? A rising rental-DOM trend means longer vacancies and softer asking-rent achievability than the comps imply.
- What's the recent tenant-quality profile in this submarket — average credit score on applications, eviction rate, late-payment / NSF rate, and stable-employment percentage? A property-management company in the area should have these aggregated.
- How much new for-sale + rental construction is in the pipeline within 1–3 miles? Heavy new supply typically softens prices + rents 12–24 months out; constrained supply supports both.
Investment metrics
- 1% rule
- 1.05% ✓
- Cap rate
- 8.19%
- Cash-on-cash
- 6.77%
- DSCR
- 1.30
- GRM
- 7.9
CMA / ARV
- ARV (on-the-fly)
- $72,100
- Comps found
- 1
Show comp detail 1 sale within ~0.75 mi
| Address | Dist | Beds/Ba | Sqft | Sold | Price | $/sf | Match |
|---|---|---|---|---|---|---|---|
| 14403 Irving Ave | 0.41mi | 3/1.0 (+1) | 680 (-3%) | 23mo | $70,000 | $103 | 52 |
Match score weights: distance 35% · size 25% · config 20% · recency 20%. Top-matched comps best support the ARV.
Projected returns pro-forma
-3.0% appreciation · 8.0% rent growth · sell at horizon
- IRR
- -0.5%
- Equity multiple
- 0.98×
- Total profit
- $-753
- Equity at exit
- $20,114
- IRR
- 13.7%
- Equity multiple
- 2.35×
- Total profit
- $51,085
- Equity at exit
- $11,664
Cash invested: $37,772 (down + closing). Projections, not guarantees.
Landlord ↔ Tenant lean methodology
- Overall (STATE)
- 43 Moderately Tenant-Leaning
- State Illinois
- 43 Moderately Tenant-Leaning · D+7
- County
- — inherits STATE
- City
- — inherits STATE
ZIP-level market 60419
- Home prices YoY
- -25.7%
- Rents YoY
- 9.7%
- Active inventory
- 129
- Price-to-rent
- 7.9×
Monthly cashflow live
- Estimated rent
- $1,423 high interval (Pro) →
- Mortgage (P&I)
- −$707
- Tax from tax record
- −$147 /mo · $1,765/yr
- Insurance
- −$56
- HOA
- −$0
- Vacancy / Maint / Mgmt
- −$299
- Net cashflow
- $213
Break-even live
Sensitivity live
| Price | -10% $290 | -5% $251 | +0% $213 | +5% $175 | +10% $137 |
|---|---|---|---|---|---|
| Rent | -10% $101 | -5% $157 | +0% $213 | +5% $269 | +10% $326 |
| Rate | -1.0pp $281 | -0.5pp $248 | base $213 | +0.5pp $178 | +1.0pp $143 |
UW: 25.0% down · 7.5% · 30yr · 1.5% tax · 5.0% vac · 8.0% maint · 8.0% mgmt
Financing live
Cash to close
- Down payment
- $33,725
- Closing costs
- $4,047
- Reserves months
- —
- Total cash needed
- —
Loan-product check · same deal, 3 products live
Conventional
25% down · 7.5% · 30yr
- Down + closing
- —
- Monthly P&I
- —
- Monthly cashflow
- —
- DSCR
- —
- Eligible?
- —
Personal DTI + credit; lowest rate.
DSCR
20% down · 8.5% · 30yr
- Down + closing
- —
- Monthly P&I
- —
- Monthly cashflow
- —
- DSCR
- —
- Eligible?
- —
No personal income docs; deal must DSCR.
Hard money
10% down · 12.0% · 12mo
- Down + closing
- —
- Monthly P&I
- —
- Monthly cashflow
- —
- DSCR
- —
- Eligible?
- —
Short-term bridge; refi at stabilization.
Rent comps 5 comps
| Address | Beds | Baths | Sqft | Rent | $/sqft | DOM | Units | Dist |
|---|---|---|---|---|---|---|---|---|
| 15324 Doctor Martin Luther King Junior Dr Unit 1B Dolton, IL | 1.0 | 1.0 | 725 | $985 | $1.36 | 20d | 1 | 1.02mi |
| 13905 S Clark St Riverdale, IL | 1.0 | 1.0 | 685 | $1,210 | $1.77 | 8d | 6 | 1.06mi |
| 14031 S School St Riverdale, IL | 1.0 | 1.0 | 620 | $1,045 | $1.69 | 4d | 1 | 1.15mi |
| 14119 S Tracy Ave Riverdale, IL | 2.0 | 1.0 | 696 | $1,205 | $1.73 | 4d | 1 | 1.17mi |
| 455 W 144th St Unit 2W Riverdale, IL | 1.0 | 1.0 | 750 | $1,250 | $1.67 | 0d | 1 | 1.23mi |
Listing history 8 events
-
2026-06-21days on market $134,900 Active 11 DOM
-
2026-06-18days on market $134,900 Active 8 DOM
-
2026-06-17days on market $134,900 Active 7 DOM
-
2026-06-16days on market $134,900 Active 6 DOM
-
2026-06-15days on market $134,900 Active 5 DOM
-
2026-06-13days on market $134,900 Active 3 DOM
-
2026-06-13remarks 699-char remark
-
2026-06-13$134,900 Active 2 DOM
ⓘ Source: listings_history table (triggers on properties + properties_extension) + one-shot
backfill from property_details.listing_events for pre-trigger history.
Tax reassessment forecast IL · Partial reset (capped growth)
- Current annual tax
- $1,765 · $147/mo
- Projected year-2 tax
- $2,414 · $201/mo
- Expected delta
- +$648/yr (+$54/mo · 36.7%)
ⓘ Screening estimate from a state-policy table — verify with the county assessor before closing.
Climate risk First Street
- Flood 4/10 Moderate FEMA zone X (unshaded) · 22% chance over 30 yrs
- Wildfire 1/10 Low
- Heat 3/10 Moderate 7 d/yr ≥101°F today · 15 d/yr by 30 yrs out
- Wind 2/10 Low
- Air quality 4/10 Moderate 4 unhealthy d/yr today · 5 by 30 yrs out
Nearby sold comps map
Loading sold comps map…
Walkable amenities ~0.75 mi
Loading nearby amenities…
Taxation est. · year 1
- Rental income
- $17,073
- − Mortgage interest
- −$7,556
- − Property taxes
- −$1,765
- − Insurance
- −$674
- − Repairs & maintenance
- −$1,366
- − Management
- −$1,366
- − Depreciation
- −$3,924
- Taxable income
- $420
- Est. tax owed @ 24.0%
- −$101
- After-tax cash flow
- $2,458/yr
For passive investors: Depreciation is non-cash, so a rental often shows a tax loss while cash-flowing — sheltering income. Rental losses are passive: they offset passive income freely, and up to $25,000/yr can offset ordinary (W-2) income if you actively participate and your MAGI is under $100k (phasing out to $0 by $150k); unused losses carry forward. On sale, claimed depreciation is recaptured at up to 25%, and gains may owe capital-gains tax (a 1031 exchange can defer both). Figures are a year-1 estimate at your 24.0% rate — not tax advice; consult a CPA.
Schools (NCES district)
- District
- Thornton Twp Hsd 205
- NCES district ID
- 1738970
- Math proficiency
- 7% ▬ 0.00%
- Reading proficiency
- 8% ▼ -2.00%
- Median HH income
- $43,392
- Composite
- 6.92/100
- National rank
- #9976
- State rank
- #594 of 620 in IL
Livability — Dolton
- Score
- 74/100
- State rank
- #263
- US rank
- #4883
Category grades
Schools grade is shown separately in the Schools card above.
Census & demographics
- Census place
- Dolton, IL
- County
- Cook County · 4,486,803 people
- City population
- 20,825
- Metro
- Chicago-Naperville-Elgin, IL-IN-WI
- Population (ZIP)
- 20,825
- Household income
- $57,887
- Rent vs Own
- Severe rent burden
- 919.0
Population outlook (Cook County) Hauer SSP2
- Today (2025)
- 5,347,519 people
- By 2030
- 5,357,703 · +0.2%
- By 2040
- 5,324,924 · -0.4%
- By 2050
- 5,230,762 · -2.2%
- By 2075
- 4,785,735 · -10.5%
- By 2100
- 4,188,836 · -21.7%
Race, ethnicity, and origin ACS 2023
- Neighborhood character
- Predominantly Black (91%)
- Race & ethnicity
- Black 91% White 4% Two or more races 3% Hispanic / Latino 1%
- Common ancestry
- Romanian 1% Hispanic 1%
- Foreign-born
- 3% · Canada
- Languages at home
- 95% English-only · French/Haitian/Cajun 2% Spanish 1%
Political lean MEDSL · Cook
- 2024 margin
- Solid D (+42.0) · D 70.4% · R 28.4% · Other 1.2%
- 2008→2024 swing
- -11.4pp toward R · 2008: 53.4pp · 2024: 42.0pp
- All cycles
- 2024: D+42.0 2020: D+50.3 2016: D+53.0 2012: D+49.4 2008: D+53.4
Not yet ingested
- Civics
- —
Market trends
- HPI YoY
- ▼ -66.88%
- Current HPI
- 193.2346
- Rent YoY
- ▲ 9.65%
- Metro
- Chicago-Naperville-Elgin, IL-IN-WI
- State GDP YoY
- ▲ 1.59%
- F500 in state
- 60
Industry mix (Fortune 500 HQ in IL)
| Industry | F500 HQs | Revenue |
|---|---|---|
| Insurance | 4 | $201B |
|
||
| Consumer Goods | 4 | $87B |
|
||
| Industrial Machinery | 3 | $64B |
|
||
| Healthcare | 2 | $55B |
|
||
| Retail / Pharmacy | 1 | $148B |
|
||
| Agriculture / Food | 1 | $86B |
|
||
Price history
+315.1% since first listed34 events — show timeline
- 2026-06-10 Listed $134,900 MRED as Distributed by MLS Grid
- 2026-05-13 Relisted — MRED as Distributed by MLS Grid
- 2026-05-13 Listing Removed — MRED as Distributed by MLS Grid
- 2026-05-07 Price Changed — MRED as Distributed by MLS Grid
- 2026-05-07 Contingent — MRED as Distributed by MLS Grid
- 2026-04-30 Price Changed — MRED as Distributed by MLS Grid
- 2026-04-27 Relisted — MRED as Distributed by MLS Grid
- 2026-04-22 Price Changed — MRED as Distributed by MLS Grid
- 2026-04-22 Contingent — MRED as Distributed by MLS Grid
- 2026-04-07 Price Changed — MRED as Distributed by MLS Grid
- 2026-04-06 Relisted — MRED as Distributed by MLS Grid
- 2026-03-19 Contingent — MRED as Distributed by MLS Grid
- 2026-02-18 Listed — MRED as Distributed by MLS Grid
- 2026-01-10 Listing Removed — MRED as Distributed by MLS Grid
- 2025-12-12 Relisted — MRED as Distributed by MLS Grid
- 2025-11-17 Contingent — MRED as Distributed by MLS Grid
- 2025-10-25 Listed — MRED as Distributed by MLS Grid
- 2025-10-21 Listing Removed — MRED as Distributed by MLS Grid
- 2025-08-30 Relisted — MRED as Distributed by MLS Grid
- 2025-08-25 Contingent — MRED as Distributed by MLS Grid
- 2025-08-19 Price Changed — MRED as Distributed by MLS Grid
- 2025-08-04 Listed — MRED as Distributed by MLS Grid
- 2025-07-30 Listing Removed — MRED as Distributed by MLS Grid
- 2025-06-07 Price Changed — MRED as Distributed by MLS Grid
- 2025-05-12 Price Changed — MRED as Distributed by MLS Grid
- 2025-04-30 Listed — MRED as Distributed by MLS Grid
- 2015-06-12 Sold (MLS) $19,200 MRED as Distributed by MLS Grid
- 2015-06-01 Pending — MRED as Distributed by MLS Grid
- 2015-05-27 Listing Removed — MRED as Distributed by MLS Grid
- 2015-05-07 Price Changed $22,500 MRED as Distributed by MLS Grid
- 2015-04-06 Price Changed $25,900 MRED as Distributed by MLS Grid
- 2015-03-04 Listed $27,500 MRED as Distributed by MLS Grid
- 1999-11-30 Sold (Public Records) $32,500 Public Records
- 1999-11-30 Sold (Public Records) $32,500 Public Records
Property tax history
-3.2%/yrLatest (2023): $1,765 · +80.7% YoY. Source: county tax records.
Cash-flow waterfall
monthlySold comps — $/sqft
last 12 mo · ≤1 miLoading sold comps…