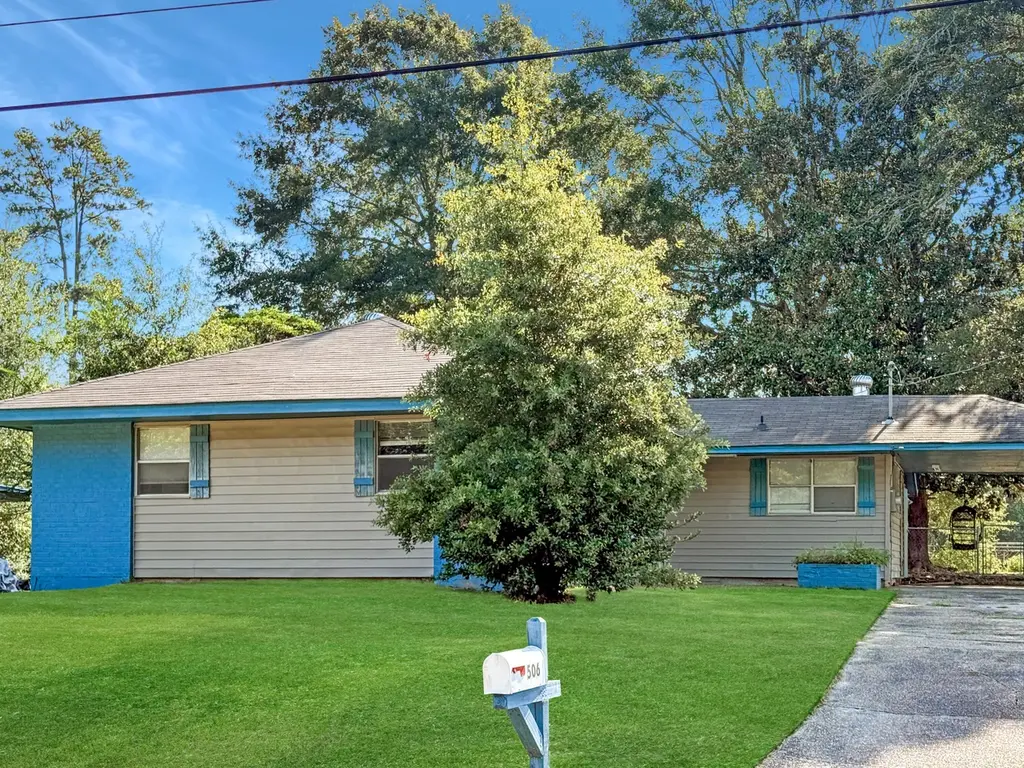
506 Hillcrest Rd · DeRidder, LA
Flood risk 1/10 · Minimal
- FEMA flood zone
- X (unshaded)
- Chance of flooding over 30 yrs
- 0.0%
- Est. flood insurance / yr
- $507 – $1,088
Fire risk 2/10 · Minimal
- Est. fire insurance / yr
- $1,269 – $2,357
Heat risk 8/10 · Major
- Hot days now (above 110°F)
- 7 days/yr
- Hot days in 30 yrs
- 20 days/yr
Wind risk 8/10 · Major
- Chance of severe wind over 30 yrs
- 99.0%
Air-quality risk 2/10 · Minimal
- Unhealthy air days now
- 1 days/yr
- Unhealthy air days in 30 yrs
- 1 days/yr
Risk factors via First Street. Map © Google.
Why this score? — see what drove the B grade
The composite is a weighted blend of 9 inputs, each scored 0–100. Each bar is that input's sub-score; the figure is the points it added to the 100-point composite (weight × sub-score).
- Cash flow +30.0/30.0
- ARV discount +13.2/15.0
- DSCR +10.0/10.0
- 1% rule +7.9/10.0
- Livability +3.6/5.0
- Schools +3.0/10.0
- Rent growth +2.5/5.0
- Condition / age +2.5/5.0
- Appreciation +0.0/10.0
$110,000
🖨 Deal sheet 📄 Offer letter ✓ Due diligence
Listing remarks MLS
Charming 3 bedroom, 1.5 bath home offering great potential as an investment property or a perfect starter home. The property features a spacious floor plan with comfortable living areas and a functional layout. The large backyard provides plenty of room for outdoor activities, gardening, or future expansion. With its solid structure and living space, this home is a wonderful opportunity to add personal touches and create lasting value.
Key facts
- Large backyard
- Spacious floor plan
- Functional layout
Tags
Neighborhood map
What this means for you Summary
Snapshot
- This is a 3-bed/1.0-bath single-family listed at $110k.
Deal economics
- At list price, monthly cash flow is $441 ($5k/yr) — positive.
- The deal already cash-flows at list — no discount required.
- Meets the 1% rule at list price ($1k rent vs $110k).
- Recommended offer: $97k (12.0% below list) — sets the bar for market timing.
- Cap rate 11.1% vs local median 4.8% in DeRidder — top-decile yield for the area; either an underpriced asset or a hidden risk that comps aren't pricing in. Stress-test before assuming the spread holds.
Location & tenants
- Location reads 72/100 on livability (#43 in LA) — a middle-class / working-renter tenant base. Strengths: cost of living A+, housing A+, health & safety A+; Watch: amenities F, commute F, employment D-.
- Beauregard Parish (rural): math 30% / reading 41% proficiency, ranked #32 of 98 in LA (top 33%) — families likely to look elsewhere, expect single-tenant / working-renter base with shorter leases.
- Market conditions: 241 active listings in the ZIP; 83 units permitted in Beauregard Parish in 2024 (0 in 5+ unit buildings).
Forward outlook
- Local home prices are declining (-3.0%/yr); year-one equity from $761 of loan paydown is wiped out by about $3k of value loss. Plan a longer hold.
- At projected returns (-3.0% appreciation + 3.0% rent growth), your $31k cash investment doubles in ~7 years — after that, you're playing with house money.
Negotiation context
- It's been on market 277 days — a 12% lower offer ($97k) is reasonable based on typical stale-listing flexibility.
- 3 sale attempts since 14y ago; this cycle's ask has dropped $10k (8%) from the opening price — seller is motivated, your offer sets the floor, not the list.
- Current owner paid $35k; list at $110k implies a 212% gain — meaningful room to come down on a strong offer.
Risks & watch-outs
- Climate carrying-cost: severe wind risk, 99% chance of damaging wind over 30y; extreme-heat days projected 7→20/yr by 2055 (HVAC capex compounding) — expect insurance premiums to compound above CPI over the hold.
Questions for the listing agent
- It's been on market 277 days. Have you received any prior offers? Is the seller open to a 12% concession, seller financing, or rate buy-down credit?
- Built in 1969 — when were the roof, HVAC, electrical panel, plumbing, and water heater last replaced?
- Why hasn't it sold? Are there any deal-killer items the seller is aware of (foundation, flood, title, zoning, code violations)?
- Is there a deadline driving the sale (1031 exchange, divorce, estate, relocation)? That informs how much negotiation room exists.
- Schools are B-rated — typically a magnet for longer-tenancy family renters. What's the average tenant stay here, and is there a school-zone premium baked into asking?
- What's the average days-on-market for RENTAL listings here right now (not sales)? A rising rental-DOM trend means longer vacancies and softer asking-rent achievability than the comps imply.
- What's the recent tenant-quality profile in this submarket — average credit score on applications, eviction rate, late-payment / NSF rate, and stable-employment percentage? A property-management company in the area should have these aggregated.
- How much new for-sale + rental construction is in the pipeline within 1–3 miles? Heavy new supply typically softens prices + rents 12–24 months out; constrained supply supports both.
Investment metrics
- 1% rule
- 1.29% ✓
- Cap rate
- 11.10%
- Cash-on-cash
- 17.18%
- DSCR
- 1.76
- GRM
- 6.5
CMA / ARV
- ARV (median comp)
- $126,024
- List price
- $110,000
- Delta
- -12.71%
- Verdict
- UNDERPRICED
- Comps
- 20 within 1.0 mi
Show comp detail 6 sales within ~0.75 mi
| Address | Dist | Beds/Ba | Sqft | Sold | Price | $/sf | Match |
|---|---|---|---|---|---|---|---|
| 214 Cain Ave | 0.26mi | 3/2.0 | 1,400 (-7%) | 1mo | $129,900 | $93 | 70 |
| 409 Hillcrest Rd | 0.08mi | 4/2.0 (+1) | 1,624 (+8%) | 14mo | $185,000 | $114 | 64 |
| 904 Cook Dr | 0.13mi | 4/2.0 (+1) | 1,300 (-14%) | 4mo | $160,000 | $123 | 58 |
| 1289 Miller St | 0.69mi | 3/2.0 | 1,530 (+1%) | 10mo | $237,000 | $155 | 54 |
| 406 Hillcrest Rd | 0.08mi | 3/2.0 | 1,302 (-14%) | 20mo | $75,000 | $58 | 52 |
| 310 Parkview Ave | 0.23mi | 4/2.5 (+1) | 1,302 (-14%) | 23mo | $128,000 | $98 | 36 |
Match score weights: distance 35% · size 25% · config 20% · recency 20%. Top-matched comps best support the ARV.
Projected returns pro-forma
-3.0% appreciation · 3.0% rent growth · sell at horizon
- IRR
- 8.5%
- Equity multiple
- 1.33×
- Total profit
- $10,224
- Equity at exit
- $16,401
- IRR
- 17.7%
- Equity multiple
- 2.46×
- Total profit
- $44,936
- Equity at exit
- $9,511
Cash invested: $30,800 (down + closing). Projections, not guarantees.
Landlord ↔ Tenant lean methodology
- Overall (STATE)
- 90 Strongly Landlord-Friendly
- State Louisiana
- 90 Strongly Landlord-Friendly · R+12
- County
- — inherits STATE
- City
- — inherits STATE
ZIP-level market 70634
- Home prices YoY
- -30.6%
- Active inventory
- 241
- Price-to-rent
- 6.5×
Monthly cashflow live
- Estimated rent
- $1,414 medium interval (Pro) →
- Mortgage (P&I)
- −$577
- Tax from tax record
- −$54 /mo · $643/yr
- Insurance
- −$46
- HOA
- −$0
- Vacancy / Maint / Mgmt
- −$297
- Net cashflow
- $441
Break-even live
UW: 25.0% down · 7.5% · 30yr · 1.5% tax · 5.0% vac · 8.0% maint · 8.0% mgmt
Financing live
Cash to close
- Down payment
- $27,500
- Closing costs
- $3,300
- Reserves months
- —
- Total cash needed
- —
Loan-product check · same deal, 3 products live
Conventional
25% down · 7.5% · 30yr
- Down + closing
- —
- Monthly P&I
- —
- Monthly cashflow
- —
- DSCR
- —
- Eligible?
- —
Personal DTI + credit; lowest rate.
DSCR
20% down · 8.5% · 30yr
- Down + closing
- —
- Monthly P&I
- —
- Monthly cashflow
- —
- DSCR
- —
- Eligible?
- —
No personal income docs; deal must DSCR.
Hard money
10% down · 12.0% · 12mo
- Down + closing
- —
- Monthly P&I
- —
- Monthly cashflow
- —
- DSCR
- —
- Eligible?
- —
Short-term bridge; refi at stabilization.
Listing history 20 events
-
2026-06-19days on market $110,000 Active 277 DOM
-
2026-06-18days on market $110,000 Active 276 DOM
-
2026-06-17days on market $110,000 Active 275 DOM
-
2026-06-16days on market $110,000 Active 274 DOM
-
2026-06-15days on market $110,000 Active 273 DOM
-
2026-06-14days on market $110,000 Active 271 DOM
-
2026-06-01days on market $110,000 Active 270 DOM
-
2026-05-31days on market $110,000 Active 269 DOM
-
2026-05-30days on market $110,000 Active 268 DOM
-
2025-12-09price $110,000 439-char remark
Show marketing remark (439 chars)
Charming 3 bedroom, 1.5 bath home offering great potential as an investment property or a perfect starter home. The property features a spacious floor plan with comfortable living areas and a functional layout. The large backyard provides plenty of room for outdoor activities, gardening, or future expansion. With its solid structure and living space, this home is a wonderful opportunity to add personal touches and create lasting value.
-
2025-10-24price $98,500 439-char remark
Show marketing remark (439 chars)
Charming 3 bedroom, 1.5 bath home offering great potential as an investment property or a perfect starter home. The property features a spacious floor plan with comfortable living areas and a functional layout. The large backyard provides plenty of room for outdoor activities, gardening, or future expansion. With its solid structure and living space, this home is a wonderful opportunity to add personal touches and create lasting value.
-
2025-09-04$120,000 Active 439-char remark
Show marketing remark (439 chars)
Charming 3 bedroom, 1.5 bath home offering great potential as an investment property or a perfect starter home. The property features a spacious floor plan with comfortable living areas and a functional layout. The large backyard provides plenty of room for outdoor activities, gardening, or future expansion. With its solid structure and living space, this home is a wonderful opportunity to add personal touches and create lasting value.
-
2022-08-09soldstatus 400-char remark
Show marketing remark (400 chars)
This home is a diamond in the rough! Original parkay flooring, open spaces, lots of natural light. This house is just waiting on you to add a little love to make it a home. It has a beautiful yard with large trees in the back, a beautiful sun porch, Eat-In kitchen, roof is only 5 years old. .. .what are you waiting for? Call your favorite realtor today to schedule an appointment to see this one.
-
2019-08-15$79,000 400-char remark
Show marketing remark (400 chars)
This home is a diamond in the rough! Original parkay flooring, open spaces, lots of natural light. This house is just waiting on you to add a little love to make it a home. It has a beautiful yard with large trees in the back, a beautiful sun porch, Eat-In kitchen, roof is only 5 years old. .. .what are you waiting for? Call your favorite realtor today to schedule an appointment to see this one.
-
2013-02-25soldstatus $35,300
-
2013-02-19soldstatus
-
2012-11-02$43,500
-
2004-09-01soldstatus
-
2004-09-01soldstatus $66,000
-
2004-07-03soldstatus
ⓘ Source: listings_history table (triggers on properties + properties_extension) + one-shot
backfill from property_details.listing_events for pre-trigger history.
Tax reassessment forecast LA · Resets to sale price
- Current annual tax
- $643 · $54/mo
- Projected year-2 tax
- $643 · $54/mo
- Expected delta
- $0/yr ($0/mo · 0.0%)
ⓘ Screening estimate from a state-policy table — verify with the county assessor before closing.
Climate risk First Street
- Flood 1/10 Low FEMA zone X (unshaded) · 0% chance over 30 yrs
- Wildfire 2/10 Low
- Heat 8/10 Severe 7 d/yr ≥110°F today · 20 d/yr by 30 yrs out
- Wind 8/10 Severe 99% chance of damaging wind over 30 yrs
- Air quality 2/10 Low 1 unhealthy d/yr today · 1 by 30 yrs out
Nearby sold comps map
Loading sold comps map…
Walkable amenities ~0.75 mi
Loading nearby amenities…
Taxation est. · year 1
- Rental income
- $16,969
- − Mortgage interest
- −$6,162
- − Property taxes
- −$643
- − Insurance
- −$550
- − Repairs & maintenance
- −$1,358
- − Management
- −$1,358
- − Depreciation
- −$3,200
- Taxable income
- $3,699
- Est. tax owed @ 24.0%
- −$888
- After-tax cash flow
- $4,402/yr
For passive investors: Depreciation is non-cash, so a rental often shows a tax loss while cash-flowing — sheltering income. Rental losses are passive: they offset passive income freely, and up to $25,000/yr can offset ordinary (W-2) income if you actively participate and your MAGI is under $100k (phasing out to $0 by $150k); unused losses carry forward. On sale, claimed depreciation is recaptured at up to 25%, and gains may owe capital-gains tax (a 1031 exchange can defer both). Figures are a year-1 estimate at your 24.0% rate — not tax advice; consult a CPA.
Schools (NCES district)
- District
- Beauregard Parish
- NCES district ID
- 2200180
- Math proficiency
- 30% ▼ -40.00%
- Reading proficiency
- 41% ▼ -35.00%
- Median HH income
- $46,033
- Composite
- 30.34/100
- National rank
- #6265
- State rank
- #32 of 98 in LA
Livability — DeRidder
- Score
- 72/100
- State rank
- #43
- US rank
- #6227
Category grades
Schools grade is shown separately in the Schools card above.
Census & demographics
- Census place
- DeRidder, LA
- Population (ZIP)
- 25,038
Population outlook (Beauregard County) Hauer SSP2
- Today (2025)
- 37,760 people
- By 2030
- 38,140 · +1.0%
- By 2040
- 38,518 · +2.0%
- By 2050
- 38,164 · +1.1%
- By 2075
- 36,437 · -3.5%
- By 2100
- 32,493 · -13.9%
Race, ethnicity, and origin ACS 2023
- Neighborhood character
- Predominantly White (72%)
- Race & ethnicity
- White 72% Black 14% Two or more races 9% Hispanic / Latino 5% Asian 1%
- Hispanic origin (detail)
- Mexican 3% Puerto Rican 1%
- Common ancestry
- Lithuanian 6% Slovak 1% Italian 1%
- Foreign-born
- 2% · Canada
- Languages at home
- 96% English-only · Spanish 2% French/Haitian/Cajun 1%
Political lean MEDSL · Beauregard
- 2024 margin
- Solid R (+71.3) · D 13.8% · R 85.1% · Other 1.1%
- 2008→2024 swing
- -16.9pp toward R · 2008: -54.3pp · 2024: -71.3pp
- All cycles
- 2024: R+71.3 2020: R+67.5 2016: R+65.3 2012: R+58.2 2008: R+54.3
Not yet ingested
- Civics
- —
Market trends
- HPI YoY
- ▼ -57.61%
- Current HPI
- 130.4445
- Rent YoY
- —
- Metro
- —
- State GDP YoY
- ▲ 3.29%
- F500 in state
- 10
Industry mix (Fortune 500 HQ in LA)
| Industry | F500 HQs | Revenue |
|---|---|---|
| Telecommunications | 2 | $23B |
|
||
| Utilities | 1 | $12B |
|
||
| Wholesale / Distribution | 1 | $5B |
|
||
| Advertising | 1 | $2B |
|
||
Price history
+66.7% since first listed11 events — show timeline
- 2025-12-09 Price Changed $110,000 GFPAR
- 2025-10-24 Price Changed $98,500 GFPAR
- 2025-09-04 Listed $120,000 GFPAR
- 2022-08-09 Sold (MLS) — GFPAR
- 2019-08-15 Listed $79,000 GFPAR
- 2013-02-25 Sold (Public Records) $35,300 Public Records
- 2013-02-19 Sold (MLS) — GFPAR
- 2012-11-02 Listed $43,500 GFPAR
- 2004-09-01 Sold (Public Records) $66,000 Public Records
- 2004-09-01 Sold (Public Records) — Public Records
- 2004-07-03 Sold (MLS) — GFPAR
Property tax history
+5.8%/yrLatest (2025): $643 · +0.7% YoY. Source: county tax records.
Cash-flow waterfall
monthlySold comps — $/sqft
last 12 mo · ≤1 miLoading sold comps…