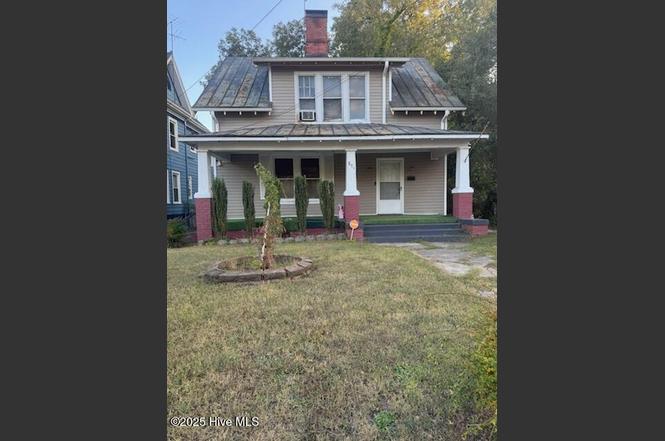
805 Sunset Ave · Rocky Mount, NC
Flood risk 3/10 · Minor
- FEMA flood zone
- X (unshaded)
- Chance of flooding over 30 yrs
- 0.1%
- Est. flood insurance / yr
- $507 – $1,088
Fire risk 3/10 · Minor
- Est. fire insurance / yr
- $906 – $1,684
Heat risk 8/10 · Major
- Hot days now (above 109°F)
- 7 days/yr
- Hot days in 30 yrs
- 16 days/yr
Wind risk 6/10 · Moderate
- Chance of severe wind over 30 yrs
- 72.0%
Air-quality risk 2/10 · Minimal
- Unhealthy air days now
- 1 days/yr
- Unhealthy air days in 30 yrs
- 2 days/yr
Risk factors via First Street. Map © Google.
Why this score? — see what drove the B grade
The composite is a weighted blend of 9 inputs, each scored 0–100. Each bar is that input's sub-score; the figure is the points it added to the 100-point composite (weight × sub-score).
- Cash flow +29.2/30.0
- ARV discount +15.0/15.0
- DSCR +10.0/10.0
- 1% rule +6.8/10.0
- Livability +3.5/5.0
- Rent growth +2.5/5.0
- Condition / age +2.5/5.0
- Schools +2.2/10.0
- Appreciation +0.0/10.0
$140,000
🖨 Deal sheet 📄 Offer letter ✓ Due diligence
Listing remarks
Lots of possibilities Welcome to the perfect blend of comfort and convenience. 3 bedrooms, 1.5 bathrooms residence situated near the vibrant downtown area of Rocky Mount. With its proximity to an array of attractions, including restaurants, shopping, and Rocky Mount's multi-million-dollar Event Center, this property is an investor's delight! Need updates. Possibility of 4th Bedroom Vinyl siding added approx. 3 years ago. Property Selling as
Key facts
- 7,649 sq ft lot
- Garage
- Built 1925
Property features AI
Finance
- Other: Zoned R6mfa; Frontage on city street and state road; Lot dimensions approximately 51 x 150
Exterior
- Parking: On-site parking; 1-car garage (1 garage space, 1 total parking space)
- Utilities: Public water; Sewer connected; Water connected; Cable available
- Home design: Single family residence; One-and-one-half story; Residential property
- Construction: Concrete and vinyl siding construction; Shingle roof
- Exterior features: Porch; Chain link fencing
Interior
- Bathrooms: 1 full bathroom; 1 half bathroom
- Heating & cooling: Wood heating; Space heater; Wall/Window air conditioning
- Interior features: 6 total rooms; Crawl space basement; Has a view
Neighborhood map
What this means for you Summary
Snapshot
- This is a 4-bed/1.0-bath single-family listed at $140k.
Deal economics
- At list price, monthly cash flow is $488 ($6k/yr) — positive.
- The deal already cash-flows at list — no discount required.
- Meets the 1% rule at list price ($2k rent vs $140k).
- Recommended offer: $123k (12.0% below list) — sets the bar for market timing.
- Cap rate 10.5% vs local median 4.5% in Rocky Mount — top-decile yield for the area; either an underpriced asset or a hidden risk that comps aren't pricing in. Stress-test before assuming the spread holds.
Location & tenants
- Location reads 70/100 on livability (#134 in NC) — a middle-class / working-renter tenant base. Strengths: cost of living A+, housing A+, health & safety A+; Watch: crime F, amenities F, employment F.
- Nash-Rocky Mount Schools (rural): math 20% / reading 32% proficiency, ranked #155 of 178 in NC (top 87%) — low school quality limits family demand, transient renter base, plan for 1-2y turnover.
- Zoned schools: Rocky Mount Middle (math 7% / reading 26%, grade F, #449 of 475 statewide, top 96%, 407 students, 97% FRL); Rocky Mount High (math 27% / reading 36%, grade F, #449 of 535 statewide, top 85%, 1,072 students, 76% FRL) — zoned schools average 86% FRL vs 59% district-wide (27 pts higher); higher-poverty schools than district average — tighter screening recommended.
- Market conditions: Rents soft (-0.2%/yr); 392 active listings in the ZIP; 500 units permitted in Nash County in 2024 (0 in 5+ unit buildings).
- This rent runs 32% of the median local income ($61k/yr) — at the standard rent-burdened threshold; future hikes will face affordability resistance.
Forward outlook
- Local home prices are declining (-3.0%/yr); year-one equity from $968 of loan paydown is wiped out by about $4k of value loss. Plan a longer hold.
- Nash County population projected at -12% by 2050 — secular population decline; favor cash flow + early exit over multi-decade hold.
Negotiation context
- It's been on market 251 days — a 12% lower offer ($123k) is reasonable based on typical stale-listing flexibility.
- 2 sale attempts; this cycle's ask has dropped $19k (12%) from the opening price — seller is motivated, your offer sets the floor, not the list.
- Current owner paid $32k; list at $140k implies a 331% gain — meaningful room to come down on a strong offer.
Risks & watch-outs
- Watch-outs: built in 1925 — expect roof / HVAC / electrical / plumbing capex.
- Climate carrying-cost: major wind risk, 72% chance of damaging wind over 30y; extreme-heat days projected 7→16/yr by 2055 (HVAC capex compounding) — expect insurance premiums to compound above CPI over the hold.
Questions for the listing agent
- It's been on market 251 days. Have you received any prior offers? Is the seller open to a 12% concession, seller financing, or rate buy-down credit?
- Built in 1925 — when were the roof, HVAC, electrical panel, plumbing, and water heater last replaced?
- Why hasn't it sold? Are there any deal-killer items the seller is aware of (foundation, flood, title, zoning, code violations)?
- Is there a deadline driving the sale (1031 exchange, divorce, estate, relocation)? That informs how much negotiation room exists.
- Schools are F-rated, which usually means shorter tenancies and higher turnover. Who's the typical renter profile here, and what's been the actual vacancy rate?
- Crime grade is F in this area — have there been break-ins, vandalism, or insurance claims at this property in the last 3 years? What carrier currently insures it and at what premium?
- What's the average days-on-market for RENTAL listings here right now (not sales)? A rising rental-DOM trend means longer vacancies and softer asking-rent achievability than the comps imply.
- What's the recent tenant-quality profile in this submarket — average credit score on applications, eviction rate, late-payment / NSF rate, and stable-employment percentage? A property-management company in the area should have these aggregated.
- How much new for-sale + rental construction is in the pipeline within 1–3 miles? Heavy new supply typically softens prices + rents 12–24 months out; constrained supply supports both.
Investment metrics
- 1% rule
- 1.18% ✓
- Cap rate
- 10.48%
- Cash-on-cash
- 14.94%
- DSCR
- 1.66
- GRM
- 7.1
CMA / ARV
- ARV (on-the-fly)
- $174,704
- Comps found
- 12
Show comp detail 12 sales within ~0.75 mi
| Address | Dist | Beds/Ba | Sqft | Sold | Price | $/sf | Match |
|---|---|---|---|---|---|---|---|
| 216 S Tillery St | 0.13mi | 3/1.0 (-1) | 1,324 (-8%) | 4mo | $74,500 | $56 | 73 |
| 1001 Sunset Ave | 0.16mi | 3/1.5 (-1) | 1,550 (+8%) | 14mo | $108,000 | $70 | 60 |
| 733 Cedarbrook Dr | 0.54mi | 3/1.0 (-1) | 1,322 (-8%) | 2mo | $84,000 | $64 | 56 |
| 1148 Sunset Ave | 0.34mi | 3/1.0 (-1) | 1,643 (+15%) | 1mo | $149,000 | $91 | 54 |
| 1205 W West Haven Blvd | 0.57mi | 3/1.5 (-1) | 1,362 (-5%) | 8mo | $273,000 | $200 | 52 |
| 708 Cedarbrook Dr | 0.50mi | 3/1.5 (-1) | 1,315 (-8%) | 6mo | $159,900 | $122 | 50 |
| 580 W Raleigh Blvd | 0.66mi | 3/1.0 (-1) | 1,355 (-5%) | 9mo | $160,000 | $118 | 48 |
| 625 W Raleigh Blvd | 0.69mi | 3/1.0 (-1) | 1,332 (-7%) | 7mo | $30,000 | $23 | 45 |
| 1213 Hammond St | 0.50mi | 3/1.5 (-1) | 1,314 (-8%) | 14mo | $160,000 | $122 | 44 |
| 813 Burton St | 0.68mi | 3/2.0 (-1) | 1,379 (-4%) | 11mo | $188,500 | $137 | 44 |
| 736 Cedarbrook Dr | 0.56mi | 4/2.0 | 1,260 (-12%) | 8mo | $168,500 | $134 | 43 |
| 1521 Beal St | 0.67mi | 3/1.5 (-1) | 1,530 (+7%) | 14mo | $200,000 | $131 | 38 |
Match score weights: distance 35% · size 25% · config 20% · recency 20%. Top-matched comps best support the ARV.
Projected returns pro-forma
-3.0% appreciation · 0.0% rent growth · sell at horizon
- IRR
- 2.4%
- Equity multiple
- 1.09×
- Total profit
- $3,495
- Equity at exit
- $20,874
- IRR
- 9.1%
- Equity multiple
- 1.61×
- Total profit
- $24,095
- Equity at exit
- $12,105
Cash invested: $39,200 (down + closing). Projections, not guarantees.
Landlord ↔ Tenant lean methodology
- Overall (STATE)
- 85 Strongly Landlord-Friendly
- State North Carolina
- 85 Strongly Landlord-Friendly · R+3
- County
- — inherits STATE
- City
- — inherits STATE
ZIP-level market 27804
- Rents YoY
- -0.2%
- Active inventory
- 392
- Price-to-rent
- 7.1×
Monthly cashflow live
- Estimated rent
- $1,652 medium interval (Pro) →
- Mortgage (P&I)
- −$734
- Tax from tax record
- −$24 /mo · $289/yr
- Insurance
- −$58
- HOA
- −$0
- Vacancy / Maint / Mgmt
- −$347
- Net cashflow
- $488
Break-even live
UW: 25.0% down · 7.5% · 30yr · 1.5% tax · 5.0% vac · 8.0% maint · 8.0% mgmt
Financing live
Cash to close
- Down payment
- $35,000
- Closing costs
- $4,200
- Reserves months
- —
- Total cash needed
- —
Loan-product check · same deal, 3 products live
Conventional
25% down · 7.5% · 30yr
- Down + closing
- —
- Monthly P&I
- —
- Monthly cashflow
- —
- DSCR
- —
- Eligible?
- —
Personal DTI + credit; lowest rate.
DSCR
20% down · 8.5% · 30yr
- Down + closing
- —
- Monthly P&I
- —
- Monthly cashflow
- —
- DSCR
- —
- Eligible?
- —
No personal income docs; deal must DSCR.
Hard money
10% down · 12.0% · 12mo
- Down + closing
- —
- Monthly P&I
- —
- Monthly cashflow
- —
- DSCR
- —
- Eligible?
- —
Short-term bridge; refi at stabilization.
Listing history 22 events
-
2026-06-19days on market $140,000 Active 251 DOM
-
2026-06-18days on market $140,000 Active 250 DOM
-
2026-06-17days on market $140,000 Active 249 DOM
-
2026-06-16days on market $140,000 Active 248 DOM
-
2026-06-15days on market $140,000 Active 247 DOM
-
2026-06-14days on market $140,000 Active 245 DOM
-
2026-06-13days on market $140,000 Active 244 DOM
-
2026-06-10days on market $140,000 Active 242 DOM
-
2026-06-09days on market $140,000 Active 241 DOM
-
2026-06-08days on market $140,000 Active 240 DOM
-
2026-06-07days on market $140,000 Active 239 DOM
-
2026-06-03days on market $140,000 Active 235 DOM
-
2026-06-02days on market $140,000 Active 234 DOM
-
2026-06-01days on market $140,000 Active 233 DOM
-
2026-05-31days on market $140,000 Active 232 DOM
-
2026-05-30days on market $140,000 Active 231 DOM
-
2026-04-01status Active
-
2026-04-01price $140,000
-
2026-03-31historical
-
2026-02-12price $155,000
-
2025-10-10$159,000 Active
-
1989-11-30soldstatus $32,500
ⓘ Source: listings_history table (triggers on properties + properties_extension) + one-shot
backfill from property_details.listing_events for pre-trigger history.
Tax reassessment forecast NC · Resets to sale price
- Current annual tax
- $289 · $24/mo
- Projected year-2 tax
- $1,148 · $96/mo
- Expected delta
- +$859/yr (+$72/mo · 297.6%)
ⓘ Screening estimate from a state-policy table — verify with the county assessor before closing.
Climate risk First Street
- Flood 3/10 Moderate FEMA zone X (unshaded) · 10% chance over 30 yrs
- Wildfire 3/10 Moderate
- Heat 8/10 Severe 7 d/yr ≥109°F today · 16 d/yr by 30 yrs out
- Wind 6/10 Major 72% chance of damaging wind over 30 yrs
- Air quality 2/10 Low 1 unhealthy d/yr today · 2 by 30 yrs out
Nearby sold comps map
Loading sold comps map…
Walkable amenities ~0.75 mi
Loading nearby amenities…
Taxation est. · year 1
- Rental income
- $19,818
- − Mortgage interest
- −$7,842
- − Property taxes
- −$289
- − Insurance
- −$700
- − Repairs & maintenance
- −$1,585
- − Management
- −$1,585
- − Depreciation
- −$4,073
- Taxable income
- $3,744
- Est. tax owed @ 24.0%
- −$898
- After-tax cash flow
- $4,959/yr
For passive investors: Depreciation is non-cash, so a rental often shows a tax loss while cash-flowing — sheltering income. Rental losses are passive: they offset passive income freely, and up to $25,000/yr can offset ordinary (W-2) income if you actively participate and your MAGI is under $100k (phasing out to $0 by $150k); unused losses carry forward. On sale, claimed depreciation is recaptured at up to 25%, and gains may owe capital-gains tax (a 1031 exchange can defer both). Figures are a year-1 estimate at your 24.0% rate — not tax advice; consult a CPA.
Schools (NCES district)
- District
- Nash-Rocky Mount Schools
- NCES district ID
- 3703270
- Math proficiency
- 20% ▼ -3.00%
- Reading proficiency
- 32% ▲ 1.00%
- Median HH income
- $41,553
- Composite
- 22.04/100
- National rank
- #8198
- State rank
- #155 of 178 in NC
Livability — Rocky Mount
- Score
- 70/100
- State rank
- #134
- US rank
- #7692
Category grades
Schools grade is shown separately in the Schools card above.
Census & demographics
- Census place
- Rocky Mount, NC
- County
- Nash County · 50,768 people
- City population
- 70,300
- Metro
- Rocky Mount, NC
- Population (ZIP)
- 30,713
- Household income
- $61,359
- Rent vs Own
- Severe rent burden
- 710.0
Population outlook (Nash County) Hauer SSP2
- Today (2025)
- 91,107 people
- By 2030
- 89,193 · -2.1%
- By 2040
- 84,959 · -6.7%
- By 2050
- 80,517 · -11.6%
- By 2075
- 72,941 · -19.9%
- By 2100
- 63,602 · -30.2%
Race, ethnicity, and origin ACS 2023
- Neighborhood character
- Diverse neighborhood (Simpson 0.59)
- Race & ethnicity
- Black 52% White 38% Hispanic / Latino 6% Two or more races 3% Asian 1%
- Hispanic origin (detail)
- Mexican 2%
- Common ancestry
- Lithuanian 1% Italian 1% Slovak 1%
- Foreign-born
- 4% · Canada
- Languages at home
- 94% English-only · Spanish 5% Other Indo-European 1%
Political lean MEDSL · Nash
- 2024 margin
- Toss-up / Even · D 48.7% · R 50.5%
- 2008→2024 swing
- -0.4pp no change · 2008: -1.3pp · 2024: -1.8pp
- All cycles
- 2024: R+1.8 2020: D+0.2 2016: R+0.2 2012: D+0.9 2008: R+1.3
Not yet ingested
- Civics
- —
Market trends
- HPI YoY
- ▼ -142.83%
- Current HPI
- 183.0082
- Rent YoY
- ▼ -0.17%
- Metro
- Rocky Mount, NC
- State GDP YoY
- ▲ 3.28%
- F500 in state
- 26
Industry mix (Fortune 500 HQ in NC)
| Industry | F500 HQs | Revenue |
|---|---|---|
| Financial Services | 2 | $213B |
|
||
| Retail | 2 | $95B |
|
||
| Industrial Conglomerate | 1 | $38B |
|
||
| Metals / Steel | 1 | $35B |
|
||
| Utilities | 1 | $30B |
|
||
| Industrial Machinery | 1 | $19B |
|
||
Price history
+330.8% since first listed6 events — show timeline
- 2026-04-01 Relisted — Hive MLS
- 2026-04-01 Price Changed $140,000 Hive MLS
- 2026-03-31 Listing Removed — Hive MLS
- 2026-02-12 Price Changed $155,000 Hive MLS
- 2025-10-10 Listed $159,000 Hive MLS
- 1989-11-30 Sold (Public Records) $32,500 Public Records
Property tax history
+1.7%/yrLatest (2025): $289 · +0.0% YoY. Source: county tax records.
Cash-flow waterfall
monthlySold comps — $/sqft
last 12 mo · ≤1 miLoading sold comps…