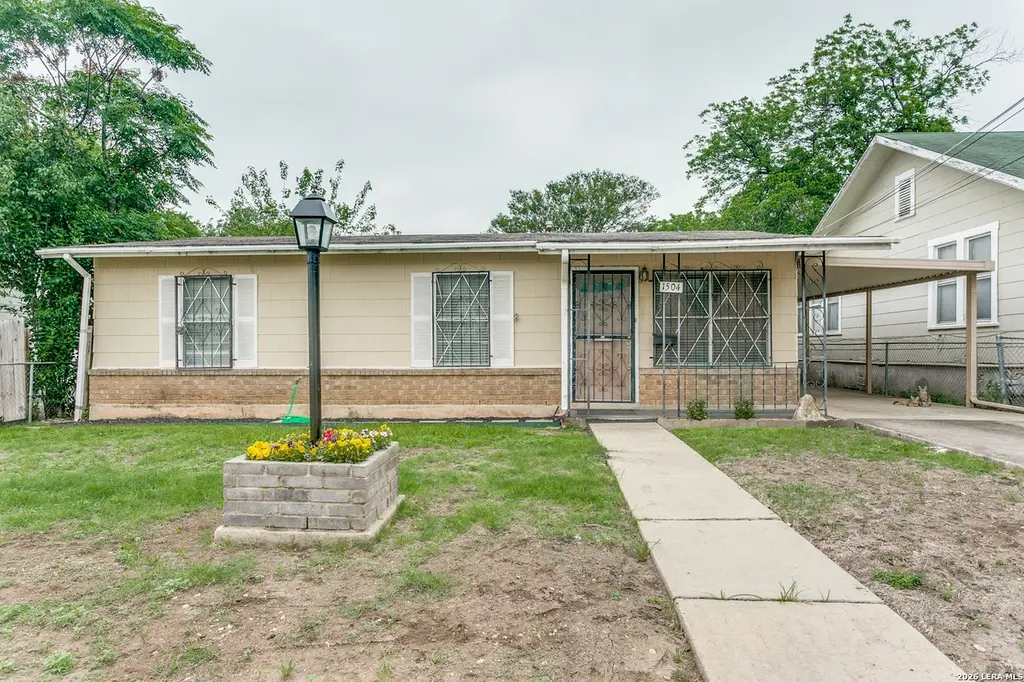
1504 Waverly Ave · San Antonio, TX
Flood risk 1/10 · Minimal
- FEMA flood zone
- X (unshaded)
- Chance of flooding over 30 yrs
- 0.0%
- Est. flood insurance / yr
- $507 – $1,088
Fire risk 1/10 · Minimal
- Est. fire insurance / yr
- $1,222 – $2,270
Heat risk 8/10 · Major
- Hot days now (above 108°F)
- 7 days/yr
- Hot days in 30 yrs
- 21 days/yr
Wind risk 6/10 · Moderate
- Chance of severe wind over 30 yrs
- 77.0%
Air-quality risk 2/10 · Minimal
- Unhealthy air days now
- 1 days/yr
- Unhealthy air days in 30 yrs
- 2 days/yr
Risk factors via First Street. Map © Google.
Why this score? — see what drove the D grade
The composite is a weighted blend of 9 inputs, each scored 0–100. Each bar is that input's sub-score; the figure is the points it added to the 100-point composite (weight × sub-score).
- ARV discount +15.0/15.0
- Cash flow +8.8/30.0
- 1% rule +4.0/10.0
- Livability +4.0/5.0
- Rent growth +3.2/5.0
- Condition / age +2.5/5.0
- DSCR +2.4/10.0
- Schools +1.4/10.0
- Appreciation +0.0/10.0
$155,000
🖨 Deal sheet 📄 Offer letter ✓ Due diligence
Listing remarks
Charming opportunity in the heart of Woodlawn Lake! This 3-bedroom, 1.5-bath home offers a great location just around the corner from the lake, with easy access to one of San Antonio's favorite outdoor spots. Inside, you'll find a functional layout with natural light throughout. The home is move-in ready with room for updates over time, making it a great option for a first-time homebuyer or someone looking to personalize their space. Out back, a bonus room adds flexibility and includes a woodshop and additional storage, ideal for hobbies, projects, or extra workspace. Conveniently located near parks, dining, and downtown, this home offers a great opportunity to get into an established neigh
Key facts
- Move-in ready
- Near dining
- Bonus room
Tags
Property features AI
Finance
- Financial info: Down payment assistance resources available
- HOA & community: Located in the Woodlawn Lake subdivision
Exterior
- Utilities: Water system
- Home design: Pre-owned home; Approximate age: 56 years
- Construction: Slab foundation; Composition roof
- Exterior features: Stone/rock and siding exterior
Interior
- Kitchen: Includes stove/range; Gas cooking; Refrigerator
- Bedrooms: Master bedroom on lower level (10 x 10); Second bedroom (10 x 10); Third bedroom (10 x 10)
- Flooring: Vinyl flooring
- Bathrooms: One full bath; One half bath; Master bath with tub/shower combination and single vanity
- Heating & cooling: Central heating (electric); Central air conditioning
- Interior features: Two living areas with a living/dining room combination; Utility room inside; Some window coverings remain
- Laundry & utility: Washer and dryer included; Utility room inside
Neighborhood map
What this means for you Summary
Snapshot
- This is a 3-bed/2.0-bath single-family listed at $155k.
Deal economics
- At list price, monthly cash flow is $-129 ($-2k/yr) — negative.
- To cash-flow at today's rent, offer at most $132k (14.7% below list).
- To meet the 1% rule (rent ≥ 1% of price), the offer needs to be $139k (10.4% below list).
- Recommended offer: $132k (14.7% below list) — sets the bar for cash-flow.
- Cap rate 5.3% vs local median 3.8% in San Antonio — top-decile yield for the area; either an underpriced asset or a hidden risk that comps aren't pricing in. Stress-test before assuming the spread holds.
Location & tenants
- Location reads 80/100 on livability (#31 in TX, #1,616 nationally) — a professional / high-income tenant draw. Strengths: amenities A+, commute A+, cost of living A+; Watch: crime F.
- San Antonio ISD (urban): math 12% / reading 22% proficiency, ranked #805 of 826 in TX (top 98%) — low school quality limits family demand, transient renter base, plan for 1-2y turnover; 80% free/reduced lunch — lower-income household profile, screen leases tightly.
- Zoned schools: Fenwick Academy (math 4% / reading 16%, grade F, #4,250 of 4,322 statewide, top 99%, 507 students, 94% FRL, charter); Jefferson H S (math 28% / reading 30%, grade F, #1,147 of 1,632 statewide, top 71%, 1,686 students, 87% FRL, charter).
- Market conditions: Rents rising (+2.8%/yr); 172 active listings in the ZIP; 40 comparable units currently listed for rent nearby; rentals at typical pace (median 24d on market — plan ~3-4 weeks tenant-placement turnaround); 40% of comp listings sitting > 30 days — soft ceiling on asking rent; 8,308 units permitted in Bexar County in 2024 (2,506 in 5+ unit buildings).
- This rent runs 35% of the median local income ($47k/yr) — at the standard rent-burdened threshold; future hikes will face affordability resistance.
Forward outlook
- Local home prices are declining (-3.0%/yr); year-one equity from $1k of loan paydown is wiped out by about $5k of value loss. Plan a longer hold.
- Bexar County population projected at +50% by 2050 — long-run rental-demand tailwind backs the buy-and-hold thesis.
Negotiation context
- It's been on market 18 days — a 2% lower offer ($153k) is reasonable based on typical stale-listing flexibility.
Risks & watch-outs
- Watch-outs: property tax is 2.7% of price.
- Climate carrying-cost: major wind risk, 77% chance of damaging wind over 30y; extreme-heat days projected 7→21/yr by 2055 (HVAC capex compounding) — expect insurance premiums to compound above CPI over the hold.
Questions for the listing agent
- What do current leases actually rent for vs. the listed asking? Can we see a recent rent roll and the last 12 months of T-12 income?
- Built in 1970 — when were the roof, HVAC, electrical panel, plumbing, and water heater last replaced?
- Property tax is high relative to price — has the assessment been appealed recently, and will the sale trigger a re-assessment?
- Is there a deadline driving the sale (1031 exchange, divorce, estate, relocation)? That informs how much negotiation room exists.
- Crime grade is F in this area — have there been break-ins, vandalism, or insurance claims at this property in the last 3 years? What carrier currently insures it and at what premium?
- The area grade is low — what's the realistic commute time and amenity access for the typical tenant pool here? Any planned neighborhood developments (good or bad) we should know about?
- What's the average days-on-market for RENTAL listings here right now (not sales)? A rising rental-DOM trend means longer vacancies and softer asking-rent achievability than the comps imply.
- What's the recent tenant-quality profile in this submarket — average credit score on applications, eviction rate, late-payment / NSF rate, and stable-employment percentage? A property-management company in the area should have these aggregated.
- How much new for-sale + rental construction is in the pipeline within 1–3 miles? Heavy new supply typically softens prices + rents 12–24 months out; constrained supply supports both.
Investment metrics
- 1% rule
- 0.90% ✗
- Cap rate
- 5.29%
- Cash-on-cash
- -3.57%
- DSCR
- 0.84
- GRM
- 9.3
CMA / ARV
- ARV (median comp)
- $192,566
- List price
- $155,000
- Delta
- -19.51%
- Verdict
- UNDERPRICED
- Comps
- 20 within 1.0 mi
Show comp detail 12 sales within ~0.75 mi
| Address | Dist | Beds/Ba | Sqft | Sold | Price | $/sf | Match |
|---|---|---|---|---|---|---|---|
| 1504 Waverly Ave | 0.00mi | 3/1.5 | 1,068 (0%) | 1mo | $155,000 | $145 | 97 |
| 416 Peacock Ave | 0.21mi | 4/1.5 (+1) | 1,092 (+2%) | 5mo | $90,000 | $82 | 75 |
| 2111 Rivas | 0.63mi | 3/2.0 | 1,080 (+1%) | 1mo | $99,900 | $93 | 68 |
| 131 Neff | 0.39mi | 3/1.0 | 1,029 (-4%) | 6mo | $139,700 | $136 | 67 |
| 107 Blueridge | 0.36mi | 3/2.0 | 1,143 (+7%) | 9mo | $200,000 | $175 | 64 |
| 841 Texas | 0.58mi | 3/1.0 | 1,062 (-1%) | 6mo | $155,000 | $146 | 63 |
| 122 Goodrich | 0.40mi | 3/2.0 | 996 (-7%) | 11mo | $169,900 | $171 | 61 |
| 1938 Texas | 0.48mi | 2/1.0 (-1) | 1,058 (-1%) | 9mo | $105,000 | $99 | 60 |
| 1111 Waverly | 0.38mi | 2/1.0 (-1) | 984 (-8%) | 3mo | $199,999 | $203 | 58 |
| 2407 W Mistletoe Ave | 0.61mi | 3/1.0 | 1,204 (+13%) | 3mo | $221,000 | $184 | 44 |
| 120 Henry St | 0.68mi | 2/1.5 (-1) | 910 (-15%) | 1mo | $149,500 | $164 | 36 |
| 1806 Delgado St | 0.62mi | 3/1.0 | 1,224 (+15%) | 9mo | $115,000 | $94 | 36 |
Match score weights: distance 35% · size 25% · config 20% · recency 20%. Top-matched comps best support the ARV.
Projected returns pro-forma
-3.0% appreciation · 2.82% rent growth · sell at horizon
- IRR
- -22.4%
- Equity multiple
- 0.23×
- Total profit
- $-33,466
- Equity at exit
- $23,111
- IRR
- -16.8%
- Equity multiple
- 0.07×
- Total profit
- $-40,274
- Equity at exit
- $13,402
Cash invested: $43,400 (down + closing). Projections, not guarantees.
Landlord ↔ Tenant lean methodology
- Overall (STATE)
- 87 Strongly Landlord-Friendly
- State Texas
- 87 Strongly Landlord-Friendly · R+5
- County
- — inherits STATE
- City
- — inherits STATE
ZIP-level market 78201
- Home prices YoY
- -28.4%
- Rents YoY
- 2.8%
- Active inventory
- 172
- Price-to-rent
- 9.3×
Monthly cashflow live
- Estimated rent
- $1,389 high interval (Pro) →
- Mortgage (P&I)
- −$813
- Tax from tax record
- −$349 /mo · $4,185/yr
- Insurance
- −$65
- HOA
- −$0
- Vacancy / Maint / Mgmt
- −$292
- Net cashflow
- $-129
Break-even live
UW: 25.0% down · 7.5% · 30yr · 1.5% tax · 5.0% vac · 8.0% maint · 8.0% mgmt
Financing live
Cash to close
- Down payment
- $38,750
- Closing costs
- $4,650
- Reserves months
- —
- Total cash needed
- —
Loan-product check · same deal, 3 products live
Conventional
25% down · 7.5% · 30yr
- Down + closing
- —
- Monthly P&I
- —
- Monthly cashflow
- —
- DSCR
- —
- Eligible?
- —
Personal DTI + credit; lowest rate.
DSCR
20% down · 8.5% · 30yr
- Down + closing
- —
- Monthly P&I
- —
- Monthly cashflow
- —
- DSCR
- —
- Eligible?
- —
No personal income docs; deal must DSCR.
Hard money
10% down · 12.0% · 12mo
- Down + closing
- —
- Monthly P&I
- —
- Monthly cashflow
- —
- DSCR
- —
- Eligible?
- —
Short-term bridge; refi at stabilization.
Rent comps 40 comps
| Address | Beds | Baths | Sqft | Rent | $/sqft | DOM | Units | Dist |
|---|---|---|---|---|---|---|---|---|
| 1706 Texas Ave San Antonio, TX | 2.0 | 2.0 | 1204 | $1,500 | $1.25 | 24d | 1 | 0.22mi |
| 1706 Texas Ave San Antonio, TX | 2.0 | 2.0 | 1204 | $1,500 | $1.25 | 44d | 1 | 0.22mi |
| 2607 W Craig Pl San Antonio, TX | 3.0 | 1.0 | 1312 | $1,475 | $1.12 | 24d | 1 | 0.49mi |
| 2020 W Woodlawn Ave San Antonio, TX | 2.0 | 1.5 | 1200 | $1,298 | $1.08 | 44d | 1 | 0.53mi |
| 2050 W Mistletoe Ave San Antonio, TX | 3.0 | 2.0 | 1442 | $4,500 | $3.12 | 24d | 1 | 0.57mi |
| 2718 W Craig Pl San Antonio, TX | 2.0 | 1.0 | 1004 | $1,350 | $1.34 | 11d | 1 | 0.58mi |
| 2718 W Craig Pl San Antonio, TX | 2.0 | 1.0 | 1004 | $1,350 | $1.34 | 12d | 1 | 0.58mi |
| 2007 W Mistletoe Ave San Antonio, TX | 2.0 | 1.0 | 1224 | $1,650 | $1.35 | 44d | 1 | 0.62mi |
| 2530 W Woodlawn Ave San Antonio, TX | 3.0 | 2.0 | 1416 | $2,195 | $1.55 | 44d | 1 | 0.64mi |
| 122 Collins Ct San Antonio, TX | 2.0 | 1.0 | 927 | $1,150 | $1.24 | 22d | 1 | 0.64mi |
| 1231 Rivas St Unit 102 San Antonio, TX | 3.0 | 2.0 | 1120 | $1,299 | $1.16 | 44d | 1 | 0.67mi |
| 1230 Rivas St San Antonio, TX | 3.0 | 2.5 | 1287 | $1,999 | $1.55 | 24d | 1 | 0.69mi |
| 1914 W Magnolia Ave San Antonio, TX | 2.0 | 1.0 | 1316 | $1,850 | $1.41 | 24d | 1 | 0.72mi |
| 206 Roberts St Unit 201 San Antonio, TX | 3.0 | 2.0 | 1100 | $1,350 | $1.23 | 24d | 1 | 0.72mi |
| 2148 Texas Ave San Antonio, TX | 3.0 | 1.0 | 1131 | $1,375 | $1.22 | 24d | 1 | 0.73mi |
| 2503 Arbor Pl San Antonio, TX | 2.0 | 1.0 | 750 | $800 | $1.07 | 44d | 1 | 0.74mi |
| 2443 W Huisache Ave Unit 1 San Antonio, TX | 2.0 | 1.0 | 1200 | $1,100 | $0.92 | 44d | 1 | 0.78mi |
| 230 Micklejohn St San Antonio, TX | 3.0 | 2.0 | 1368 | $1,695 | $1.24 | 44d | 1 | 0.82mi |
| 230 Micklejohn St San Antonio, TX | 3.0 | 2.0 | 1368 | $1,595 | $1.17 | 24d | 1 | 0.82mi |
| 3156 W French Pl San Antonio, TX | 2.0 | 2.0 | 1100 | $1,150 | $1.05 | 44d | 1 | 0.83mi |
| 1644 W Mistletoe Ave Unit 201 San Antonio, TX | 2.0 | 2.0 | 831 | $1,700 | $2.05 | 44d | 1 | 0.88mi |
| 1602 W Craig Pl San Antonio, TX | 2.0 | 1.0 | 1344 | $1,300 | $0.97 | 44d | 1 | 0.90mi |
| 1545 Ruiz St San Antonio, TX | 2.0 | 2.0 | 1020 | $935 | $0.92 | 44d | 1 | 0.91mi |
| 2331 Cincinnati Ave Unit 2345 03 San Antonio, TX | 3.0 | 1.0 | 950 | $1,300 | $1.37 | 3d | 1 | 0.92mi |
| 2331 Cincinnati Ave San Antonio, TX | 1.0–3.0 | 1.0 | 850 | $1,300 | $1.53 | 12d | 3 | 0.92mi |
| 2020 W Kings Hwy Unit 2 San Antonio, TX | 2.0 | 1.0 | 1254 | $1,325 | $1.06 | 44d | 1 | 0.93mi |
| 2825 W Woodlawn Ave Unit 2825-WW San Antonio, TX | 2.0 | 1.0 | 700 | $1,195 | $1.71 | 3d | 1 | 0.98mi |
| 2313 Texas Ave San Antonio, TX | 3.0 | 1.0 | 1309 | $1,400 | $1.07 | 44d | 1 | 0.99mi |
| 1524 W Woodlawn Ave San Antonio, TX | 2.0 | 1.0 | 1200 | $795 | $0.66 | 24d | 1 | 1.01mi |
| 3918 W Martin St San Antonio, TX | 3.0 | 1.0 | 1200 | $1,300 | $1.08 | 24d | 1 | 1.05mi |
| 1630 W Mulberry Ave San Antonio, TX | 2.0 | 1.0 | 1100 | $1,400 | $1.27 | 44d | 1 | 1.06mi |
| 2426 Cincinnati Ave San Antonio, TX | 2.0 | 1.0 | 700 | $975 | $1.39 | 24d | 1 | 1.07mi |
| 1717 W Summit Ave San Antonio, TX | 2.0 | 1.0 | 1006 | $1,700 | $1.69 | 24d | 1 | 1.07mi |
| 734 Donaldson Ave Unit D San Antonio, TX | 2.0 | 1.0 | 910 | $915 | $1.01 | 12d | 1 | 1.08mi |
| 734 Donaldson Ave Unit B San Antonio, TX | 2.0 | 1.0 | 910 | $910 | $1.00 | 3d | 1 | 1.08mi |
| 1802 W Gramercy Pl Unit 1 San Antonio, TX | 2.0 | 1.0 | 700 | $895 | $1.28 | 20d | 1 | 1.12mi |
| 1802 W Gramercy Pl Unit 1 San Antonio, TX | 2.0 | 1.0 | 700 | $895 | $1.28 | 3d | 1 | 1.12mi |
| 811 Rivas St San Antonio, TX | 3.0 | 2.0 | 1276 | $1,580 | $1.24 | 24d | 1 | 1.17mi |
| 1409 W Woodlawn Ave #4 San Antonio, TX | 2.0 | 1.0 | 900 | $795 | $0.88 | 22d | 1 | 1.17mi |
| 1409 W Woodlawn Ave #4 San Antonio, TX | 2.0 | 1.0 | 900 | $795 | $0.88 | 44d | 1 | 1.17mi |
Listing history 3 events
-
2026-05-18status Pending 736-char remark
-
2026-05-07historical Active Option 736-char remark
-
2026-04-30$155,000 New 736-char remark
ⓘ Source: listings_history table (triggers on properties + properties_extension) + one-shot
backfill from property_details.listing_events for pre-trigger history.
Tax reassessment forecast TX · Resets to sale price
- Current annual tax
- $4,185 · $349/mo
- Projected year-2 tax
- $4,185 · $349/mo
- Expected delta
- $0/yr ($0/mo · 0.0%)
ⓘ Screening estimate from a state-policy table — verify with the county assessor before closing.
Climate risk First Street
- Flood 1/10 Low FEMA zone X (unshaded) · 0% chance over 30 yrs
- Wildfire 1/10 Low
- Heat 8/10 Severe 7 d/yr ≥108°F today · 21 d/yr by 30 yrs out
- Wind 6/10 Major 77% chance of damaging wind over 30 yrs
- Air quality 2/10 Low 1 unhealthy d/yr today · 2 by 30 yrs out
Nearby sold comps map
Loading sold comps map…
Walkable amenities ~0.75 mi
Loading nearby amenities…
Taxation est. · year 1
- Rental income
- $16,666
- − Mortgage interest
- −$8,682
- − Property taxes
- −$4,185
- − Insurance
- −$775
- − Repairs & maintenance
- −$1,333
- − Management
- −$1,333
- − Depreciation
- −$4,509
- Taxable loss
- −$4,152
- Est. tax savings @ 24.0%
- +$996
- After-tax cash flow
- $-551/yr
For passive investors: Depreciation is non-cash, so a rental often shows a tax loss while cash-flowing — sheltering income. Rental losses are passive: they offset passive income freely, and up to $25,000/yr can offset ordinary (W-2) income if you actively participate and your MAGI is under $100k (phasing out to $0 by $150k); unused losses carry forward. On sale, claimed depreciation is recaptured at up to 25%, and gains may owe capital-gains tax (a 1031 exchange can defer both). Figures are a year-1 estimate at your 24.0% rate — not tax advice; consult a CPA.
Schools (NCES district)
- District
- San Antonio ISD
- NCES district ID
- 4838730
- Math proficiency
- 12% ▼ -21.00%
- Reading proficiency
- 22% ▼ -7.00%
- Median HH income
- $30,952
- Composite
- 13.57/100
- National rank
- #9512
- State rank
- #805 of 826 in TX
Livability — San Antonio
- Score
- 80/100
- State rank
- #31
- US rank
- #1616
Category grades
Schools grade is shown separately in the Schools card above.
Census & demographics
- Census place
- San Antonio, TX
- County
- Bexar County · 1,990,555 people
- City population
- 1,806,925
- Metro
- San Antonio-New Braunfels, TX
- Population (ZIP)
- 41,981
- Household income
- $47,121
- Rent vs Own
- Severe rent burden
- 2332.0
Population outlook (Bexar County) Hauer SSP2
- Today (2025)
- 2,336,851 people
- By 2030
- 2,560,728 · +9.6%
- By 2040
- 3,020,569 · +29.3%
- By 2050
- 3,493,522 · +49.5%
- By 2075
- 4,668,459 · +99.8%
- By 2100
- 5,533,242 · +136.8%
Race, ethnicity, and origin ACS 2023
- Neighborhood character
- Predominantly Hispanic (83%)
- Race & ethnicity
- Hispanic / Latino 83% Two or more races 51% White 13% Black 2% Native American 1%
- Hispanic origin (detail)
- Mexican 71%
- Common ancestry
- Arab 1% Lithuanian 1% Slovak 1%
- Foreign-born
- 22% · Canada
- Languages at home
- 43% English-only · Spanish 54% Arabic 1%
Political lean MEDSL · Bexar
- 2024 margin
- Lean D (+9.8) · D 54.3% · R 44.6% · Other 1.1%
- 2008→2024 swing
- +4.2pp toward D · 2008: 5.6pp · 2024: 9.8pp
- All cycles
- 2024: D+9.8 2020: D+18.2 2016: D+13.5 2012: D+4.6 2008: D+5.6
Not yet ingested
- Civics
- —
Market trends
- HPI YoY
- ▼ -103.07%
- Current HPI
- 259.9918
- Rent YoY
- ▲ 2.82%
- Metro
- San Antonio-New Braunfels, TX
- State GDP YoY
- ▲ 3.95%
- F500 in state
- 110
Industry mix (Fortune 500 HQ in TX)
| Industry | F500 HQs | Revenue |
|---|---|---|
| Energy | 16 | $1,198B |
|
||
| Technology | 5 | $198B |
|
||
| Engineering / Construction | 4 | $72B |
|
||
| Energy Services | 3 | $60B |
|
||
| Utilities | 3 | $41B |
|
||
| Healthcare | 2 | $330B |
|
||
Price history
5 events — show timeline
- 2026-05-27 Sold (Public Records) — Public Records
- 2026-05-26 Sold (MLS) — LERA
- 2026-05-18 Pending — LERA
- 2026-05-07 Contingent — LERA
- 2026-04-30 Listed $155,000 LERA
Property tax history
+7.0%/yrLatest (2025): $4,185 · +10.0% YoY. Source: county tax records.
Cash-flow waterfall
monthlySold comps — $/sqft
last 12 mo · ≤1 miLoading sold comps…