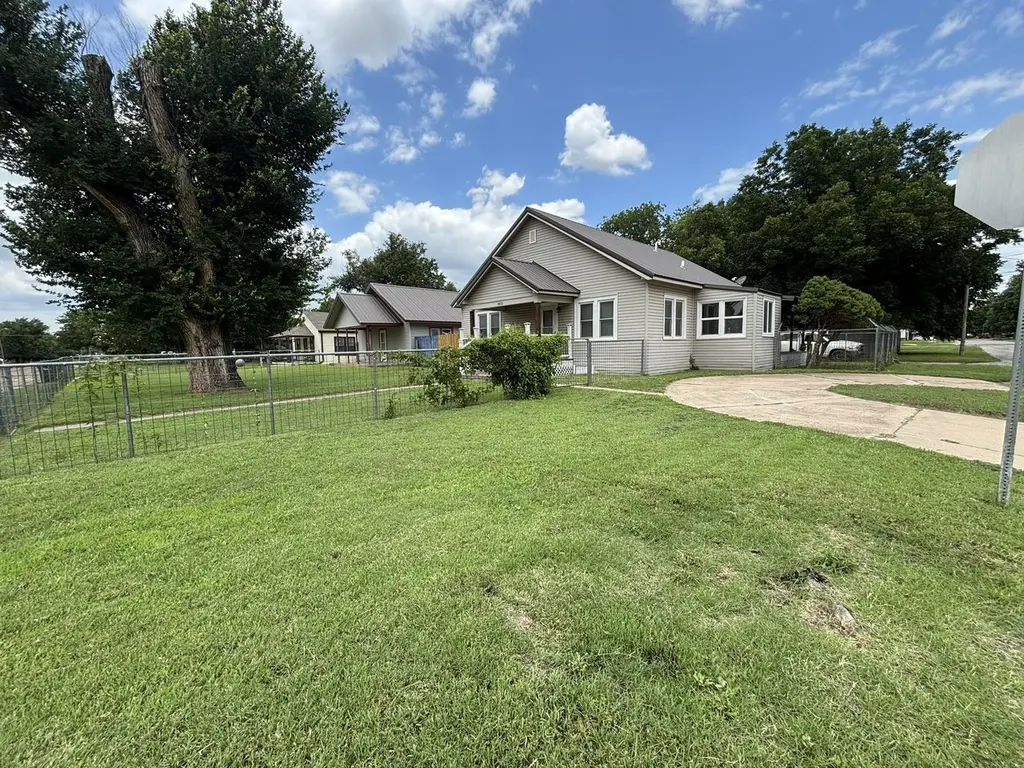
1432 E Cherokee Ave · Enid, OK
Flood risk 1/10 · Minimal
- FEMA flood zone
- X (unshaded)
- Chance of flooding over 30 yrs
- 0.0%
- Est. flood insurance / yr
- $507 – $1,088
Fire risk 4/10 · Minor
- Est. fire insurance / yr
- $2,463 – $4,575
Heat risk 5/10 · Moderate
- Hot days now (above 108°F)
- 7 days/yr
- Hot days in 30 yrs
- 19 days/yr
Wind risk 2/10 · Minimal
- Chance of severe wind over 30 yrs
- 2.0%
Air-quality risk 2/10 · Minimal
- Unhealthy air days now
- 0 days/yr
- Unhealthy air days in 30 yrs
- 1 days/yr
Risk factors via First Street. Map © Google.
Why this score? — see what drove the D- grade
The composite is a weighted blend of 9 inputs, each scored 0–100. Each bar is that input's sub-score; the figure is the points it added to the 100-point composite (weight × sub-score).
- Cash flow +11.3/30.0
- ARV discount +7.5/15.0
- DSCR +3.3/10.0
- Rent growth +3.3/5.0
- Livability +3.2/5.0
- Condition / age +2.5/5.0
- 1% rule +2.3/10.0
- Schools +1.8/10.0
- Appreciation +0.0/10.0
$129,000
🖨 Deal sheet 📄 Offer letter ✓ Due diligence
Listing remarks
This nicely renovated home in Enid offers 3 bedrooms, 2 bathrooms, and generous square footage, providing ample space for comfortable living. Thoughtfully updated throughout, the home features attractive vinyl flooring, fresh interior paint, and updated windows that enhance both style and efficiency. The unique floor plan creates a distinctive living experience, offering character and flexibility that sets this property apart. Situated on a desirable corner lot, the home provides additional outdoor space and curb appeal that is sure to impress. Outside, you'll find a fenced front yard, perfect for enjoying outdoor activities, pets, or added privacy, and a circle drive. A charming side porch
Key facts
- Renovated home
- Unique floor plan
- Updated windows
Tags
Property features AI
Exterior
- Parking: Detached 1-car garage; Circular driveway
- Utilities: Public water; Public sewer
- Home design: Single family residence; Single-story; Faces south; Vinyl siding
- Construction: Vinyl siding construction; Metal roof
- Exterior features: Corner lot; Chain link and wood fencing; Metal roof
Interior
- Kitchen: Dishwasher
- Flooring: Laminate
- Bathrooms: 2 full bathrooms
- Heating & cooling: Central heating (natural gas); Central air; Ceiling fans
- Interior features: Window coverings; Dishwasher; Laminate flooring
Neighborhood map
What this means for you Summary
Snapshot
- This is a 2-bed/2.0-bath single-family listed at $129k.
Deal economics
- At list price, monthly cash flow is $-48 ($-576/yr) — negative.
- To cash-flow at today's rent, offer at most $121k (6.6% below list).
- To meet the 1% rule (rent ≥ 1% of price), the offer needs to be $95k (26.6% below list).
- Recommended offer: $95k (26.6% below list) — sets the bar for 1% rule.
Location & tenants
- Location reads 63/100 on livability (#212 in OK) — a middle-class / working-renter tenant base. Strengths: cost of living A+, housing A+; Watch: employment C-, schools D-, crime F.
- Enid (town): math 19% / reading 22% proficiency, ranked #168 of 270 in OK (top 62%) — low school quality limits family demand, transient renter base, plan for 1-2y turnover; 64% free/reduced lunch — lower-income household profile, screen leases tightly.
- Market conditions: Rents rising (+3.2%/yr); 79 active listings in the ZIP; 19 units permitted in Garfield County in 2024 (0 in 5+ unit buildings).
Forward outlook
- Local home prices are declining (-3.0%/yr); year-one equity from $892 of loan paydown is wiped out by about $4k of value loss. Plan a longer hold.
- Garfield County population projected at +27% by 2050 — long-run rental-demand tailwind backs the buy-and-hold thesis.
Negotiation context
- Only 8 days on market — expect competitive offers; lowballing is unlikely to land.
- Current owner paid $10k; list at $129k implies a 1190% gain — meaningful room to come down on a strong offer.
Risks & watch-outs
- Watch-outs: built in 1940 — expect roof / HVAC / electrical / plumbing capex.
- Climate carrying-cost: extreme-heat days projected 7→19/yr by 2055 (HVAC capex compounding) — expect insurance premiums to compound above CPI over the hold.
Questions for the listing agent
- What do current leases actually rent for vs. the listed asking? Can we see a recent rent roll and the last 12 months of T-12 income?
- Built in 1940 — when were the roof, HVAC, electrical panel, plumbing, and water heater last replaced?
- Is there a deadline driving the sale (1031 exchange, divorce, estate, relocation)? That informs how much negotiation room exists.
- Schools are D-rated, which usually means shorter tenancies and higher turnover. Who's the typical renter profile here, and what's been the actual vacancy rate?
- Crime grade is F in this area — have there been break-ins, vandalism, or insurance claims at this property in the last 3 years? What carrier currently insures it and at what premium?
- The area grade is low — what's the realistic commute time and amenity access for the typical tenant pool here? Any planned neighborhood developments (good or bad) we should know about?
- What's the average days-on-market for RENTAL listings here right now (not sales)? A rising rental-DOM trend means longer vacancies and softer asking-rent achievability than the comps imply.
- What's the recent tenant-quality profile in this submarket — average credit score on applications, eviction rate, late-payment / NSF rate, and stable-employment percentage? A property-management company in the area should have these aggregated.
- How much new for-sale + rental construction is in the pipeline within 1–3 miles? Heavy new supply typically softens prices + rents 12–24 months out; constrained supply supports both.
Investment metrics
- 1% rule
- 0.73% ✗
- Cap rate
- 5.85%
- Cash-on-cash
- -1.59%
- DSCR
- 0.93
- GRM
- 11.3
CMA / ARV
- ARV (on-the-fly)
- $82,368
- Comps found
- 12
Show comp detail 12 sales within ~0.75 mi
| Address | Dist | Beds/Ba | Sqft | Sold | Price | $/sf | Match |
|---|---|---|---|---|---|---|---|
| 1409 E Maine St | 0.06mi | 2/1.0 | 1,212 (-6%) | 10mo | $60,000 | $50 | 75 |
| 1709 E Cypress Ave | 0.44mi | 2/1.0 | 1,296 (+1%) | 4mo | $115,000 | $89 | 71 |
| 1701 E Oklahoma Ave | 0.20mi | 2/1.0 | 1,136 (-12%) | 5mo | $75,000 | $66 | 62 |
| 442 N Davis St | 0.55mi | 2/1.0 | 1,215 (-6%) | 4mo | $37,000 | $30 | 57 |
| 621 N 12th St | 0.63mi | 3/1.5 (+1) | 1,230 (-4%) | 4mo | $74,200 | $60 | 53 |
| 1018 E Pine Ave | 0.63mi | 2/1.0 | 1,182 (-8%) | 4mo | $55,000 | $47 | 50 |
| 1713 E Elm Ave | 0.39mi | 3/1.0 (+1) | 1,120 (-13%) | 3mo | $105,000 | $94 | 48 |
| 1614 E Pine Ave | 0.52mi | 2/1.0 | 1,174 (-9%) | 11mo | $51,600 | $44 | 48 |
| 1215 E Elm Ave | 0.40mi | 3/1.0 (+1) | 1,140 (-11%) | 12mo | $65,000 | $57 | 43 |
| 1814 E Oak Ave | 0.63mi | 2/1.0 | 1,116 (-13%) | 8mo | $75,000 | $67 | 38 |
| 714 N 14th St | 0.65mi | 3/1.0 (+1) | 1,094 (-15%) | 1mo | $70,000 | $64 | 35 |
| 729 N 15th St | 0.69mi | 3/1.0 (+1) | 1,165 (-10%) | 11mo | $108,000 | $93 | 34 |
Match score weights: distance 35% · size 25% · config 20% · recency 20%. Top-matched comps best support the ARV.
Projected returns pro-forma
-3.0% appreciation · 3.16% rent growth · sell at horizon
- IRR
- -18.8%
- Equity multiple
- 0.34×
- Total profit
- $-23,851
- Equity at exit
- $19,234
- IRR
- -11.1%
- Equity multiple
- 0.33×
- Total profit
- $-24,255
- Equity at exit
- $11,154
Cash invested: $36,120 (down + closing). Projections, not guarantees.
Landlord ↔ Tenant lean methodology
- Overall (STATE)
- 83 Strongly Landlord-Friendly
- State Oklahoma
- 83 Strongly Landlord-Friendly · R+20
- County
- — inherits STATE
- City
- — inherits STATE
ZIP-level market 73701
- Home prices YoY
- -30.2%
- Rents YoY
- 3.2%
- Active inventory
- 79
- Price-to-rent
- 11.3×
Monthly cashflow live
- Estimated rent
- $947 medium interval (Pro) →
- Mortgage (P&I)
- −$676
- Tax from tax record
- −$66 /mo · $795/yr
- Insurance
- −$54
- HOA
- −$0
- Vacancy / Maint / Mgmt
- −$199
- Net cashflow
- $-48
Break-even live
UW: 25.0% down · 7.5% · 30yr · 1.5% tax · 5.0% vac · 8.0% maint · 8.0% mgmt
Financing live
Cash to close
- Down payment
- $32,250
- Closing costs
- $3,870
- Reserves months
- —
- Total cash needed
- —
Loan-product check · same deal, 3 products live
Conventional
25% down · 7.5% · 30yr
- Down + closing
- —
- Monthly P&I
- —
- Monthly cashflow
- —
- DSCR
- —
- Eligible?
- —
Personal DTI + credit; lowest rate.
DSCR
20% down · 8.5% · 30yr
- Down + closing
- —
- Monthly P&I
- —
- Monthly cashflow
- —
- DSCR
- —
- Eligible?
- —
No personal income docs; deal must DSCR.
Hard money
10% down · 12.0% · 12mo
- Down + closing
- —
- Monthly P&I
- —
- Monthly cashflow
- —
- DSCR
- —
- Eligible?
- —
Short-term bridge; refi at stabilization.
Listing history 8 events
-
2026-06-19days on market $129,000 Active 8 DOM
-
2026-06-18days on market $129,000 Active 7 DOM
-
2026-06-17days on market $129,000 Active 6 DOM
-
2026-06-16days on market $129,000 Active 5 DOM
-
2026-06-15days on market $129,000 Active 4 DOM
-
2026-06-14days on market $129,000 Active 2 DOM
-
2026-06-12remarks 699-char remark
-
2026-06-12$129,000 Active 1 DOM
ⓘ Source: listings_history table (triggers on properties + properties_extension) + one-shot
backfill from property_details.listing_events for pre-trigger history.
Tax reassessment forecast OK · Resets to sale price
- Current annual tax
- $795 · $66/mo
- Projected year-2 tax
- $1,161 · $97/mo
- Expected delta
- +$366/yr (+$30/mo · 46.0%)
ⓘ Screening estimate from a state-policy table — verify with the county assessor before closing.
Climate risk First Street
- Flood 1/10 Low FEMA zone X (unshaded) · 0% chance over 30 yrs
- Wildfire 4/10 Moderate
- Heat 5/10 Major 7 d/yr ≥108°F today · 19 d/yr by 30 yrs out
- Wind 2/10 Low 2% chance of damaging wind over 30 yrs
- Air quality 2/10 Low 0 unhealthy d/yr today · 1 by 30 yrs out
Nearby sold comps map
Loading sold comps map…
Walkable amenities ~0.75 mi
Loading nearby amenities…
Taxation est. · year 1
- Rental income
- $11,370
- − Mortgage interest
- −$7,226
- − Property taxes
- −$795
- − Insurance
- −$645
- − Repairs & maintenance
- −$910
- − Management
- −$910
- − Depreciation
- −$3,753
- Taxable loss
- −$2,868
- Est. tax savings @ 24.0%
- +$688
- After-tax cash flow
- $113/yr
For passive investors: Depreciation is non-cash, so a rental often shows a tax loss while cash-flowing — sheltering income. Rental losses are passive: they offset passive income freely, and up to $25,000/yr can offset ordinary (W-2) income if you actively participate and your MAGI is under $100k (phasing out to $0 by $150k); unused losses carry forward. On sale, claimed depreciation is recaptured at up to 25%, and gains may owe capital-gains tax (a 1031 exchange can defer both). Figures are a year-1 estimate at your 24.0% rate — not tax advice; consult a CPA.
Schools (NCES district)
- District
- Enid
- NCES district ID
- 4010920
- Math proficiency
- 19% ▼ -11.00%
- Reading proficiency
- 22% ▼ -9.00%
- Median HH income
- $42,389
- Composite
- 17.59/100
- National rank
- #9040
- State rank
- #168 of 270 in OK
Livability — Enid
- Score
- 63/100
- State rank
- #212
- US rank
- #15472
Category grades
Schools grade is shown separately in the Schools card above.
Census & demographics
- Census place
- Enid, OK
- County
- Garfield County · 55,032 people
- City population
- 55,032
- Metro
- Enid, OK
- Population (ZIP)
- 24,476
- Household income
- $50,843
- Rent vs Own
- Severe rent burden
- 576.0
Population outlook (Garfield County) Hauer SSP2
- Today (2025)
- 69,026 people
- By 2030
- 72,171 · +4.6%
- By 2040
- 79,366 · +15.0%
- By 2050
- 87,847 · +27.3%
- By 2075
- 112,714 · +63.3%
- By 2100
- 135,682 · +96.6%
Race, ethnicity, and origin ACS 2023
- Neighborhood character
- Diverse neighborhood (Simpson 0.61)
- Race & ethnicity
- White 58% Hispanic / Latino 22% Two or more races 11% Pacific Islander 10% Native American 4% Black 2%
- Hispanic origin (detail)
- Mexican 21%
- Common ancestry
- Iranian 4% Lithuanian 2% Slovak 1%
- Foreign-born
- 10% · Canada
- Languages at home
- 79% English-only · Spanish 14% Other Asian/Pacific 6%
Political lean MEDSL · Garfield
- 2024 margin
- Solid R (+53.8) · D 22.2% · R 76.0% · Other 1.8%
- 2008→2024 swing
- -2.8pp toward R · 2008: -51.0pp · 2024: -53.8pp
- All cycles
- 2024: R+53.8 2020: R+53.7 2016: R+53.5 2012: R+52.5 2008: R+51.0
Not yet ingested
- Civics
- —
Market trends
- HPI YoY
- ▼ -73.42%
- Current HPI
- 169.408
- Rent YoY
- ▲ 3.16%
- Metro
- Enid, OK
- State GDP YoY
- ▲ 1.55%
- F500 in state
- 6
Industry mix (Fortune 500 HQ in OK)
| Industry | F500 HQs | Revenue |
|---|---|---|
| Energy | 3 | $48B |
|
||
Price history
+1190.0% since first listed2 events — show timeline
- 2026-06-11 Listed $129,000 NWOAR
- 2007-01-18 Sold (Public Records) $10,000 Public Records
Property tax history
+5.9%/yrLatest (2025): $795 · +9.5% YoY. Source: county tax records.
Cash-flow waterfall
monthlySold comps — $/sqft
last 12 mo · ≤1 miLoading sold comps…