75 Bluejay Dr · Santa Rosa, CA
Flood risk 1/10 · Minimal
- FEMA flood zone
- X (unshaded)
- Chance of flooding over 30 yrs
- 0.0%
- Est. flood insurance / yr
- $507 – $1,088
Fire risk 5/10 · Moderate
- Est. fire insurance / yr
- $659 – $1,223
Heat risk 4/10 · Minor
- Hot days now (above 93°F)
- 7 days/yr
- Hot days in 30 yrs
- 16 days/yr
Wind risk 1/10 · Minimal
- Chance of severe wind over 30 yrs
- —
Air-quality risk 10/10 · Severe
- Unhealthy air days now
- 21 days/yr
- Unhealthy air days in 30 yrs
- 21 days/yr
Risk factors via First Street. Map © Google.
Why this score? — see what drove the C grade
The composite is a weighted blend of 9 inputs, each scored 0–100. Each bar is that input's sub-score; the figure is the points it added to the 100-point composite (weight × sub-score).
- Cash flow +28.3/30.0
- DSCR +10.0/10.0
- 1% rule +6.5/10.0
- Livability +3.8/5.0
- Schools +3.7/10.0
- Rent growth +3.3/5.0
- Condition / age +2.5/5.0
- ARV discount +0.0/15.0
- Appreciation +0.0/10.0
$262,500
🖨 Deal sheet 📄 Offer letter ✓ Due diligence
Listing remarks MLS
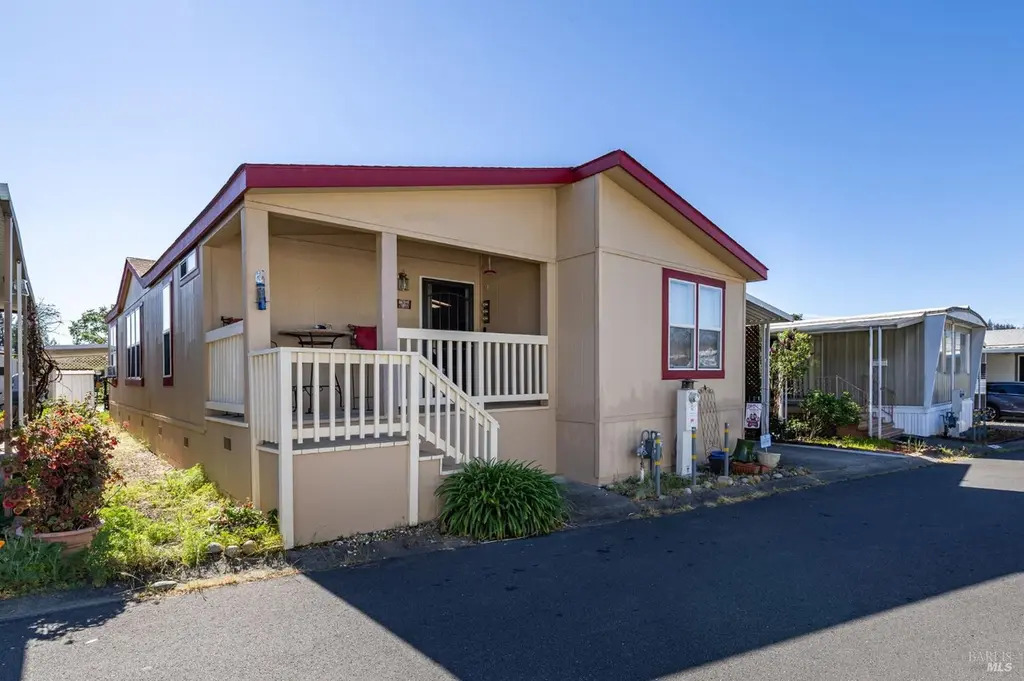
Welcome to one of the best senior communities around. This well maintained 3 bedroom 2 bath home is ready for a new owner to make it their own. This home is well built with cement siding, dual paned windows, large kitchen with island and sky lights, new dish washer, garbage disposal and a great custom shed for all your extra items. Home comes with washer/Dryer and refrigerator. To top it off 2 brand new security doors. Space rent is only $827.33 with the added bonus of water only being 4.62 per month (flat fee)
Key facts
- Cement siding
- Front porch
- Custom shed
Tags
Property features AI
Finance
- Financial info: Land lease: $949/month
- HOA & community: No association; Senior community
Exterior
- Parking: Covered parking; 2 parking spaces
- Utilities: Public sewer
- Home design: Manufactured in park; Double wide; Original condition
- Construction: Manufactured home (Golden West by CMH); Skirt: Other
- Exterior features: Composition roof
Interior
- Kitchen: Dishwasher; Disposal; Free standing gas range; Free standing refrigerator
- Bedrooms: 3 bedrooms
- Flooring: Carpet; Laminate
- Bathrooms: 2 full bathrooms; Shower stall(s); Tub with shower over
- Heating & cooling: Central heating; Ceiling fan(s); Room air conditioning
- Interior features: Skylight(s) in kitchen
- Laundry & utility: Washer included; Dryer included; Laundry inside
Neighborhood map
What this means for you Summary
Snapshot
- This is a 3-bed/2.0-bath manufactured listed at $262k.
Deal economics
- At list price, monthly cash flow is $844 ($10k/yr) — positive.
- The deal already cash-flows at list — no discount required.
- Meets the 1% rule at list price ($3k rent vs $262k).
- Recommended offer: $239k (9.0% below list) — sets the bar for market timing.
- Cap rate 10.2% vs local median 2.5% in Santa Rosa — top-decile yield for the area; either an underpriced asset or a hidden risk that comps aren't pricing in. Stress-test before assuming the spread holds.
Location & tenants
- Location reads 75/100 on livability (#112 in CA, #3,940 nationally) — a middle-class / working-renter tenant base. Strengths: amenities A+, commute A+, employment A+; Watch: schools C-, cost of living F.
- Santa Rosa High (urban): math 31% / reading 47% proficiency, ranked #703 of 1,400 in CA (top 50%) — families likely to look elsewhere, expect single-tenant / working-renter base with shorter leases.
- Market conditions: Rents rising (+3.3%/yr); 154 active listings in the ZIP; 13 comparable units currently listed for rent nearby; rentals leasing fast (median 14d on market — plan ~1-2 weeks tenant-placement turnaround); solid renter incomes; 1,039 units permitted in Sonoma County in 2024 (185 in 5+ unit buildings).
- This rent runs 34% of the median local income ($108k/yr) — at the standard rent-burdened threshold; future hikes will face affordability resistance.
Forward outlook
- Local home prices are declining (-3.0%/yr); year-one equity from $2k of loan paydown is wiped out by about $8k of value loss. Plan a longer hold.
- Sonoma County population projected at +8% by 2050 — modest demand growth; plan on rents tracking national, not racing it.
- At projected returns (-3.0% appreciation + 3.3% rent growth), your $74k cash investment doubles in ~9 years — after that, you're playing with house money.
Negotiation context
- It's been on market 92 days — a 9% lower offer ($239k) is reasonable based on typical stale-listing flexibility.
- 2 sale attempts since 4y ago with the ask held roughly flat each time — persistent listings suggest the price (not the market) is what's stuck; bring a comps-based counter.
Risks & watch-outs
- Climate carrying-cost: moderate wildfire risk — expect insurance premiums to compound above CPI over the hold.
Questions for the listing agent
- It's been on market 92 days. Have you received any prior offers? Is the seller open to a 9% concession, seller financing, or rate buy-down credit?
- Why hasn't it sold? Are there any deal-killer items the seller is aware of (foundation, flood, title, zoning, code violations)?
- Is there a deadline driving the sale (1031 exchange, divorce, estate, relocation)? That informs how much negotiation room exists.
- What's the average days-on-market for RENTAL listings here right now (not sales)? A rising rental-DOM trend means longer vacancies and softer asking-rent achievability than the comps imply.
- What's the recent tenant-quality profile in this submarket — average credit score on applications, eviction rate, late-payment / NSF rate, and stable-employment percentage? A property-management company in the area should have these aggregated.
- How much new for-sale + rental construction is in the pipeline within 1–3 miles? Heavy new supply typically softens prices + rents 12–24 months out; constrained supply supports both.
Investment metrics
- 1% rule
- 1.15% ✓
- Cap rate
- 10.15%
- Cash-on-cash
- 13.78%
- DSCR
- 1.61
- GRM
- 7.2
CMA / ARV
- ARV (on-the-fly)
- $199,395
- Comps found
- 8
Show comp detail 8 sales within ~0.75 mi
| Address | Dist | Beds/Ba | Sqft | Sold | Price | $/sf | Match |
|---|---|---|---|---|---|---|---|
| 186 Redwing Dr | 0.17mi | 3/2.0 | 1,400 (-5%) | 2mo | $249,000 | $178 | 82 |
| 34 Maywood Dr | 0.56mi | 2/2.0 (-1) | 1,440 (-2%) | 2mo | $195,000 | $135 | 63 |
| 48 Cardinal Way | 0.07mi | 2/2.0 (-1) | 1,288 (-13%) | 10mo | $244,000 | $189 | 62 |
| 129 Redwing Dr | 0.11mi | 2/1.5 (-1) | 1,300 (-12%) | 19mo | $148,000 | $114 | 52 |
| 65 Brier Pl | 0.46mi | 3/2.0 | 1,344 (-9%) | 15mo | $250,000 | $186 | 51 |
| 35 Maywood Dr | 0.55mi | 2/2.0 (-1) | 1,368 (-7%) | 12mo | $170,000 | $124 | 47 |
| 26 Tiffany Pl #26 | 0.56mi | 2/2.0 (-1) | 1,344 (-9%) | 12mo | $170,000 | $126 | 43 |
| 2 Larkspur Pl | 0.61mi | 2/2.0 (-1) | 1,344 (-9%) | 18mo | $119,000 | $89 | 36 |
Match score weights: distance 35% · size 25% · config 20% · recency 20%. Top-matched comps best support the ARV.
Projected returns pro-forma
-3.0% appreciation · 3.28% rent growth · sell at horizon
- IRR
- 4.2%
- Equity multiple
- 1.16×
- Total profit
- $11,945
- Equity at exit
- $39,140
- IRR
- 13.9%
- Equity multiple
- 2.12×
- Total profit
- $82,654
- Equity at exit
- $22,696
Cash invested: $73,500 (down + closing). Projections, not guarantees.
Landlord ↔ Tenant lean methodology
- Overall (STATE)
- 18 Strongly Tenant-Friendly
- State California
- 18 Strongly Tenant-Friendly · D+13
- County
- — inherits STATE
- City
- — inherits STATE
ZIP-level market 95409
- Rents YoY
- 3.3%
- Active inventory
- 154
- Price-to-rent
- 7.2×
Monthly cashflow live
- Estimated rent
- $3,027 high interval (Pro) →
- Mortgage (P&I)
- −$1,377
- Tax from tax record
- −$61 /mo · $738/yr
- Insurance
- −$109
- HOA
- −$0
- Vacancy / Maint / Mgmt
- −$636
- Net cashflow
- $844
Break-even live
UW: 25.0% down · 7.5% · 30yr · 1.5% tax · 5.0% vac · 8.0% maint · 8.0% mgmt
Financing live
Cash to close
- Down payment
- $65,625
- Closing costs
- $7,875
- Reserves months
- —
- Total cash needed
- —
Loan-product check · same deal, 3 products live
Conventional
25% down · 7.5% · 30yr
- Down + closing
- —
- Monthly P&I
- —
- Monthly cashflow
- —
- DSCR
- —
- Eligible?
- —
Personal DTI + credit; lowest rate.
DSCR
20% down · 8.5% · 30yr
- Down + closing
- —
- Monthly P&I
- —
- Monthly cashflow
- —
- DSCR
- —
- Eligible?
- —
No personal income docs; deal must DSCR.
Hard money
10% down · 12.0% · 12mo
- Down + closing
- —
- Monthly P&I
- —
- Monthly cashflow
- —
- DSCR
- —
- Eligible?
- —
Short-term bridge; refi at stabilization.
Rent comps 13 comps
| Address | Beds | Baths | Sqft | Rent | $/sqft | DOM | Units | Dist |
|---|---|---|---|---|---|---|---|---|
| 4656 Quigg Dr Santa Rosa, CA | 1.0–3.0 | 1.0–2.0 | 950 | $3,270 | $3.44 | 13d | 9 | 0.15mi |
| 1201 Mission Blvd Unit 1255 Santa Rosa, CA | 2.0 | 1.0 | 970 | $2,000 | $2.06 | 13d | 1 | 0.30mi |
| 4145 Shadow Ln Santa Rosa, CA | 1.0–2.0 | 1.0–2.0 | 825 | $2,893 | $3.51 | 13d | 11 | 0.53mi |
| 808 Shady Oak Dr Santa Rosa, CA | 2.0 | 2.0 | 1100 | $2,800 | $2.55 | 13d | 1 | 0.56mi |
| 785 Brush Creek Ln Santa Rosa, CA | 4.0 | 3.5 | 1550 | $4,050 | $2.61 | 13d | 1 | 0.71mi |
| 174 S Boas Dr Santa Rosa, CA | 1.0–2.0 | 1.0–2.0 | 781 | $2,755 | $3.53 | 13d | 6 | 0.77mi |
| 3732 Ahl Park Ct Santa Rosa, CA | 1.0–2.0 | 1.0–2.0 | 1025 | $2,796 | $2.73 | 13d | 7 | 0.80mi |
| 6263 Montecito Blvd Unit 05 Santa Rosa, CA | 2.0 | 1.0 | 1000 | $2,650 | $2.65 | 13d | 1 | 0.83mi |
| 6263 Montecito Blvd Santa Rosa, CA | 2.0 | 1.0 | 1000 | $2,650 | $2.65 | 23d | 1 | 0.84mi |
| 42 Redwood Ct Santa Rosa, CA | 3.0 | 2.0 | 1166 | $2,700 | $2.32 | 13d | 1 | 0.85mi |
| 3637 Sonoma Ave Santa Rosa, CA | 2.0 | 1.5 | 1117 | $2,599 | $2.33 | 13d | 3 | 0.88mi |
| 6600 Montecito Blvd Unit 02 Santa Rosa, CA | 2.0 | 2.0 | 950 | $2,450 | $2.58 | 21d | 1 | 0.90mi |
| 1206 Rincon Meadows Ct Santa Rosa, CA | 3.0 | 2.0 | 1565 | $4,000 | $2.56 | 13d | 1 | 1.47mi |
Listing history 23 events
-
2026-06-18days on market $262,500 Active 92 DOM
-
2026-06-17days on market $262,500 Active 91 DOM
-
2026-06-16days on market $262,500 Active 90 DOM
-
2026-06-15days on market $262,500 Active 89 DOM
-
2026-06-14days on market $262,500 Active 87 DOM
-
2026-06-13days on market $262,500 Active 86 DOM
-
2026-06-10days on market $262,500 Active 84 DOM
-
2026-06-09days on market $262,500 Active 83 DOM
-
2026-06-08days on market $262,500 Active 82 DOM
-
2026-06-07days on market $262,500 Active 81 DOM
-
2026-06-05days on market $262,500 Active 78 DOM
-
2026-06-03pricedays on market $262,500 Active 77 DOM
-
2026-06-02days on market $265,000 Active 76 DOM
-
2026-06-01days on market $265,000 Active 75 DOM
-
2026-05-31days on market $265,000 Active 74 DOM
-
2026-05-30days on market $265,000 Active 73 DOM
-
2026-05-06price $265,000
-
2026-04-06price $270,000
-
2026-03-18$275,000 Active
-
2022-12-23soldstatus $260,000 Closed 518-char remark
Show marketing remark (518 chars)
Welcome to one of the best senior communities around. This well maintained 3 bedroom 2 bath home is ready for a new owner to make it their own. This home is well built with cement siding, dual paned windows, large kitchen with island and sky lights, new dish washer, garbage disposal and a great custom shed for all your extra items. Home comes with washer/Dryer and refrigerator. To top it off 2 brand new security doors. Space rent is only $827.33 with the added bonus of water only being 4.62 per month (flat fee)
-
2022-12-09status Pending 518-char remark
Show marketing remark (518 chars)
Welcome to one of the best senior communities around. This well maintained 3 bedroom 2 bath home is ready for a new owner to make it their own. This home is well built with cement siding, dual paned windows, large kitchen with island and sky lights, new dish washer, garbage disposal and a great custom shed for all your extra items. Home comes with washer/Dryer and refrigerator. To top it off 2 brand new security doors. Space rent is only $827.33 with the added bonus of water only being 4.62 per month (flat fee)
-
2022-11-27historical Contingent (Show) 518-char remark
Show marketing remark (518 chars)
Welcome to one of the best senior communities around. This well maintained 3 bedroom 2 bath home is ready for a new owner to make it their own. This home is well built with cement siding, dual paned windows, large kitchen with island and sky lights, new dish washer, garbage disposal and a great custom shed for all your extra items. Home comes with washer/Dryer and refrigerator. To top it off 2 brand new security doors. Space rent is only $827.33 with the added bonus of water only being 4.62 per month (flat fee)
-
2022-11-04$260,000 Active 518-char remark
Show marketing remark (518 chars)
Welcome to one of the best senior communities around. This well maintained 3 bedroom 2 bath home is ready for a new owner to make it their own. This home is well built with cement siding, dual paned windows, large kitchen with island and sky lights, new dish washer, garbage disposal and a great custom shed for all your extra items. Home comes with washer/Dryer and refrigerator. To top it off 2 brand new security doors. Space rent is only $827.33 with the added bonus of water only being 4.62 per month (flat fee)
ⓘ Source: listings_history table (triggers on properties + properties_extension) + one-shot
backfill from property_details.listing_events for pre-trigger history.
Tax reassessment forecast CA · Resets to sale price
- Current annual tax
- $738 · $61/mo
- Projected year-2 tax
- $1,995 · $166/mo
- Expected delta
- +$1,257/yr (+$105/mo · 170.4%)
ⓘ Screening estimate from a state-policy table — verify with the county assessor before closing.
Climate risk First Street
- Flood 1/10 Low FEMA zone X (unshaded) · 0% chance over 30 yrs
- Wildfire 5/10 Major
- Heat 4/10 Moderate 7 d/yr ≥93°F today · 16 d/yr by 30 yrs out
- Wind 1/10 Low
- Air quality 10/10 Extreme 21 unhealthy d/yr today · 21 by 30 yrs out
Nearby sold comps map
Loading sold comps map…
Walkable amenities ~0.75 mi
Loading nearby amenities…
Taxation est. · year 1
- Rental income
- $36,323
- − Mortgage interest
- −$14,704
- − Property taxes
- −$738
- − Insurance
- −$1,312
- − Repairs & maintenance
- −$2,906
- − Management
- −$2,906
- − Depreciation
- −$7,636
- Taxable income
- $6,121
- Est. tax owed @ 24.0%
- −$1,469
- After-tax cash flow
- $8,657/yr
For passive investors: Depreciation is non-cash, so a rental often shows a tax loss while cash-flowing — sheltering income. Rental losses are passive: they offset passive income freely, and up to $25,000/yr can offset ordinary (W-2) income if you actively participate and your MAGI is under $100k (phasing out to $0 by $150k); unused losses carry forward. On sale, claimed depreciation is recaptured at up to 25%, and gains may owe capital-gains tax (a 1031 exchange can defer both). Figures are a year-1 estimate at your 24.0% rate — not tax advice; consult a CPA.
Schools (NCES district)
- District
- Santa Rosa High
- NCES district ID
- 0635830
- Math proficiency
- 31% —
- Reading proficiency
- 47% —
- Median HH income
- $62,000
- Composite
- 37.25/100
- National rank
- #8972
- State rank
- #703 of 1400 in CA
Livability — Santa Rosa
- Score
- 75/100
- State rank
- #112
- US rank
- #3940
Category grades
Schools grade is shown separately in the Schools card above.
Census & demographics
- Census place
- Santa Rosa, CA
- County
- Sonoma County · 449,805 people
- City population
- 210,074
- Metro
- Santa Rosa-Petaluma, CA
- Population (ZIP)
- 25,616
- Household income
- $107,867
- Rent vs Own
- Severe rent burden
- 908.0
Population outlook (Sonoma County) Hauer SSP2
- Today (2025)
- 539,935 people
- By 2030
- 554,870 · +2.8%
- By 2040
- 573,262 · +6.2%
- By 2050
- 580,715 · +7.6%
- By 2075
- 579,229 · +7.3%
- By 2100
- 547,835 · +1.5%
Race, ethnicity, and origin ACS 2023
- Neighborhood character
- Predominantly White (69%)
- Race & ethnicity
- White 69% Hispanic / Latino 18% Two or more races 11% Asian 7% Native American 1%
- Hispanic origin (detail)
- Mexican 15%
- Common ancestry
- Lithuanian 3% Scotch-Irish 3% Slovak 3%
- Foreign-born
- 14% · Canada, China, Vietnam
- Languages at home
- 79% English-only · Spanish 10% Other Indo-European 3% Chinese 2%
Political lean MEDSL · Sonoma
- 2024 margin
- Solid D (+46.2) · D 71.4% · R 25.2% · Other 3.3%
- 2008→2024 swing
- -3.4pp toward R · 2008: 49.6pp · 2024: 46.2pp
- All cycles
- 2024: D+46.2 2020: D+51.5 2016: D+47.9 2012: D+44.9 2008: D+49.6
Not yet ingested
- Civics
- —
Market trends
- HPI YoY
- ▼ -750.32%
- Current HPI
- 226.8795
- Rent YoY
- ▲ 3.28%
- Metro
- Santa Rosa-Petaluma, CA
- State GDP YoY
- ▲ 3.21%
- F500 in state
- 116
Industry mix (Fortune 500 HQ in CA)
| Industry | F500 HQs | Revenue |
|---|---|---|
| Technology | 27 | $1,492B |
|
||
| Financial Services | 3 | $174B |
|
||
| Retail | 3 | $44B |
|
||
| Insurance | 3 | $26B |
|
||
| Media / Entertainment | 2 | $115B |
|
||
| Pharmaceuticals / Biotech | 2 | $62B |
|
||
Price history
+1.9% since first listed7 events — show timeline
- 2026-05-06 Price Changed $265,000 BAREIS
- 2026-04-06 Price Changed $270,000 BAREIS
- 2026-03-18 Listed $275,000 BAREIS
- 2022-12-23 Sold (MLS) $260,000 BAREIS
- 2022-12-09 Pending — BAREIS
- 2022-11-27 Contingent — BAREIS
- 2022-11-04 Listed $260,000 BAREIS
Property tax history
-3.8%/yrLatest (2021): $738 · -0.7% YoY. Source: county tax records.
Cash-flow waterfall
monthlySold comps — $/sqft
last 12 mo · ≤1 miLoading sold comps…