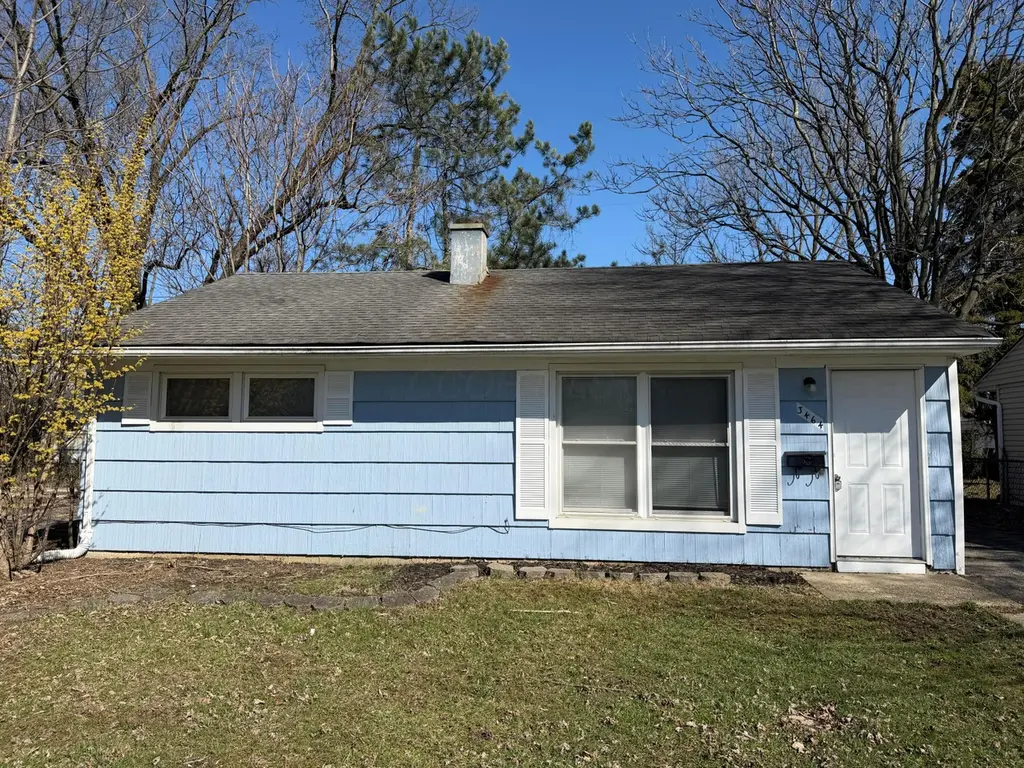
3464 Ontario St · Columbus, OH
Flood risk 1/10 · Minimal
- FEMA flood zone
- X (unshaded)
- Chance of flooding over 30 yrs
- 0.0%
- Est. flood insurance / yr
- $507 – $1,088
Fire risk 1/10 · Minimal
- Est. fire insurance / yr
- $713 – $1,323
Heat risk 3/10 · Minor
- Hot days now (above 99°F)
- 7 days/yr
- Hot days in 30 yrs
- 18 days/yr
Wind risk 2/10 · Minimal
- Chance of severe wind over 30 yrs
- 1.0%
Air-quality risk 3/10 · Minor
- Unhealthy air days now
- 2 days/yr
- Unhealthy air days in 30 yrs
- 4 days/yr
Risk factors via First Street. Map © Google.
Why this score? — see what drove the C- grade
The composite is a weighted blend of 9 inputs, each scored 0–100. Each bar is that input's sub-score; the figure is the points it added to the 100-point composite (weight × sub-score).
- Cash flow +16.6/30.0
- ARV discount +15.0/15.0
- DSCR +5.2/10.0
- 1% rule +4.5/10.0
- Livability +4.0/5.0
- Rent growth +3.5/5.0
- Condition / age +2.5/5.0
- Schools +1.7/10.0
- Appreciation +0.0/10.0
$124,900
🖨 Deal sheet 📄 Offer letter ✓ Due diligence
Listing remarks MLS
Welcome home to this well-maintained North Columbus gem offering easy single-level living and thoughtful updates throughout. This 2-bedroom home features solid surface flooring installed in 2019, providing both durability and a clean, modern look across the entire space. Enjoy the convenience of a private driveway and the added bonus of a fenced backyard--perfect for pets, entertaining, or simply relaxing outdoors. A storage shed offers extra space for tools and equipment. Major mechanical updates provide peace of mind, including a new hot water tank (2019) and furnace (2023). The kitchen is equipped with a newer stove (2024), and the interior has been freshly painted in 2025, giving the home a bright, refreshed feel. Whether you're a first-time buyer, downsizing, or looking for a turnkey investment, this home checks all the boxes with its updates, functionality, and desirable North Columbus location.
Key facts
- 5,227 sq ft lot
- Built 1953
- Listed 77 days
Neighborhood map
What this means for you Summary
Snapshot
- This is a 2-bed/1.0-bath single-family listed at $125k.
Deal economics
- At list price, monthly cash flow is $76 ($911/yr) — positive.
- The deal already cash-flows at list — no discount required.
- To meet the 1% rule (rent ≥ 1% of price), the offer needs to be $119k (5.0% below list).
- Recommended offer: $117k (6.0% below list) — sets the bar for market timing.
- Cap rate 7.0% vs local median 3.8% in Columbus — top-decile yield for the area; either an underpriced asset or a hidden risk that comps aren't pricing in. Stress-test before assuming the spread holds.
Location & tenants
- Location reads 81/100 on livability (#97 in OH, #1,491 nationally) — a professional / high-income tenant draw. Strengths: commute A+, cost of living A+, housing A+; Watch: employment C-, crime F.
- Columbus City School District (urban): math 15% / reading 26% proficiency, ranked #626 of 656 in OH (top 95%) — low school quality limits family demand, transient renter base, plan for 1-2y turnover; 72% free/reduced lunch — lower-income household profile, screen leases tightly.
- Market conditions: Rents rising fast (+4.2%/yr); 100 active listings in the ZIP; 40 comparable units currently listed for rent nearby; rentals at typical pace (median 24d on market — plan ~3-4 weeks tenant-placement turnaround); 8,139 units permitted in Franklin County in 2024 (5,940 in 5+ unit buildings).
Forward outlook
- Local home prices are declining (-3.0%/yr); year-one equity from $864 of loan paydown is wiped out by about $4k of value loss. Plan a longer hold.
- Franklin County population projected at +34% by 2050 — long-run rental-demand tailwind backs the buy-and-hold thesis.
Negotiation context
- It's been on market 77 days — a 6% lower offer ($117k) is reasonable based on typical stale-listing flexibility.
- 4 sale attempts since 13y ago; this cycle's ask has dropped $25k (17%) from the opening price — seller is motivated, your offer sets the floor, not the list.
- Current owner paid $37k; list at $125k implies a 240% gain — meaningful room to come down on a strong offer.
Risks & watch-outs
- Watch-outs: built in 1953 — expect roof / HVAC / electrical / plumbing capex.
Questions for the listing agent
- It's been on market 77 days. Have you received any prior offers? Is the seller open to a 6% concession, seller financing, or rate buy-down credit?
- Built in 1953 — when were the roof, HVAC, electrical panel, plumbing, and water heater last replaced?
- Why hasn't it sold? Are there any deal-killer items the seller is aware of (foundation, flood, title, zoning, code violations)?
- Is there a deadline driving the sale (1031 exchange, divorce, estate, relocation)? That informs how much negotiation room exists.
- Crime grade is F in this area — have there been break-ins, vandalism, or insurance claims at this property in the last 3 years? What carrier currently insures it and at what premium?
- What's the average days-on-market for RENTAL listings here right now (not sales)? A rising rental-DOM trend means longer vacancies and softer asking-rent achievability than the comps imply.
- What's the recent tenant-quality profile in this submarket — average credit score on applications, eviction rate, late-payment / NSF rate, and stable-employment percentage? A property-management company in the area should have these aggregated.
- How much new for-sale + rental construction is in the pipeline within 1–3 miles? Heavy new supply typically softens prices + rents 12–24 months out; constrained supply supports both.
Investment metrics
- 1% rule
- 0.95% ✗
- Cap rate
- 7.02%
- Cash-on-cash
- 2.61%
- DSCR
- 1.12
- GRM
- 8.8
CMA / ARV
- ARV (median comp)
- $186,448
- List price
- $124,900
- Delta
- -33.01%
- Verdict
- UNDERPRICED
- Comps
- 20 within 1.0 mi
Show comp detail 12 sales within ~0.75 mi
| Address | Dist | Beds/Ba | Sqft | Sold | Price | $/sf | Match |
|---|---|---|---|---|---|---|---|
| 3491 Ontario St | 0.05mi | 3/1.0 (+1) | 825 (0%) | 3mo | $137,000 | $166 | 90 |
| 3585 Gerbert Rd | 0.18mi | 2/1.0 | 792 (-4%) | 2mo | $180,000 | $227 | 83 |
| 3606 Karl Rd | 0.25mi | 2/1.0 | 792 (-4%) | 0mo | $226,000 | $285 | 82 |
| 3585 Ontario St | 0.18mi | 3/1.0 (+1) | 925 (+12%) | 1mo | $215,000 | $232 | 66 |
| 1242 Acton Rd | 0.44mi | 3/1.0 (+1) | 864 (+5%) | 3mo | $185,000 | $214 | 64 |
| 3613 Homestead Dr | 0.23mi | 3/1.0 (+1) | 925 (+12%) | 1mo | $108,000 | $117 | 64 |
| 1507 Elmore Ave | 0.33mi | 3/1.0 (+1) | 909 (+10%) | 4mo | $155,000 | $171 | 60 |
| 1382 Elmore Ave | 0.42mi | 2/1.0 | 720 (-13%) | 7mo | $182,800 | $254 | 54 |
| 3555 Sunny Glen Pl | 0.71mi | 3/2.0 (+1) | 864 (+5%) | 2mo | $150,000 | $174 | 49 |
| 1090 Pauline Ave | 0.62mi | 3/1.5 (+1) | 912 (+10%) | 4mo | $170,000 | $186 | 43 |
| 1064 Urana Ave | 0.64mi | 2/1.0 | 720 (-13%) | 8mo | $194,900 | $271 | 43 |
| 3147 Grasmere Ave | 0.65mi | 3/1.0 (+1) | 930 (+13%) | 2mo | $140,000 | $151 | 42 |
Match score weights: distance 35% · size 25% · config 20% · recency 20%. Top-matched comps best support the ARV.
Projected returns pro-forma
-3.0% appreciation · 4.16% rent growth · sell at horizon
- IRR
- -10.9%
- Equity multiple
- 0.60×
- Total profit
- $-13,986
- Equity at exit
- $18,623
- IRR
- 0.0%
- Equity multiple
- 1.00×
- Total profit
- $4
- Equity at exit
- $10,799
Cash invested: $34,972 (down + closing). Projections, not guarantees.
Landlord ↔ Tenant lean methodology
- Overall (STATE)
- 73 Landlord-Friendly
- State Ohio
- 73 Landlord-Friendly · R+6
- County
- — inherits STATE
- City
- — inherits STATE
ZIP-level market 43224
- Rents YoY
- 4.2%
- Active inventory
- 100
- Price-to-rent
- 8.8×
Monthly cashflow live
- Estimated rent
- $1,187 high interval (Pro) →
- Mortgage (P&I)
- −$655
- Tax from tax record
- −$155 /mo · $1,855/yr
- Insurance
- −$52
- HOA
- −$0
- Vacancy / Maint / Mgmt
- −$249
- Net cashflow
- $76
Break-even live
UW: 25.0% down · 7.5% · 30yr · 1.5% tax · 5.0% vac · 8.0% maint · 8.0% mgmt
Financing live
Cash to close
- Down payment
- $31,225
- Closing costs
- $3,747
- Reserves months
- —
- Total cash needed
- —
Loan-product check · same deal, 3 products live
Conventional
25% down · 7.5% · 30yr
- Down + closing
- —
- Monthly P&I
- —
- Monthly cashflow
- —
- DSCR
- —
- Eligible?
- —
Personal DTI + credit; lowest rate.
DSCR
20% down · 8.5% · 30yr
- Down + closing
- —
- Monthly P&I
- —
- Monthly cashflow
- —
- DSCR
- —
- Eligible?
- —
No personal income docs; deal must DSCR.
Hard money
10% down · 12.0% · 12mo
- Down + closing
- —
- Monthly P&I
- —
- Monthly cashflow
- —
- DSCR
- —
- Eligible?
- —
Short-term bridge; refi at stabilization.
Rent comps 40 comps
| Address | Beds | Baths | Sqft | Rent | $/sqft | DOM | Units | Dist |
|---|---|---|---|---|---|---|---|---|
| 3461 Gerbert Rd Columbus, OH | 3.0 | 1.0 | 900 | $1,350 | $1.50 | 43d | 1 | 0.10mi |
| 1358 Pauline Ave Columbus, OH | 2.0 | 1.5 | 930 | $1,650 | $1.77 | 23d | 1 | 0.23mi |
| 3267 Walmar Dr Columbus, OH | 3.0 | 1.0 | 1106 | $1,550 | $1.40 | 23d | 1 | 0.32mi |
| 1517 Elmore Ave Columbus, OH | 2.0 | 1.0 | 720 | $1,600 | $2.22 | 14d | 1 | 0.36mi |
| 1449 Elmore Ave Columbus, OH | 2.0 | 1.0 | 850 | $1,025 | $1.21 | 14d | 1 | 0.37mi |
| 3327 McGuffey Rd Columbus, OH | 3.0 | 1.0 | 1100 | $1,335 | $1.21 | 7d | 1 | 0.39mi |
| 1549-1551 Oakland Park Ave Columbus, OH | 2.0 | 1.0 | 832 | $1,100 | $1.32 | 21d | 1 | 0.41mi |
| 3257 Cleveland Ave Apt C Columbus, OH | 2.0 | 1.0 | 975 | $1,000 | $1.03 | 43d | 1 | 0.56mi |
| 3137 Mcguffey Rd Columbus, OH | 2.0 | 1.0 | 950 | $950 | $1.00 | 43d | 1 | 0.61mi |
| 3120 Grasmere Ave Columbus, OH | 2.0 | 1.0 | 842 | $1,395 | $1.66 | 3d | 1 | 0.65mi |
| 1870 Dunbar Dr Apt B4 Columbus, OH | 1.0 | 1.0 | 700 | $850 | $1.21 | 23d | 1 | 0.65mi |
| 3088 Grasmere Ave Columbus, OH | 2.0 | 1.0 | 800 | $1,000 | $1.25 | 23d | 1 | 0.69mi |
| 3054 McGuffey Rd Columbus, OH | 3.0 | 1.0 | 1106 | $1,450 | $1.31 | 43d | 1 | 0.69mi |
| 3086-3092 Grasmere Ave Unit 3088 Columbus, OH | 2.0 | 1.0 | 800 | $1,000 | $1.25 | 23d | 1 | 0.69mi |
| 3607 Cleveland Ave Columbus, OH | 1.0 | 1.0 | 800 | $825 | $1.03 | 10d | 1 | 0.77mi |
| 1011 Mohican Ave Columbus, OH | 3.0 | 1.0 | 1091 | $1,399 | $1.28 | 43d | 1 | 0.78mi |
| 3998 Stonegate Sq W Columbus, OH | 1.0–2.0 | 1.0 | 872 | $1,100 | $1.26 | 43d | 5 | 0.80mi |
| 1952 Oakland Park Ave Unit C Columbus, OH | 2.0 | 1.0 | 1000 | $900 | $0.90 | 23d | 1 | 0.80mi |
| 1952 Oakland Park Ave Apt A Columbus, OH | 2.0 | 1.0 | 1000 | $1,050 | $1.05 | 43d | 1 | 0.80mi |
| 1954 Oakland Park Ave Unit C Columbus, OH | 2.0 | 1.0 | 1000 | $1,050 | $1.05 | 43d | 1 | 0.81mi |
| 3601 Maize Rd Unit 955-B Columbus, OH | 2.0 | 1.0 | 800 | $975 | $1.22 | 7d | 1 | 0.84mi |
| 965 Fairglade Ln Columbus, OH | 2.0 | 1.0 | 850 | $975 | $1.15 | 43d | 1 | 0.85mi |
| 3421-3431 Maize Rd Unit 3421-A Columbus, OH | 2.0 | 1.5 | 960 | $1,295 | $1.35 | 14d | 1 | 0.87mi |
| 940 E North Broadway St Columbus, OH | 1.0 | 1.0 | 650 | $795 | $1.22 | 43d | 1 | 0.87mi |
| 2888 Cleveland Ave Unit F Columbus, OH | 1.0 | 1.0 | 680 | $825 | $1.21 | 10d | 1 | 0.90mi |
| 2888 Cleveland Ave Unit D Columbus, OH | 1.0 | 1.0 | 680 | $825 | $1.21 | 43d | 1 | 0.90mi |
| 2132 Elmore Ave Columbus, OH | 3.0 | 1.0 | 1000 | $1,245 | $1.25 | 23d | 1 | 0.90mi |
| 1928 Agler Rd Columbus, OH | 2.0 | 1.0 | 1000 | $875 | $0.88 | 43d | 1 | 0.95mi |
| 1849 Robert St Columbus, OH | 3.0 | 1.0 | 816 | $1,300 | $1.59 | 3d | 1 | 0.96mi |
| 3199 Maize Rd Columbus, OH | 2.0 | 1.0 | 800 | $1,150 | $1.44 | 23d | 1 | 0.96mi |
| 2942 Atwood Ter Columbus, OH | 2.0 | 1.0 | 962 | $1,200 | $1.25 | 43d | 1 | 0.97mi |
| 2765 Cleveland Ave Unit B Columbus, OH | 2.0 | 1.0 | 1100 | $990 | $0.90 | 17d | 1 | 1.03mi |
| 1748 Ward Rd Columbus, OH | 3.0 | 1.0 | 914 | $1,425 | $1.56 | 23d | 1 | 1.03mi |
| 854 Moon Rd Columbus, OH | 2.0 | 1.0 | 864 | $799 | $0.92 | 19d | 1 | 1.03mi |
| 4117 Karl Rd #304 Columbus, OH | 2.0 | 2.0 | 966 | $1,100 | $1.14 | 12d | 1 | 1.06mi |
| 2846 Joyce Ave Apt C Columbus, OH | 2.0 | 1.0 | 645 | $815 | $1.26 | 23d | 1 | 1.09mi |
| 3788 Cleveland Ave Columbus, OH | 1.0 | 1.0 | 725 | $805 | $1.11 | 10d | 12 | 1.09mi |
| 3617 Beulah Rd Columbus, OH | 2.0 | 1.0 | 900 | $1,124 | $1.25 | 23d | 1 | 1.09mi |
| 2175 Ormond Ave Columbus, OH | 1.0 | 1.0 | 528 | $950 | $1.80 | 43d | 1 | 1.10mi |
| 780 E Brighton Rd Columbus, OH | 3.0 | 1.0 | 1086 | $1,500 | $1.38 | 7d | 1 | 1.13mi |
Listing history 30 events
-
2026-06-18days on market $124,900 Active 77 DOM
-
2026-06-17days on market $124,900 Active 76 DOM
-
2026-06-16days on market $124,900 Active 75 DOM
-
2026-06-15days on market $124,900 Active 74 DOM
-
2026-06-13days on market $124,900 Active 72 DOM
-
2026-06-13days on market $124,900 Active 71 DOM
-
2026-06-09days on market $124,900 Active 68 DOM
-
2026-06-08days on market $124,900 Active 67 DOM
-
2026-06-07days on market $124,900 Active 66 DOM
-
2026-06-05days on market $124,900 Active 63 DOM
-
2026-06-03days on market $124,900 Active 62 DOM
-
2026-06-02days on market $124,900 Active 61 DOM
-
2026-06-01days on market $124,900 Active 60 DOM
-
2026-05-31days on market $124,900 Active 59 DOM
-
2026-04-02$150,000 Active 914-char remark
Show marketing remark (914 chars)
Welcome home to this well-maintained North Columbus gem offering easy single-level living and thoughtful updates throughout. This 2-bedroom home features solid surface flooring installed in 2019, providing both durability and a clean, modern look across the entire space. Enjoy the convenience of a private driveway and the added bonus of a fenced backyard--perfect for pets, entertaining, or simply relaxing outdoors. A storage shed offers extra space for tools and equipment. Major mechanical updates provide peace of mind, including a new hot water tank (2019) and furnace (2023). The kitchen is equipped with a newer stove (2024), and the interior has been freshly painted in 2025, giving the home a bright, refreshed feel. Whether you're a first-time buyer, downsizing, or looking for a turnkey investment, this home checks all the boxes with its updates, functionality, and desirable North Columbus location.
-
2024-10-17historical $1,050
-
2024-10-04price $1,050
-
2024-09-27price $1,090
-
2024-09-21price $1,120
-
2024-09-07$1,150
-
2016-11-14soldstatus $36,730 Closed 37-char remark
Show marketing remark (37 chars)
Tenant's Rights and Curb Offers only.
-
2016-09-09historical Contingent Finance and Inspection 37-char remark
Show marketing remark (37 chars)
Tenant's Rights and Curb Offers only.
-
2016-06-09price $44,900 37-char remark
Show marketing remark (37 chars)
Tenant's Rights and Curb Offers only.
-
2016-03-19$54,900 Active 37-char remark
Show marketing remark (37 chars)
Tenant's Rights and Curb Offers only.
-
2013-10-30soldstatus $27,400
-
2013-09-19historical
-
2013-07-03$29,900
-
1992-06-25soldstatus $41,875
-
1990-05-11soldstatus $42,252
-
1986-05-13soldstatus $36,900
ⓘ Source: listings_history table (triggers on properties + properties_extension) + one-shot
backfill from property_details.listing_events for pre-trigger history.
Tax reassessment forecast OH · Partial reset (capped growth)
- Current annual tax
- $1,855 · $155/mo
- Projected year-2 tax
- $1,902 · $158/mo
- Expected delta
- +$47/yr (+$4/mo · 2.5%)
ⓘ Screening estimate from a state-policy table — verify with the county assessor before closing.
Climate risk First Street
- Flood 1/10 Low FEMA zone X (unshaded) · 0% chance over 30 yrs
- Wildfire 1/10 Low
- Heat 3/10 Moderate 7 d/yr ≥99°F today · 18 d/yr by 30 yrs out
- Wind 2/10 Low 100% chance of damaging wind over 30 yrs
- Air quality 3/10 Moderate 2 unhealthy d/yr today · 4 by 30 yrs out
Nearby sold comps map
Loading sold comps map…
Walkable amenities ~0.75 mi
Loading nearby amenities…
Taxation est. · year 1
- Rental income
- $14,241
- − Mortgage interest
- −$6,996
- − Property taxes
- −$1,855
- − Insurance
- −$624
- − Repairs & maintenance
- −$1,139
- − Management
- −$1,139
- − Depreciation
- −$3,633
- Taxable loss
- −$1,147
- Est. tax savings @ 24.0%
- +$275
- After-tax cash flow
- $1,186/yr
For passive investors: Depreciation is non-cash, so a rental often shows a tax loss while cash-flowing — sheltering income. Rental losses are passive: they offset passive income freely, and up to $25,000/yr can offset ordinary (W-2) income if you actively participate and your MAGI is under $100k (phasing out to $0 by $150k); unused losses carry forward. On sale, claimed depreciation is recaptured at up to 25%, and gains may owe capital-gains tax (a 1031 exchange can defer both). Figures are a year-1 estimate at your 24.0% rate — not tax advice; consult a CPA.
Schools (NCES district)
- District
- Columbus City School District
- NCES district ID
- 3904380
- Math proficiency
- 15% ▼ -17.00%
- Reading proficiency
- 26% ▼ -12.00%
- Median HH income
- $38,483
- Composite
- 17.19/100
- National rank
- #9105
- State rank
- #626 of 656 in OH
Livability — Columbus
- Score
- 81/100
- State rank
- #97
- US rank
- #1491
Category grades
Schools grade is shown separately in the Schools card above.
Census & demographics
- Census place
- Columbus, OH
- County
- Franklin County · 1,351,780 people
- City population
- 612,189
- Metro
- Columbus, OH
- Population (ZIP)
- 44,319
- Household income
- $53,321
- Rent vs Own
- Severe rent burden
- 1730.0
Population outlook (Franklin County) Hauer SSP2
- Today (2025)
- 1,456,139 people
- By 2030
- 1,556,890 · +6.9%
- By 2040
- 1,757,349 · +20.7%
- By 2050
- 1,950,539 · +34.0%
- By 2075
- 2,376,171 · +63.2%
- By 2100
- 2,636,796 · +81.1%
Race, ethnicity, and origin ACS 2023
- Neighborhood character
- Diverse neighborhood (Simpson 0.66)
- Race & ethnicity
- Black 43% White 39% Hispanic / Latino 10% Two or more races 9% Asian 2%
- Hispanic origin (detail)
- Mexican 6% Dominican 1%
- Common ancestry
- Romanian 1% Hispanic 1% Italian 1%
- Foreign-born
- 22% · Canada, Vietnam
- Languages at home
- 71% English-only · Spanish 8% French/Haitian/Cajun 4% Arabic 1%
Political lean MEDSL · Franklin
- 2024 margin
- Strong D (+28.4) · D 63.7% · R 35.3% · Other 1.0%
- 2008→2024 swing
- +7.7pp toward D · 2008: 20.7pp · 2024: 28.4pp
- All cycles
- 2024: D+28.4 2020: D+31.4 2016: D+25.9 2012: D+21.7 2008: D+20.7
Not yet ingested
- Civics
- —
Market trends
- HPI YoY
- ▼ -226.58%
- Current HPI
- 274.6336
- Rent YoY
- ▲ 4.16%
- Metro
- Columbus, OH
- State GDP YoY
- ▲ 1.98%
- F500 in state
- 48
Industry mix (Fortune 500 HQ in OH)
| Industry | F500 HQs | Revenue |
|---|---|---|
| Insurance | 3 | $145B |
|
||
| Industrial Machinery | 3 | $49B |
|
||
| Financial Services | 3 | $24B |
|
||
| Consumer Goods | 2 | $93B |
|
||
| Aerospace / Defense | 2 | $47B |
|
||
| Utilities | 2 | $33B |
|
||
Price history
+306.5% since first listed16 events — show timeline
- 2026-04-02 Listed $150,000 CBRMLS
- 2024-10-17 Rental Removed $1,050 RENTALBEAST
- 2024-10-04 Price Changed $1,050 RENTALBEAST
- 2024-09-27 Price Changed $1,090 RENTALBEAST
- 2024-09-21 Price Changed $1,120 RENTALBEAST
- 2024-09-07 Listed for Rent $1,150 RENTALBEAST
- 2016-11-14 Sold (MLS) $36,730 CBRMLS
- 2016-09-09 Contingent — CBRMLS
- 2016-06-09 Price Changed $44,900 CBRMLS
- 2016-03-19 Listed $54,900 CBRMLS
- 2013-10-30 Sold (MLS) $27,400 CBRMLS
- 2013-09-19 Listing Removed — CBRMLS
- 2013-07-03 Listed $29,900 CBRMLS
- 1992-06-25 Sold (Public Records) $41,875 Public Records
- 1990-05-11 Sold (Public Records) $42,252 Public Records
- 1986-05-13 Sold (Public Records) $36,900 Public Records
Property tax history
+9.0%/yrLatest (2024): $1,855 · +1.3% YoY. Source: county tax records.
Cash-flow waterfall
monthlySold comps — $/sqft
last 12 mo · ≤1 miLoading sold comps…