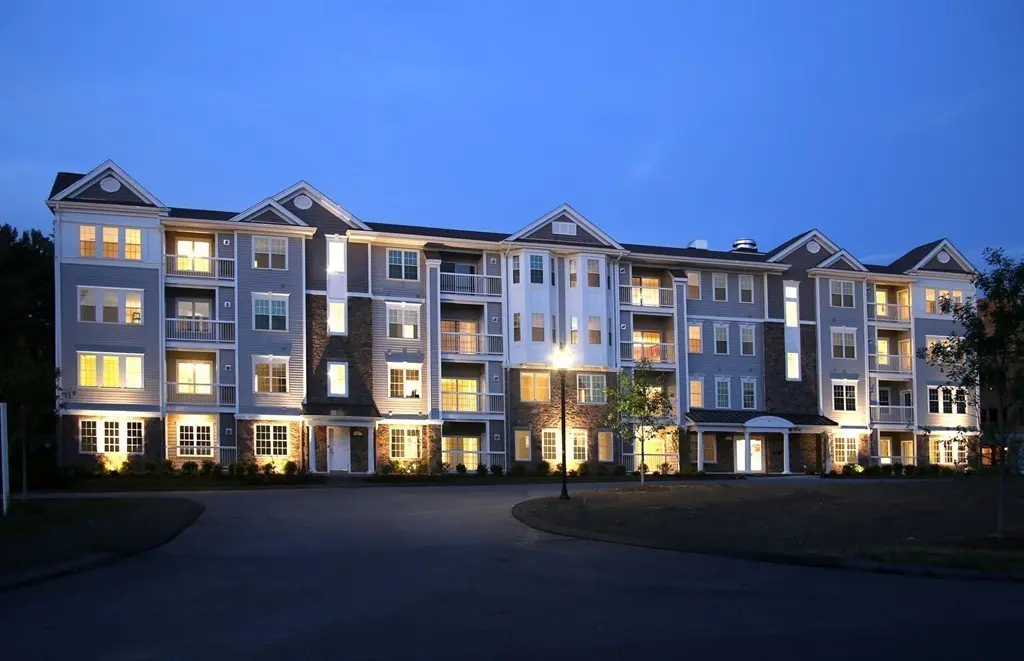
220 Martins Lndg #104 · Wilmington, MA
Flood risk 1/10 · Minimal
- FEMA flood zone
- X (unshaded)
- Chance of flooding over 30 yrs
- 0.0%
- Est. flood insurance / yr
- $507 – $1,088
Fire risk 1/10 · Minimal
- Est. fire insurance / yr
- $915 – $1,699
Heat risk 5/10 · Moderate
- Hot days now (above 97°F)
- 7 days/yr
- Hot days in 30 yrs
- 14 days/yr
Wind risk 6/10 · Moderate
- Chance of severe wind over 30 yrs
- 27.0%
Air-quality risk 3/10 · Minor
- Unhealthy air days now
- 2 days/yr
- Unhealthy air days in 30 yrs
- 3 days/yr
Risk factors via First Street. Map © Google.
Why this score? — see what drove the D grade
The composite is a weighted blend of 9 inputs, each scored 0–100. Each bar is that input's sub-score; the figure is the points it added to the 100-point composite (weight × sub-score).
- ARV discount +13.7/15.0
- Appreciation +10.0/10.0
- Schools +6.2/10.0
- Livability +3.5/5.0
- Cash flow +2.5/30.0
- Rent growth +2.5/5.0
- Condition / age +2.5/5.0
- 1% rule +0.1/10.0
- DSCR +0.0/10.0
$445,000
🖨 Deal sheet (PDF) 📄 Offer letter ✓ Due diligence
Listing remarks MLS
Stop by to see why this is the premier address for your next home. Great value on this home. The active adult 55+ homes are located IN A MODERN, SECURE ELEVATOR BUILDING! This Sunlight Filled, southeast exposure, 956+sf, single level Jensen style home features an open eat-in granite kitchen, large living room w/private balcony, separate den/office, spacious master suite w/walk-in closet, full bath with stall shower, full sized side by side washer & dryer, hardwood flooring plus lots of crown & panel moldings. Quaint, quiet community close to all major highways shopping, recreation & more! Please Visit our Sales Office Open Tuesday - Sunday 10-4, Monday's by Appointment.
Key facts
- Quartz countertops
- Walk-in closet
- Upgraded kitchen
Tags
Neighborhood map
What this means for you Summary
Snapshot
- This is a 1-bed/1.0-bath condo listed at $445k.
Deal economics
- At list price, monthly cash flow is $-2k ($-19k/yr) — negative.
- To cash-flow at today's rent, offer at most $172k (61.4% below list).
- To meet the 1% rule (rent ≥ 1% of price), the offer needs to be $227k (49.1% below list).
- Recommended offer: $172k (61.4% below list) — sets the bar for cash-flow.
Location & tenants
- Location reads 69/100 on livability (#142 in MA) — a middle-class / working-renter tenant base. Strengths: employment A+, housing A+, crime A; Watch: amenities F, commute F, cost of living F.
- North Reading (suburban): math 62% / reading 72% proficiency, ranked #31 of 302 in MA (top 10%) — acceptable for families but not a draw, mixed tenant base, ~2y average lease; only 8% free/reduced lunch — higher-income household profile.
- Zoned schools: J Turner Hood (math 62% / reading 72%, grade B+, #95 of 938 statewide, top 12%, 383 students, 0% FRL); North Reading Middle (math 59% / reading 67%, grade B+, #32 of 305 statewide, top 11%, 541 students, 0% FRL); North Reading High (math 67% / reading 82%, grade B+, #60 of 343 statewide, top 19%, 644 students, 0% FRL).
- Market conditions: 38 active listings in the ZIP; 3 comparable units currently listed for rent nearby; rentals leasing fast (median 7d on market — plan ~1-2 weeks tenant-placement turnaround); high-income renter base; 3,670 units permitted in Middlesex County in 2024 (2,611 in 5+ unit buildings).
Forward outlook
- In year one you build about $48k of equity ($3k loan paydown + $44k appreciation (10.0% local appreciation)).
- Middlesex County population projected at +20% by 2050 — long-run rental-demand tailwind backs the buy-and-hold thesis.
- By year 2, paydown + projected appreciation supports a ~$76k cash-out refi (75% LTV) — recoverable capital for the next deal without selling this one.
Negotiation context
- It's been on market 37 days — a 3% lower offer ($432k) is reasonable based on typical stale-listing flexibility.
- Current owner paid $340k; 31% above their basis — modest negotiation headroom, anchor on the comps not their cost.
Risks & watch-outs
- Climate carrying-cost: major wind risk, 27% chance of damaging wind over 30y; extreme-heat days projected 7→14/yr by 2055 (HVAC capex compounding) — expect insurance premiums to compound above CPI over the hold.
Questions for the listing agent
- What do current leases actually rent for vs. the listed asking? Can we see a recent rent roll and the last 12 months of T-12 income?
- It's been on market 37 days. Have you received any prior offers? Is the seller open to a 61% concession, seller financing, or rate buy-down credit?
- What does the HOA fee cover, when was the last increase, and are there any pending special assessments or reserve-fund shortfalls?
- Any open or pending special assessments — roof, HVAC, plumbing, elevator, façade? What's the per-unit balance and payoff schedule, and is the seller paying it off at close or rolling it to the buyer?
- Is there a deadline driving the sale (1031 exchange, divorce, estate, relocation)? That informs how much negotiation room exists.
- Schools are A-rated — typically a magnet for longer-tenancy family renters. What's the average tenant stay here, and is there a school-zone premium baked into asking?
- The area grade is low — what's the realistic commute time and amenity access for the typical tenant pool here? Any planned neighborhood developments (good or bad) we should know about?
- What's the average days-on-market for RENTAL listings here right now (not sales)? A rising rental-DOM trend means longer vacancies and softer asking-rent achievability than the comps imply.
- What's the recent tenant-quality profile in this submarket — average credit score on applications, eviction rate, late-payment / NSF rate, and stable-employment percentage? A property-management company in the area should have these aggregated.
- How much new apartment / multifamily construction is in the pipeline within 1–3 miles? Heavy new supply (>2% of stock underway) typically softens rents 12–24 months out; light construction supports rent growth.
Investment metrics
- 1% rule
- 0.51% ✗
- Cap rate
- 2.12%
- Cash-on-cash
- -14.91%
- DSCR
- 0.34
- GRM
- 16.4
CMA / ARV
- ARV (median comp)
- $516,158
- List price
- $445,000
- Delta
- -13.79%
- Verdict
- UNDERPRICED
- Comps
- 20 within 1.0 mi
Projected returns pro-forma
10.0% appreciation · 3.0% rent growth · sell at horizon
- IRR
- 13.9%
- Equity multiple
- 2.16×
- Total profit
- $143,983
- Equity at exit
- $400,891
- IRR
- 14.0%
- Equity multiple
- 5.03×
- Total profit
- $501,911
- Equity at exit
- $864,537
Cash invested: $124,600 (down + closing). Projections, not guarantees.
Landlord ↔ Tenant lean methodology
- Overall (STATE)
- 20 Strongly Tenant-Friendly
- State Massachusetts
- 20 Strongly Tenant-Friendly · D+15
- County
- — inherits STATE
- City
- — inherits STATE
ZIP-level market 01864
- Home prices YoY
- 3.7%
- Active inventory
- 38
- Price-to-rent
- 16.4×
Monthly cashflow live
- Estimated rent
- $2,266 medium interval (Pro) →
- Mortgage (P&I)
- −$2,334
- Tax from tax record
- −$438 /mo · $5,255/yr
- Insurance
- −$185
- HOA
- −$381
- Vacancy / Maint / Mgmt
- −$476
- Net cashflow
- $-1,548
Break-even live
Sensitivity live
| Price | -10% $-1,296 | -5% $-1,422 | +0% $-1,548 | +5% $-1,674 | +10% $-1,800 |
|---|---|---|---|---|---|
| Rent | -10% $-1,727 | -5% $-1,637 | +0% $-1,548 | +5% $-1,458 | +10% $-1,369 |
| Rate | -1.0pp $-1,324 | -0.5pp $-1,434 | base $-1,548 | +0.5pp $-1,663 | +1.0pp $-1,780 |
UW: 25.0% down · 7.5% · 30yr · 1.5% tax · 5.0% vac · 8.0% maint · 8.0% mgmt
Financing live
Cash to close
- Down payment
- $111,250
- Closing costs
- $13,350
- Reserves months
- —
- Total cash needed
- —
Loan-product check · same deal, 3 products live
Conventional
25% down · 7.5% · 30yr
- Down + closing
- —
- Monthly P&I
- —
- Monthly cashflow
- —
- DSCR
- —
- Eligible?
- —
Personal DTI + credit; lowest rate.
DSCR
20% down · 8.5% · 30yr
- Down + closing
- —
- Monthly P&I
- —
- Monthly cashflow
- —
- DSCR
- —
- Eligible?
- —
No personal income docs; deal must DSCR.
Hard money
10% down · 12.0% · 12mo
- Down + closing
- —
- Monthly P&I
- —
- Monthly cashflow
- —
- DSCR
- —
- Eligible?
- —
Short-term bridge; refi at stabilization.
Rent comps 3 comps
| Address | Beds | Baths | Sqft | Rent | $/sqft | DOM | Units | Dist |
|---|---|---|---|---|---|---|---|---|
| 40 Main St #15 North Reading, MA | 2.0 | 1.0 | 738 | $2,300 | $3.12 | 7d | 1 | 1.38mi |
| A1 Colonial Dr #5 Andover, MA | 2.0 | 1.0 | 792 | $2,300 | $2.90 | 45d | 1 | 1.39mi |
| 1 Avalon Dr Wilmington, MA | 1.0–3.0 | 1.0–2.0 | 1194 | $2,565 | $2.15 | 0d | 1 | 1.47mi |
HOA detail condo
- Monthly dues
- $381 · $4,572/yr
- Assessments
- None detected in remarks — confirm with the listing agent.
Listing history 16 events
-
2026-06-21days on market $445,000 Active 37 DOM
-
2026-06-18days on market $445,000 Active 34 DOM
-
2026-06-17days on market $445,000 Active 33 DOM
-
2026-06-16days on market $445,000 Active 32 DOM
-
2026-06-15days on market $445,000 Active 31 DOM
-
2026-06-13days on market $445,000 Active 29 DOM
-
2026-06-09days on market $445,000 Active 25 DOM
-
2026-06-08days on market $445,000 Active 24 DOM
-
2026-06-08status $445,000 Active 23 DOM
-
2026-06-07days on market $445,000 Back On Market 23 DOM
-
2026-06-04days on market $445,000 Back On Market 20 DOM
-
2026-06-03statusdays on market $445,000 Back On Market 19 DOM
-
2020-05-05soldstatus $340,000 Sold 691-char remark
Show marketing remark (691 chars)
Stop by to see why this is the premier address for your next home. Great value on this home. The active adult 55+ homes are located IN A MODERN, SECURE ELEVATOR BUILDING! This Sunlight Filled, southeast exposure, 956+sf, single level Jensen style home features an open eat-in granite kitchen, large living room w/private balcony, separate den/office, spacious master suite w/walk-in closet, full bath with stall shower, full sized side by side washer & dryer, hardwood flooring plus lots of crown & panel moldings. Quaint, quiet community close to all major highways shopping, recreation & more! Please Visit our Sales Office Open Tuesday - Sunday 10-4, Monday's by Appointment.
-
2020-03-01status Under Agreement 691-char remark
Show marketing remark (691 chars)
Stop by to see why this is the premier address for your next home. Great value on this home. The active adult 55+ homes are located IN A MODERN, SECURE ELEVATOR BUILDING! This Sunlight Filled, southeast exposure, 956+sf, single level Jensen style home features an open eat-in granite kitchen, large living room w/private balcony, separate den/office, spacious master suite w/walk-in closet, full bath with stall shower, full sized side by side washer & dryer, hardwood flooring plus lots of crown & panel moldings. Quaint, quiet community close to all major highways shopping, recreation & more! Please Visit our Sales Office Open Tuesday - Sunday 10-4, Monday's by Appointment.
-
2020-01-20price $344,995 691-char remark
Show marketing remark (691 chars)
Stop by to see why this is the premier address for your next home. Great value on this home. The active adult 55+ homes are located IN A MODERN, SECURE ELEVATOR BUILDING! This Sunlight Filled, southeast exposure, 956+sf, single level Jensen style home features an open eat-in granite kitchen, large living room w/private balcony, separate den/office, spacious master suite w/walk-in closet, full bath with stall shower, full sized side by side washer & dryer, hardwood flooring plus lots of crown & panel moldings. Quaint, quiet community close to all major highways shopping, recreation & more! Please Visit our Sales Office Open Tuesday - Sunday 10-4, Monday's by Appointment.
-
2019-06-30$358,000 New 691-char remark
Show marketing remark (691 chars)
Stop by to see why this is the premier address for your next home. Great value on this home. The active adult 55+ homes are located IN A MODERN, SECURE ELEVATOR BUILDING! This Sunlight Filled, southeast exposure, 956+sf, single level Jensen style home features an open eat-in granite kitchen, large living room w/private balcony, separate den/office, spacious master suite w/walk-in closet, full bath with stall shower, full sized side by side washer & dryer, hardwood flooring plus lots of crown & panel moldings. Quaint, quiet community close to all major highways shopping, recreation & more! Please Visit our Sales Office Open Tuesday - Sunday 10-4, Monday's by Appointment.
ⓘ Source: listings_history table (triggers on properties + properties_extension) + one-shot
backfill from property_details.listing_events for pre-trigger history.
Tax reassessment forecast MA · Partial reset (capped growth)
- Current annual tax
- $5,255 · $438/mo
- Projected year-2 tax
- $5,364 · $447/mo
- Expected delta
- +$109/yr (+$9/mo · 2.1%)
ⓘ Screening estimate from a state-policy table — verify with the county assessor before closing.
Climate risk First Street
- Flood 1/10 Low FEMA zone X (unshaded) · 0% chance over 30 yrs
- Wildfire 1/10 Low
- Heat 5/10 Major 7 d/yr ≥97°F today · 14 d/yr by 30 yrs out
- Wind 6/10 Major 27% chance of damaging wind over 30 yrs
- Air quality 3/10 Moderate 2 unhealthy d/yr today · 3 by 30 yrs out
Nearby sold comps map
Loading sold comps map…
Walkable amenities ~0.75 mi
Loading nearby amenities…
Taxation est. · year 1
- Rental income
- $27,194
- − Mortgage interest
- −$24,927
- − Property taxes
- −$5,255
- − Insurance
- −$2,225
- − Repairs & maintenance
- −$2,176
- − Management
- −$2,176
- − HOA
- −$4,572
- − Depreciation
- −$12,945
- Taxable loss
- −$27,081
- Est. tax savings @ 24.0%
- +$6,499
- After-tax cash flow
- $-12,073/yr
For passive investors: Depreciation is non-cash, so a rental often shows a tax loss while cash-flowing — sheltering income. Rental losses are passive: they offset passive income freely, and up to $25,000/yr can offset ordinary (W-2) income if you actively participate and your MAGI is under $100k (phasing out to $0 by $150k); unused losses carry forward. On sale, claimed depreciation is recaptured at up to 25%, and gains may owe capital-gains tax (a 1031 exchange can defer both). Figures are a year-1 estimate at your 24.0% rate — not tax advice; consult a CPA.
Schools (NCES district)
- District
- North Reading
- NCES district ID
- 2508820
- Math proficiency
- 62% ▼ -11.00%
- Reading proficiency
- 72% ▼ -3.00%
- Median HH income
- $108,803
- Composite
- 62.47/100
- National rank
- #690
- State rank
- #31 of 302 in MA
Livability — Wilmington
- Score
- 69/100
- State rank
- #142
- US rank
- #8640
Category grades
Schools grade is shown separately in the Schools card above.
Census & demographics
- County
- Middlesex County · 1,437,704 people
- City population
- 23,336
- Metro
- Boston-Cambridge-Newton, MA-NH
- Population (ZIP)
- 15,765
- Household income
- $147,768
- Rent vs Own
- Severe rent burden
- 411.0
Population outlook (Middlesex County) Hauer SSP2
- Today (2025)
- 1,740,269 people
- By 2030
- 1,817,187 · +4.4%
- By 2040
- 1,963,195 · +12.8%
- By 2050
- 2,087,461 · +20.0%
- By 2075
- 2,344,036 · +34.7%
- By 2100
- 2,383,776 · +37.0%
Race, ethnicity, and origin ACS 2023
- Neighborhood character
- Predominantly White (87%)
- Race & ethnicity
- White 87% Asian 5% Two or more races 5% Hispanic / Latino 2%
- Common ancestry
- Lithuanian 4% Romanian 3% Slovak 3%
- Foreign-born
- 7% · Canada, China
- Languages at home
- 91% English-only · Other Indo-European 4% Chinese 2% Spanish 2%
Political lean MEDSL · Middlesex
- 2024 margin
- Solid D (+39.5) · D 68.5% · R 29.0% · Other 2.5%
- 2008→2024 swing
- +9.3pp toward D · 2008: 30.1pp · 2024: 39.5pp
- All cycles
- 2024: D+39.5 2020: D+45.2 2016: D+38.1 2012: D+26.9 2008: D+30.1
Not yet ingested
- Civics
- —
Market trends
- HPI YoY
- ▲ 46.15%
- Current HPI
- 1288.93
- Rent YoY
- —
- Metro
- Boston-Cambridge-Newton, MA-NH
- State GDP YoY
- ▲ 2.28%
- F500 in state
- 38
Industry mix (Fortune 500 HQ in MA)
| Industry | F500 HQs | Revenue |
|---|---|---|
| Technology | 3 | $17B |
|
||
| Insurance | 2 | $84B |
|
||
| Retail | 2 | $76B |
|
||
| Life Sciences | 1 | $43B |
|
||
| Energy Technology | 1 | $31B |
|
||
| Aerospace / Defense | 1 | $18B |
|
||
Price history
-5.0% since first listed4 events — show timeline
- 2020-05-05 Sold (MLS) $340,000 MLS PIN
- 2020-03-01 Pending — MLS PIN
- 2020-01-20 Price Changed $344,995 MLS PIN
- 2019-06-30 Listed $358,000 MLS PIN
Property tax history
-0.4%/yrLatest (2025): $5,255 · -11.2% YoY. Source: county tax records.
Cash-flow waterfall
monthlySold comps — $/sqft
last 12 mo · ≤1 miLoading sold comps…