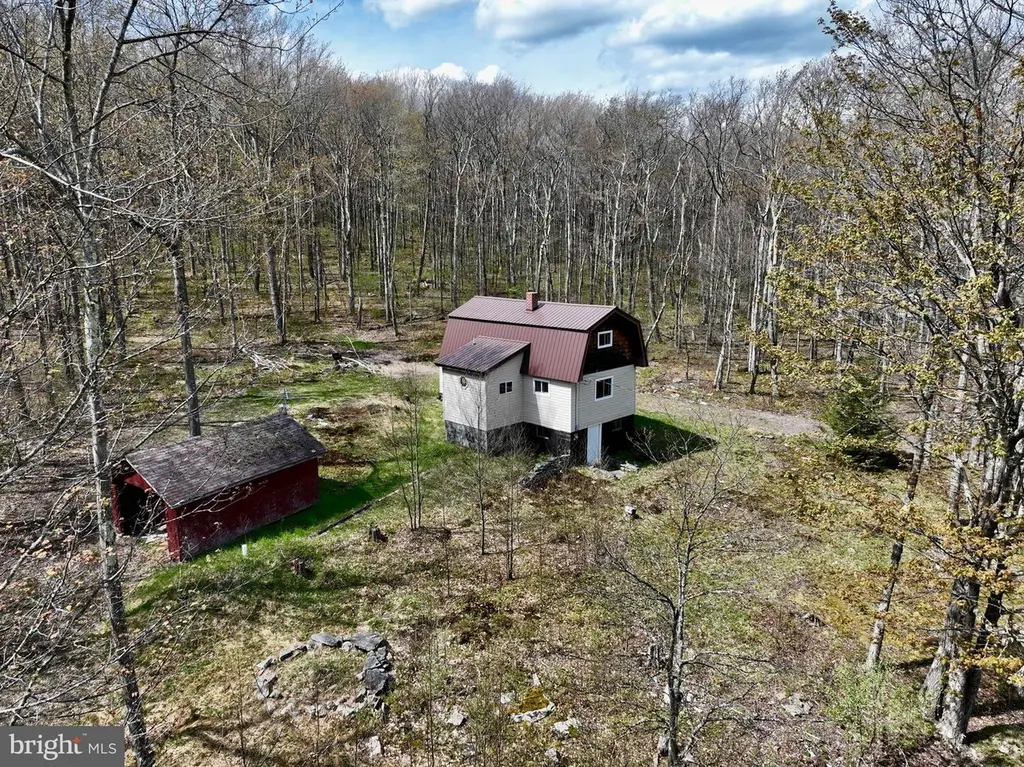
1290 Gaswell Rd · Jennings, MD
Flood risk 1/10 · Minimal
- FEMA flood zone
- X (unshaded)
- Chance of flooding over 30 yrs
- 0.0%
- Est. flood insurance / yr
- $473 – $860
Fire risk 3/10 · Minor
- Est. fire insurance / yr
- $755 – $1,403
Heat risk 1/10 · Minimal
- Hot days now (above 89°F)
- 6 days/yr
- Hot days in 30 yrs
- 14 days/yr
Wind risk 2/10 · Minimal
- Chance of severe wind over 30 yrs
- —
Air-quality risk 2/10 · Minimal
- Unhealthy air days now
- 1 days/yr
- Unhealthy air days in 30 yrs
- 2 days/yr
Risk factors via First Street. Map © Google.
Why this score? — see what drove the A- grade
The composite is a weighted blend of 9 inputs, each scored 0–100. Each bar is that input's sub-score; the figure is the points it added to the 100-point composite (weight × sub-score).
- Cash flow +30.0/30.0
- ARV discount +15.0/15.0
- 1% rule +10.0/10.0
- DSCR +10.0/10.0
- Appreciation +10.0/10.0
- Rent growth +2.5/5.0
- Condition / age +2.5/5.0
- Livability +2.2/5.0
- Schools +2.0/10.0
$100,000
🖨 Deal sheet (PDF) 📄 Offer letter ✓ Due diligence
Listing remarks
Nestled on a private 1.14 acres, this property offers a secluded location perfect for buyers seeking quiet country living with room to grow. The cozy 2 Bed/1 bath cabin is a fixer-upper being sold As-Is, presenting an ideal canvas for those wanting to customize a personal retreat. On-site amenities include an existing well, septic, and a 100A electrical service, ready for future improvements. A detached garage adds valuable storage or workshop space, complementing the rustic charm of the property. With plenty of outdoor space for gardening, expansion, or simply enjoying nature, this home invites you to create your own mountain-hideaway or rustic retreat with substantial potential. Schedule
Key facts
- 1.14 acre lot
- Built 1984
- Listed 45 days
Property features AI
Finance
- Other: Fee simple ownership
Exterior
- Parking: Driveway
- Utilities: Well water; Perc-approved septic; Electric service available
- Home design: Detached structure; Metal roof; Frame construction
- Construction: Block and brick/mortar foundation; Above-grade and below-grade structures
- Exterior features: Property backs to trees; Partly wooded, private and secluded setting
Interior
- Bedrooms: Two bedrooms on the upper level
- Bathrooms: One full bathroom on the main level; One full bathroom total
- Heating & cooling: Forced air heating; Oil-fired heating; Electric hot water
- Interior features: Finished upper living area measured by assessor; Walkout unfinished basement with windows
Neighborhood map
What this means for you Summary
Snapshot
- This is a 2-bed/1.0-bath single-family listed at $100k.
Deal economics
- At list price, monthly cash flow is $612 ($7k/yr) — positive.
- The deal already cash-flows at list — no discount required.
- Meets the 1% rule at list price ($2k rent vs $100k).
- Recommended offer: $97k (3.0% below list) — sets the bar for market timing.
Location & tenants
- Location reads 44/100 on livability (#479 in MD) — a working-class tenant base; expect higher turnover. Strengths: cost of living A+, crime A; Watch: amenities F, commute F, employment F.
- Garrett County Public Schools (rural): math 17% / reading 30% proficiency, ranked #16 of 24 in MD (top 67%) — low school quality limits family demand, transient renter base, plan for 1-2y turnover.
- Zoned schools: Grantsville Elementary (math 12% / reading 12%, grade F, #550 of 860 statewide, top 66%, 171 students, 59% FRL); Northern Middle School (math 16% / reading 37%, grade F, #86 of 225 statewide, top 40%, 320 students, 39% FRL); Northern Garrett High School (math 42% / reading 77%, grade C+, #73 of 222 statewide, top 34%, 439 students, 37% FRL).
- Market conditions: 21 active listings in the ZIP; 122 units permitted in Garrett County in 2024 (0 in 5+ unit buildings).
Forward outlook
- In year one you build about $11k of equity ($691 loan paydown + $10k appreciation (10.0% local appreciation)).
- Garrett County population projected at -23% by 2050 — secular population decline; favor cash flow + early exit over multi-decade hold.
- At projected returns (10.0% appreciation + 3.0% rent growth), your $28k cash investment doubles in ~2 years — after that, you're playing with house money.
- By year 4, paydown + projected appreciation supports a ~$38k cash-out refi (75% LTV) — recoverable capital for the next deal without selling this one.
Negotiation context
- It's been on market 46 days — a 3% lower offer ($97k) is reasonable based on typical stale-listing flexibility.
- 5 sale attempts since 13y ago; this cycle's ask has dropped $20k (17%) from the opening price — seller is motivated, your offer sets the floor, not the list.
- Current owner paid $48k; list at $100k implies a 111% gain — meaningful room to come down on a strong offer.
Questions for the listing agent
- It's been on market 46 days. Have you received any prior offers? Is the seller open to a 3% concession, seller financing, or rate buy-down credit?
- Is there a deadline driving the sale (1031 exchange, divorce, estate, relocation)? That informs how much negotiation room exists.
- Schools are F-rated, which usually means shorter tenancies and higher turnover. Who's the typical renter profile here, and what's been the actual vacancy rate?
- What's the average days-on-market for RENTAL listings here right now (not sales)? A rising rental-DOM trend means longer vacancies and softer asking-rent achievability than the comps imply.
- What's the recent tenant-quality profile in this submarket — average credit score on applications, eviction rate, late-payment / NSF rate, and stable-employment percentage? A property-management company in the area should have these aggregated.
- How much new for-sale + rental construction is in the pipeline within 1–3 miles? Heavy new supply typically softens prices + rents 12–24 months out; constrained supply supports both.
Investment metrics
- 1% rule
- 1.55% ✓
- Cap rate
- 13.64%
- Cash-on-cash
- 26.23%
- DSCR
- 2.17
- GRM
- 5.4
CMA / ARV
- ARV (median comp)
- $183,325
- List price
- $100,000
- Delta
- -45.45%
- Verdict
- UNDERPRICED
- Comps
- 3 within 1.0 mi
Projected returns pro-forma
10.0% appreciation · 3.0% rent growth · sell at horizon
- IRR
- 44.1%
- Equity multiple
- 4.34×
- Total profit
- $93,413
- Equity at exit
- $90,088
- IRR
- 38.1%
- Equity multiple
- 9.73×
- Total profit
- $244,380
- Equity at exit
- $194,278
Cash invested: $28,000 (down + closing). Projections, not guarantees.
Landlord ↔ Tenant lean methodology
- Overall (STATE)
- 27 Tenant-Leaning
- State Maryland
- 27 Tenant-Leaning · D+14
- County
- — inherits STATE
- City
- — inherits STATE
ZIP-level market 21536
- Home prices YoY
- 10.3%
- Active inventory
- 21
- Price-to-rent
- 5.4×
Monthly cashflow live
- Estimated rent
- $1,545 medium interval (Pro) →
- Mortgage (P&I)
- −$524
- Tax from tax record
- −$43 /mo · $514/yr
- Insurance
- −$42
- HOA
- −$0
- Lot rent
- −$0
- Vacancy / Maint / Mgmt
- −$325
- Net cashflow
- $612
Break-even live
Sensitivity live
| Price | -10% $669 | -5% $640 | +0% $612 | +5% $584 | +10% $555 |
|---|---|---|---|---|---|
| Rent | -10% $490 | -5% $551 | +0% $612 | +5% $673 | +10% $734 |
| Rate | -1.0pp $662 | -0.5pp $637 | base $612 | +0.5pp $586 | +1.0pp $560 |
UW: 25.0% down · 7.5% · 30yr · 1.5% tax · 5.0% vac · 8.0% maint · 8.0% mgmt
Financing live
Cash to close
- Down payment
- $25,000
- Closing costs
- $3,000
- Reserves months
- —
- Total cash needed
- —
Loan-product check · same deal, 3 products live
Conventional
25% down · 7.5% · 30yr
- Down + closing
- —
- Monthly P&I
- —
- Monthly cashflow
- —
- DSCR
- —
- Eligible?
- —
Personal DTI + credit; lowest rate.
DSCR
20% down · 8.5% · 30yr
- Down + closing
- —
- Monthly P&I
- —
- Monthly cashflow
- —
- DSCR
- —
- Eligible?
- —
No personal income docs; deal must DSCR.
Hard money
10% down · 12.0% · 12mo
- Down + closing
- —
- Monthly P&I
- —
- Monthly cashflow
- —
- DSCR
- —
- Eligible?
- —
Short-term bridge; refi at stabilization.
Listing history 32 events
-
2026-06-22days on market $100,000 Active 46 DOM
-
2026-06-21days on market $100,000 Active 45 DOM
-
2026-06-21days on market $100,000 Active 44 DOM
-
2026-06-18days on market $100,000 Active 42 DOM
-
2026-06-17days on market $100,000 Active 41 DOM
-
2026-06-16days on market $100,000 Active 40 DOM
-
2026-06-15days on market $100,000 Active 39 DOM
-
2026-06-13days on market $100,000 Active 37 DOM
-
2026-06-12days on market $100,000 Active 36 DOM
-
2026-06-09days on market $100,000 Active 33 DOM
-
2026-06-08days on market $100,000 Active 32 DOM
-
2026-06-07days on market $100,000 Active 31 DOM
-
2026-06-07days on market $100,000 Active 30 DOM
-
2026-06-04days on market $100,000 Active 27 DOM
-
2026-06-02days on market $100,000 Active 26 DOM
-
2026-06-01days on market $100,000 Active 25 DOM
-
2026-05-31price $100,000 Active 24 DOM
-
2026-05-31days on market $120,000 Active 24 DOM
-
2026-05-31days on market $120,000 Active 23 DOM
-
2026-05-08$120,000 Active 744-char remark
-
2026-05-06historical $120,000 744-char remark
-
2014-07-17historical Expired
-
2014-07-17historical
-
2014-04-30price
-
2013-11-16price
-
2013-08-18status Active
-
2013-08-17historical
-
2013-08-16status Active
-
2013-08-16historical
-
2013-07-19Active
-
2013-07-19$50,000
-
2008-08-13soldstatus $47,500
ⓘ Source: listings_history table (triggers on properties + properties_extension) + one-shot
backfill from property_details.listing_events for pre-trigger history.
Tax reassessment forecast MD · Partial reset (capped growth)
- Current annual tax
- $514 · $43/mo
- Projected year-2 tax
- $802 · $67/mo
- Expected delta
- +$288/yr (+$24/mo · 56.0%)
ⓘ Screening estimate from a state-policy table — verify with the county assessor before closing.
Climate risk First Street
- Flood 1/10 Low FEMA zone X (unshaded) · 0% chance over 30 yrs
- Wildfire 3/10 Moderate
- Heat 1/10 Low 6 d/yr ≥89°F today · 14 d/yr by 30 yrs out
- Wind 2/10 Low
- Air quality 2/10 Low 1 unhealthy d/yr today · 2 by 30 yrs out
Nearby sold comps map
Loading sold comps map…
Walkable amenities ~0.75 mi
Loading nearby amenities…
Taxation est. · year 1
- Rental income
- $18,545
- − Mortgage interest
- −$5,602
- − Property taxes
- −$514
- − Insurance
- −$500
- − Repairs & maintenance
- −$1,484
- − Management
- −$1,484
- − Depreciation
- −$2,909
- Taxable income
- $6,053
- Est. tax owed @ 24.0%
- −$1,453
- After-tax cash flow
- $5,891/yr
For passive investors: Depreciation is non-cash, so a rental often shows a tax loss while cash-flowing — sheltering income. Rental losses are passive: they offset passive income freely, and up to $25,000/yr can offset ordinary (W-2) income if you actively participate and your MAGI is under $100k (phasing out to $0 by $150k); unused losses carry forward. On sale, claimed depreciation is recaptured at up to 25%, and gains may owe capital-gains tax (a 1031 exchange can defer both). Figures are a year-1 estimate at your 24.0% rate — not tax advice; consult a CPA.
Schools (NCES district)
- District
- Garrett County Public Schools
- NCES district ID
- 2400360
- Math proficiency
- 17% ▼ -16.00%
- Reading proficiency
- 30% ▼ -13.00%
- Median HH income
- $45,705
- Composite
- 20.36/100
- National rank
- #8600
- State rank
- #16 of 24 in MD
Livability — Jennings
- Score
- 44/100
- State rank
- #479
- US rank
- #26834
Category grades
Schools grade is shown separately in the Schools card above.
Census & demographics
- Population (ZIP)
- 3,829
Population outlook (Garrett County) Hauer SSP2
- Today (2025)
- 28,304 people
- By 2030
- 27,248 · -3.7%
- By 2040
- 24,596 · -13.1%
- By 2050
- 21,703 · -23.3%
- By 2075
- 15,766 · -44.3%
- By 2100
- 11,363 · -59.9%
Race, ethnicity, and origin ACS 2023
- Neighborhood character
- Predominantly White (98%)
- Race & ethnicity
- White 98%
- Common ancestry
- Slovak 3% Romanian 2% Serbian 1%
- Foreign-born
- 1% · Canada
- Languages at home
- 98% English-only · German/W. Germanic 1%
Political lean MEDSL · Garrett
- 2024 margin
- Solid R (+54.0) · D 21.9% · R 75.9% · Other 2.2%
- 2008→2024 swing
- -13.9pp toward R · 2008: -40.1pp · 2024: -54.0pp
- All cycles
- 2024: R+54.0 2020: R+55.9 2016: R+61.5 2012: R+52.1 2008: R+40.1
Not yet ingested
- Civics
- —
Market trends
- HPI YoY
- ▲ 29.24%
- Current HPI
- 313.3183
- Rent YoY
- —
- Metro
- —
- State GDP YoY
- ▲ 2.97%
- F500 in state
- 12
Industry mix (Fortune 500 HQ in MD)
| Industry | F500 HQs | Revenue |
|---|---|---|
| Aerospace / Defense | 1 | $71B |
|
||
| Utilities | 1 | $25B |
|
||
| Hotels | 1 | $24B |
|
||
| Consumer Goods | 1 | $7B |
|
||
| Real Estate | 1 | $6B |
|
||
| Chemicals | 1 | $2B |
|
||
Price history
+110.5% since first listed14 events — show timeline
- 2026-05-31 Price Changed $100,000 BRIGHT MLS
- 2026-05-08 Listed $120,000 BRIGHT MLS
- 2026-05-06 Coming Soon $120,000 BRIGHT MLS
- 2014-07-17 Delisted — MRIS
- 2014-07-17 Listing Removed — BRIGHT MLS
- 2014-04-30 Price Changed — MRIS
- 2013-11-16 Price Changed — MRIS
- 2013-08-18 Relisted — MRIS
- 2013-08-17 Delisted — MRIS
- 2013-08-16 Relisted — MRIS
- 2013-08-16 Delisted — MRIS
- 2013-07-19 Listed — MRIS
- 2013-07-19 Listed $50,000 BRIGHT MLS
- 2008-08-13 Sold (Public Records) $47,500 Public Records
Property tax history
+1.6%/yrLatest (2025): $514 · +1.5% YoY. Source: county tax records.
Cash-flow waterfall
monthlySold comps — $/sqft
last 12 mo · ≤1 miLoading sold comps…